

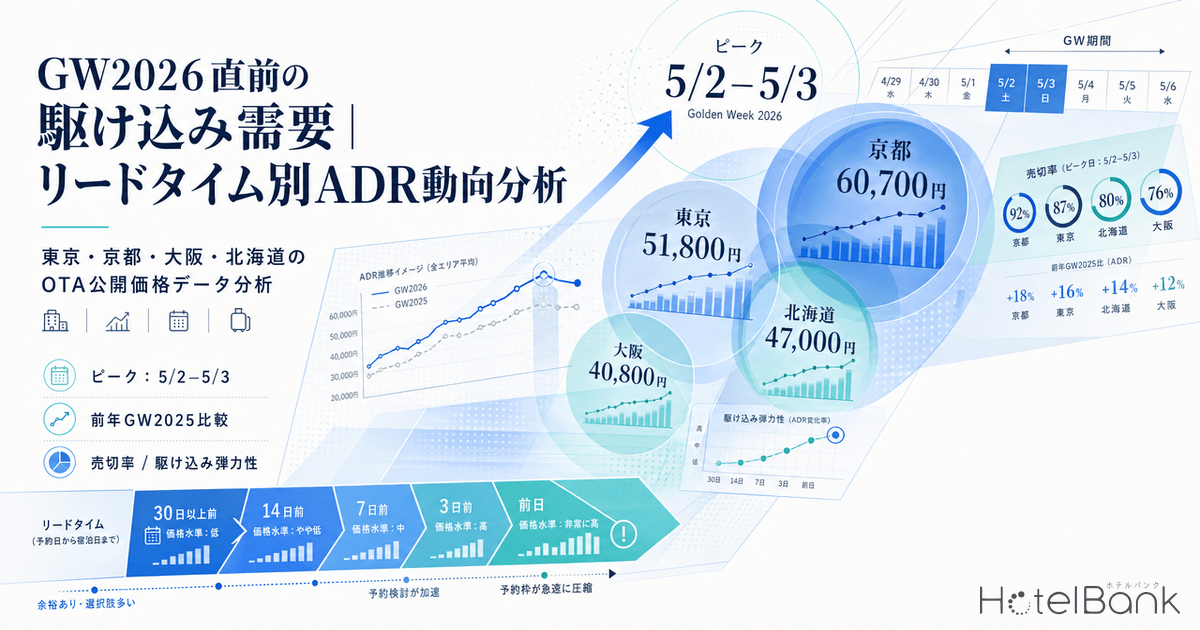
With just three days remaining until the opening of Japan’s 2026 Golden Week (April 29 – May 6), revenue managers and hotel investors are focused on two critical questions: how much last-minute demand has accumulated at the shortest lead times, and which price bands remain unsold and may become targets for final markdowns. Drawing on OTA public price data collected by MetroEngines Research across four major destinations (Tokyo, Kyoto, Osaka, and Hokkaido), this article provides a precise lead-time-based analysis of GW2026 sales conditions as of April 26. By comparing year-over-year against GW2025, we also identify which areas have seen rush-hour elasticity expand and which have seen it contract.
Metric Definitions Used in This Article
- ADR (Average Daily Rate): The mean of public sale prices listed on OTAs and similar channels. This differs from actual booked rates. Calculated as the per-room rate (tax included) for double occupancy, averaged across all plan types (room-only through meal-inclusive).
- Sellout Rate: The share of plans on OTAs whose booking acceptance had been closed at the time of measurement. This differs from total facility-level occupancy.
- Data Source: MetroEngines Research
Daily ADR Trends Across 4 Cities Just Before GW2026
First, let us examine daily ADR across the four cities for the eight-day window from April 29 to May 6. The chart below shows the average sale price by check-in date for each city. The first half (April 29 – May 1) is treated as weekday-equivalent with suppressed pricing, while the peak concentrates in the middle (May 2 – 4). The final day, May 6, shows rates rapidly converging downward toward the close of the holiday — a structure shared across all four cities.
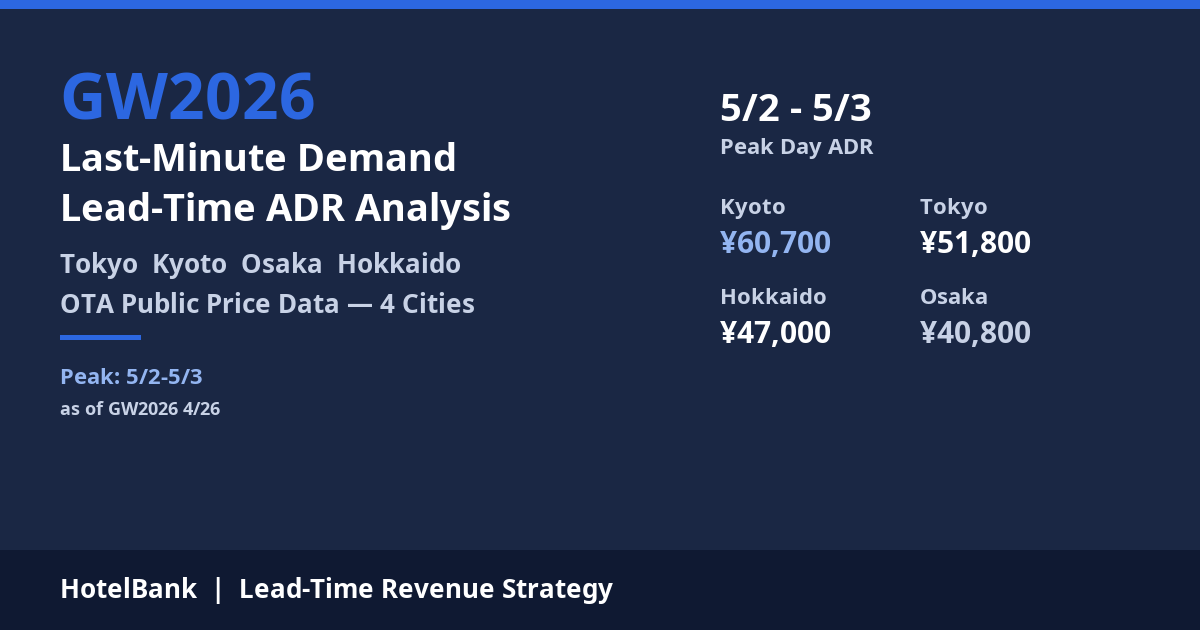
What stands out is Kyoto’s absolute price level. On the peak date of May 3, Kyoto’s ADR reaches ¥60,700, well above Tokyo’s ¥51,800 on the same day, Hokkaido’s ¥47,000 on May 2, and Osaka’s ¥40,800 on May 3. With its temple-and-shrine tourism and kimono experiences driving a high inbound-mix demand structure, Kyoto is an area where aggressive pricing tends to hold during major holidays like Golden Week.
Source: MetroEngines Research, compiled by HotelBank Editorial Team (as of April 26; N = Tokyo 1,820–1,935 / Kyoto 1,579–1,619 / Osaka 864–885 / Hokkaido 1,594–1,709 properties)
By contrast, Osaka’s peak-day (May 3) ADR of ¥40,800 is the lowest among the four cities. As discussed below, this reflects in large part the rebound from GW2025, when Osaka rates hit a historical high during the Osaka-Kansai Expo period.
Sellout Rates by Lead Time: Demand Absorption Accelerates Toward May 3
Next, let us examine sellout rates by date as of April 26 (i.e., at lead times of 3 to 10 days). Here, the sellout rate is defined as the share of sales plans whose booking acceptance had been closed at the time of measurement. While this differs from total facility occupancy, it is a useful indicator for capturing the pace of demand absorption.
Source: MetroEngines Research, compiled by HotelBank Editorial Team (as of April 26; total N across 4 cities = 2,080,547 plans)
Across all four cities, sellout rates climb toward the peak (May 2–3) and then decline sharply from May 5 onward, drawing the classic mountain-shaped profile. The most pronounced peak appears in Osaka, where the May 4 sellout rate reaches 38.9% — the highest among the four. This suggests that peak-day plans are nearing full booking, with only limited inventory remaining.
Hokkaido also records a high May 3 sellout rate of 41.9%, the highest figure among the four cities. High-rate resort and onsen plans have likely sold out earlier, leaving relatively thin inventory. Kyoto, on the other hand, holds at just 31.2% on its peak day, suggesting that aggressive pricing may be slightly restraining the pace of demand absorption.
Inventory Trends by Price Band: ¥20,000–¥30,000 Business Hotels Remain
So which price bands remain unsold and may become final-markdown targets? The table below buckets sales plans across the four cities for April 29 – May 6 into six price bands and shows the corresponding sellout rates.
| Price Band | Tokyo | Kyoto | Osaka | Hokkaido |
|---|---|---|---|---|
| Under ¥15,000 | 18.9% | 19.9% | 19.7% | 20.4% |
| ¥15,000–25,000 | 23.1% | 22.0% | 23.6% | 22.2% |
| ¥25,000–35,000 | 24.9% | 22.5% | 25.8% | 24.2% |
| ¥35,000–50,000 | 25.3% | 22.1% | 25.3% | 25.0% |
| ¥50,000–80,000 | 24.5% | 20.0% | 23.8% | 25.3% |
| ¥80,000 and above | 22.9% | 21.5% | 26.4% | 22.0% |
Source: MetroEngines Research, compiled by HotelBank Editorial Team (total N = 3,431,027 plans, April 29 – May 6 period)
What the table makes clear is that the lowest band (under ¥15,000) shows the lowest sellout rates across all four cities (18.9–20.4%). At first glance this seems counterintuitive — if it is cheap, it should sell — but the reality is the opposite. The lowest band has high inherent supply volume and includes residual inventory marked down at the last minute, so a relatively large share has yet to reach sellout.
What stands out is that the mid-range band (¥25,000–35,000, centered on business hotels) shows a four-city average sellout rate of 24.4% — about five points higher than the lowest band. In other words, mid-priced inventory anchored on business hotels — the band most easily reachable by family travelers — is absorbing the most demand, while the bands above (¥35,000 and up) are seeing slightly slower absorption.
Source: MetroEngines Research, compiled by HotelBank Editorial Team
For revenue managers, the implication is that the ¥25,000–50,000 band is tightening toward the peak, so mechanical markdowns within a 3-day lead time would be unwise. By contrast, the ¥80,000+ luxury band remains in the low-to-mid 20% sellout range across Tokyo, Osaka, and Hokkaido, where agile channel expansion and packaging strategies are likely more effective.
vs. GW2025: Regional Disparities in Last-Minute Elasticity
Finally, we quantify each area’s last-minute elasticity by comparing against GW2025 (same period). The chart below places the eight-day average ADR for each of the four cities side-by-side for GW2025 and GW2026.
Source: MetroEngines Research, compiled by HotelBank Editorial Team (GW period = April 29 – May 6; daily ADR averaged simply across 8 days)
| Area | GW2026 Avg. ADR | GW2025 Avg. ADR | YoY | Peak/Weekday Spread |
|---|---|---|---|---|
| Hokkaido | ¥38,100 | ¥34,500 | +10.2% | +55% |
| Kyoto | ¥49,500 | ¥46,200 | +7.2% | +53% |
| Tokyo | ¥41,800 | ¥40,000 | +4.5% | +61% |
| Osaka | ¥31,500 | ¥35,700 | -11.7% | +76% |
Source: MetroEngines Research, compiled by HotelBank Editorial Team
The strongest expansion in last-minute elasticity belongs to Hokkaido (+10.2%). Resort demand around Sapporo, Jozankei, and Hakodate has held firm against the weak yen, supported by both inbound and domestic traffic, allowing properties to sell at price levels above prior-year GW. Kyoto follows (+7.2%), reflecting the combined effect of temple-and-shrine tourism, secondary cherry-blossom demand, and the spring inbound peak.
By contrast, Osaka recorded YoY -11.7%, the only negative print among the four cities. This largely reflects the rebound from peak demand effects of the 2025 Osaka-Kansai Expo, during which Osaka’s ADR reached an all-time high of ¥35,700/night during this same period. After the Expo closed (October 2025), accommodation demand in central Osaka has structurally normalized, and GW2026 can be positioned as a phase of payback decline. The fact that the spread indicator (peak day vs. weekday) reaches an unusually high +76% in Osaka alone can be read as a reflection of significantly contracted weekday demand.
From a revenue manager perspective, given that demand elasticity has weakened in Osaka during the immediate-window period (1–3 days lead time), shifting from mechanical aggressive pricing to end-stage promotions, packaging, and conversion to corporate channels may yield greater revenue contribution. Conversely, in Hokkaido and Kyoto, where peak-day (May 2–3) inventory is tightening, holding firm on aggressive pricing in the final stretch is the standard play.
Conclusion: Revenue Strategy at a 3-Day Lead Time
Several important implications emerge from this analysis for the immediate run-up to GW2026. First, peak-day (May 2–3) sellout rates have reached 28–42% across all four cities, indicating no need for further peak-day rate cuts. Holding firm on aggressive pricing — leveraging the scarcity of remaining plans — is the rational play. Second, the ¥25,000–50,000 mid-range is absorbing demand well, and mechanical markdowns risk impairing revenue opportunities. Final markdowns should be limited to the ¥80,000+ luxury band and the under-¥15,000 lowest band, where channel expansion and package sales tend to be effective.
Third, regional disparities in last-minute elasticity are pronounced. Hokkaido (+10.2%) and Kyoto (+7.2%) are firmly above prior year, Tokyo (+4.5%) is solid, and Osaka (-11.7%) is in a structural correction phase reflecting the Expo rebound. Last-minute pricing strategies need to be flexible — incorporating area-specific characteristics and event cycles rather than applying one-size-fits-all rules.
The final selling phase of GW2026 begins three days after the publication of this article (April 26). Revenue managers should benchmark their property’s inventory absorption pace against the four-city levels and confirm peak-day vs. shoulder-day rate differentiation in the final window.