

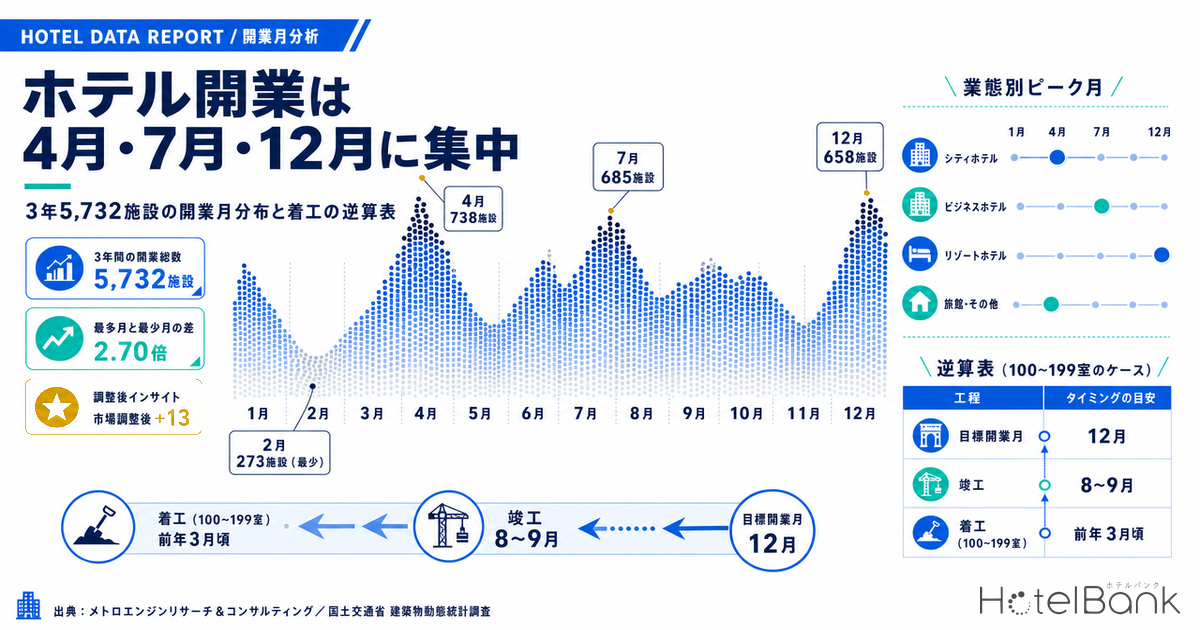
Which month should you open a property in? That question is all but settled at the stage when the project schedule is drawn. Re-sorting by opening month the 5,732 properties that opened between 2023 and 2025 and could be confirmed on major OTA listings reveals clear peaks in April, July and December, and troughs in February, May and November. The gap between the busiest month, April (738 properties), and the quietest, February (273 properties), is 2.70x. On a room-count basis the gap widens further, to 3.13x between July (16,250 rooms) and January (5,193 rooms). This article sets out, using measured figures, how that distribution shifts by property type and scale, how the opening month relates to the ramp-up of first-year room rates, and where to place groundbreaking and building-confirmation filing when working backwards from a target opening month.
Metric Definitions Used in This Article
- Opening month: The year and month a property opened, as confirmed by MetroEngines Research on major OTA listings. Because 47.3% of all records carry the date at month-level granularity only, every aggregation in this article is performed by month. This is not a complete census — it covers the range for which listings could be confirmed.
- ADR (average daily rate): An estimated settled rate (tax-excluded equivalent) calculated by applying a property-type correction factor to the lowest published plan level each property lists on OTAs (two guests per room, per-room price, tax included). Cross-checked against the property-level results disclosed by listed hotel REITs (91 properties, most recent three months), the median error is approximately 7%. These are estimates and differ from each property’s actual transacted prices and accounting figures. Area-level ADR is the median across the target properties (the level of a typical property in that area).
- Construction period: The number of days from the construction start date on the building plan to the scheduled completion date. These are plan-based values drawn from the Ministry of Land, Infrastructure, Transport and Tourism (MLIT) Building Construction Dynamics Statistics Survey (建築動態統計調査).
- Data sources: MetroEngines Research & Consulting / MLIT Building Construction Dynamics Statistics Survey
- — April 738 properties, July 685 and December 658 form the three peaks among 5,732 properties over three years. Against the low of 273 in February that is a 2.70x gap; on a room-count basis, July 16,250 rooms versus January 5,193 rooms widens it to 3.13x.
- — Only December is weighted toward the second half of the month. April concentrates 61.9% in the first ten days and July 63.4%, while in December 36.5% falls on the 21st or later, aiming squarely at the run-up to the New Year holidays.
- — Peak months split by property type. Glamping peaks in April at 20.1%, ryokan in July at 17.1%, hostels in December at 15.4%. Business hotels alone hold all three peaks evenly and show the smallest month-to-month spread.
- — +13.2% market-adjusted is the standard uplift from launch to the same month in year two (30+ rooms, N=480 properties). Openings in months adjacent to peak season run +11.7%, quieter months +14.4% — a split between fast starters and slow builders.
- — Break ground 19 to 25 months before opening. Median construction periods run 16.0 months for 30–99 rooms and 21.4 months for 200+ rooms; add four months of post-completion preparation and the countdown point is fixed. Building-confirmation filing sits roughly 3.2 months earlier still.
A 2.70x Gap Between Months — Three Peaks in April, July and December
Over the three years from 2023 to 2025, the properties whose openings could be confirmed on major OTA listings total 5,732 properties and 124,248 rooms. Distributed across the twelve months by opening month, the pattern departs clearly from uniform.
Source: MetroEngines Research & Consulting (based on confirmed OTA listings, N=5,732 properties / 124,248 rooms)
The property-count peaks are April (738 properties, 12.9% of the total), July (685, 12.0%) and December (658, 11.5%). The troughs are February (273, 4.8%), May (347, 6.1%) and January (359, 6.3%). Indexed against the twelve-month average set at 100, April reads 155, July 143 and December 138. February, by contrast, reads 57 — short of 60% of the average.
Switch to a room-count basis and the order of the peaks changes. July takes the lead at 16,250 rooms (13.1%), followed by December at 15,799 rooms (12.7%) and April at 14,286 rooms (11.5%). March (12,716 rooms, 10.2%) and October (11,384 rooms, 9.2%) both climb well above their property-count rankings. In other words, March and October are months with fewer projects but larger ones.
| Opening month | Properties | Share | Rooms | Share | Per property |
|---|---|---|---|---|---|
| January | 359 | 6.3% | 5,193 | 4.2% | 14.5 rooms |
| February | 273 | 4.8% | 7,039 | 5.7% | 25.8 rooms |
| March | 449 | 7.8% | 12,716 | 10.2% | 28.3 rooms |
| April | 738 | 12.9% | 14,286 | 11.5% | 19.4 rooms |
| May | 347 | 6.1% | 6,872 | 5.5% | 19.8 rooms |
| June | 470 | 8.2% | 9,764 | 7.9% | 20.8 rooms |
| July | 685 | 12.0% | 16,250 | 13.1% | 23.7 rooms |
| August | 504 | 8.8% | 8,913 | 7.2% | 17.7 rooms |
| September | 442 | 7.7% | 8,994 | 7.2% | 20.3 rooms |
| October | 415 | 7.2% | 11,384 | 9.2% | 27.4 rooms |
| November | 392 | 6.8% | 7,038 | 5.7% | 18.0 rooms |
| December | 658 | 11.5% | 15,799 | 12.7% | 24.0 rooms |
| Total | 5,732 | 100% | 124,248 | 100% | 21.7 rooms |
Source: MetroEngines Research & Consulting (based on confirmed OTA listings, openings 2023–2025 / N=5,732 properties)
Which Day of the Month They Open — Each Peak Stands for a Different Reason
Why April, July and December get chosen comes into focus once you look at where within the month the opening date is placed. The three peaks may all be peaks, but their centres of gravity within the month are entirely different.
Source: MetroEngines Research & Consulting (based on confirmed OTA listings, openings 2023–2025 / April N=738, July N=685, December N=658)
April concentrates 457 openings, or 61.9% of the month, in the first ten days. These are openings timed to the turn of the Japanese fiscal year, and the intent to ride the annual cycle of corporate contracts, municipal projects and new-graduate hiring is readable in the pattern. July concentrates even harder at the top of the month: 434 of 685 properties, or 63.4%, open by the 10th. That is the line for making the summer-holiday and Marine Day demand period.
December takes a different shape. Only 328 openings (49.8%) fall in the first ten days, while 240 (36.5%) land on the 21st or later — the only one of the three peaks weighted toward the back half of the month. These are openings aimed at the run-up to the New Year holidays, one of Japan’s largest domestic demand periods, positioning the property to run at high occupancy and high rates from day one. The share of openings recorded on the 1st of the month is also lowest in December at 31.3% (the other eleven months average 49.4%), indicating a month in which the specific date is deliberately designed.
A second clue lies in the distribution of construction start months. Among the plan data drawn from MLIT’s Building Construction Dynamics Statistics Survey, sorting the 950 hotel projects of 30 rooms or more that broke ground between 2018 and 2025 by start month gives January (115 projects), April (107) and March (96) as the heaviest, with December (51) the lightest. Groundbreaking leans to the first half of the year; completion and opening lean to the start of the fiscal year, early summer and year-end. What sits between these two calendars is the construction period examined in the next section.
Peaks Shift by Property Type — Ryokan in July, Hostels in December, Glamping in April
The overall distribution is no more than an average across the property-type mix. Recomputed as each type’s share within its own category, the peak months separate cleanly by type.
Source: MetroEngines Research & Consulting (based on confirmed OTA listings, openings 2023–2025 / rental villas N=2,309, business hotels N=722, resort hotels N=280, ryokan N=216)
| Property type | 3-year total | Peak month | Peak-month share | Runner-up |
|---|---|---|---|---|
| Rental villas | 2,309 | December | 12.3% | July 11.9% |
| Business hotels | 722 | July | 13.0% | April 11.8% |
| Guesthouses | 507 | April | 14.2% | December 12.2% |
| Cottages | 427 | April | 14.3% | July 13.8% |
| Hostels | 298 | December | 15.4% | April 12.8% |
| Resort hotels | 280 | April | 16.8% | December 13.9% |
| Ryokan | 216 | July | 17.1% | April 13.0% |
| Glamping | 194 | April | 20.1% | July 17.5% |
Source: MetroEngines Research & Consulting (based on confirmed OTA listings, openings 2023–2025)
The more outdoor the format, the stronger the spring concentration. Glamping puts 20.1% into April and 17.5% into July — 37.6% of the year in those two months alone — against just 4.1% in December. The more seasonal the product, the more rational it is to open at the head of the season, and that judgment shows up directly in the distribution. Ryokan peak in July at 17.1%, aimed at family demand ahead of the summer holidays.
Urban formats behave a little differently. Business hotels run July 13.0%, April 11.8% and December 10.5% — all three peaks held evenly, and among the smallest month-to-month spreads of any type. With year-round business-travel demand as a base, the incentive to cluster opening dates into a particular season is relatively weak. Hostels peak in December at 15.4%, a launch timed to the year-end travel demand of both domestic and inbound guests.
Properties of 100+ Rooms Lean to December, March and October — Larger Scale Spreads the Peaks
Broken out by scale, yet another structure appears. Properties were split into four room-count bands, and the monthly share taken within each band.
Source: MetroEngines Research & Consulting (based on confirmed OTA listings, openings 2023–2025 / 1–9 rooms N=4,242, 10–29 rooms N=623, 30–99 rooms N=484, 100+ rooms N=383)
The small band of 1 to 9 rooms (4,242 properties, most of them rental villas and cottages) shows tall peaks at April 12.5%, July 12.2% and December 11.7%, falling to 4.7% in February. Construction periods here are short and the opening date is easy to align with the demand calendar — this is the band with the greatest freedom to concentrate openings at the head of a season.
At 100 rooms and above (383 properties), the peak month is December (13.1%), followed by April at 12.0% and July at 11.7%, with March and October both sitting high at 10.4%. The top five months sum to 57.6%, not far from the same measure in the small band (April, July, December, August and June at 53.5%), but the distinguishing feature is that the peaks are spread across five months. Large projects carry long construction periods, and the completion date is hard to shift in either direction. That pushes operators to target whichever demand period is nearest once completion is done — and peaks form in March and October as a result.
The standing of March and October also shows in rooms per property. March openings average 28.3 rooms and October openings 27.4 rooms, the largest and second-largest of the twelve months; January openings, by contrast, are the smallest at 14.5 rooms. Completions of large projects timed to fiscal year-end accounts, and openings aimed at the autumn travel season, are what lift the scale of these two months.
Opening Month and Launch ADR — +13.2% Market-Adjusted by the Same Month in Year Two
How does the choice of opening month relate to the ramp-up of first-year room rates? Here, among properties that opened with 30 rooms or more, we took the 480 whose OTA listing could be confirmed within three months of the opening month and which were still listed in the same calendar month twelve months later, and compared estimated settled ADR at launch with the same month in year two. Because this compares the same property in the same calendar month, seasonal factors are removed by design.
The overall median is +17.2%. But market-wide rates also moved over this period, so adjusting by the growth in the market level for the same prefecture and the same two-month pair as each property (median +3.8%) leaves a property-specific ramp-up of +13.2%. A little over ten percent of uplift in the year following the immediate post-opening level is the standard trajectory the measured data shows.
Source: MetroEngines Research & Consulting (estimated settled ADR, 30+ rooms, openings 2023–2025 / N=480 properties)
Split by opening month, the size of that uplift differs. Properties opening in months adjacent to peak season (March, April, July and December, N=243) ran +15.7% on their own numbers and +11.7% market-adjusted, while those opening on the quieter side (January, February, May, September, October and November, N=164) ran +22.5% own-basis and +14.4% market-adjusted.
There are two ways to read this. A property that opens just before peak season has already secured a high price level at launch, so its subsequent growth reads relatively small. A property that opens in a quiet period settles its operation in during the calm and keeps more headroom for uplift into year two. Both are rational ways to launch, and the choice of opening month can be framed as a design decision between taking the fast start and taking the run-up. Off-season openings in particular function as a preparation period for the peak, in that they let a property build its operational base and its guest-review base while occupancy is still gentle. Indeed, that early guest-review scores are largely formed within about two months of opening is confirmed in our review formation curve for the 1,728 properties that opened in 2025, and how that run-up period is used feeds through to rates in the following season.
| Opening-month group | Properties | Launch → same month, year 2 (own basis) | Market-adjusted |
|---|---|---|---|
| Months adjacent to peak season (Mar, Apr, Jul, Dec) | 243 | +15.7% | +11.7% |
| Quieter months (Jan, Feb, May, Sep, Oct, Nov) | 164 | +22.5% | +14.4% |
| Overall | 480 | +17.2% | +13.2% |
Source: MetroEngines Research & Consulting (median estimated settled ADR, same property and same calendar month compared)
Working Backwards from the Opening Month — Where to Place Groundbreaking and Filing
Everything so far describes opening months as they turned out. What an operator planning an opening actually needs is the calculation in reverse: to open in this month, when should ground have been broken? From the plan data in MLIT’s Building Construction Dynamics Statistics Survey, we extracted measured construction periods by scale. How far construction periods diverge between standalone buildings and mixed-use developments is taken down to individual project conditions in our measurement of start-to-completion across 67 planned projects.
| Scale | Projects | Median construction period | Faster 25% | Slower 25% |
|---|---|---|---|---|
| Under 30 rooms | 27 | 15.0 months | 10.0 months | 18.0 months |
| 30–99 rooms | 239 | 16.0 months | 13.0 months | 21.5 months |
| 100–199 rooms | 512 | 17.8 months | 14.9 months | 22.8 months |
| 200+ rooms | 454 | 21.4 months | 17.0 months | 26.9 months |
| Overall | 1,232 | 18.5 months | — | — |
Source: compiled by MetroEngines Research & Consulting from the MLIT Building Construction Dynamics Statistics Survey (projects with scheduled completion between 2018 and June 2026 and a stated room count, N=1,232 projects)
The interval from filing to groundbreaking can also be measured. Across 655 projects of 30 rooms or more the median is +3.2 months, and the variation by scale is small (30–99 rooms +3.1 months, 100–199 rooms +3.2 months, 200+ rooms +3.4 months). Lead time to groundbreaking is largely independent of scale; only the construction period lengthens as scale grows.
One more figure matters for the practical work just before opening. Looking at how OTA listings ramp up for the 753 properties that opened with 30 rooms or more, 59.6% could be confirmed as listed in the same month they opened, and 76.8% within three months of the opening month. Only 4.8% had listings live one to six months before opening. Starting to sell at essentially the same time as opening is the current standard practice — which is exactly where the room to bring listings forward still sits.
Stacked together, these produce the following countdown from a target opening month.
| Target opening month | Completion target | Groundbreaking target (30–99 rooms) | Groundbreaking target (100–199 rooms) | Groundbreaking target (200+ rooms) |
|---|---|---|---|---|
| April (start of fiscal year) | December–January of the prior year | around August, two years prior | around June, two years prior | around March, two years prior |
| July (before the summer holidays) | March–April | around November, two years prior | around September, two years prior | around June, two years prior |
| Late December (before the New Year holidays) | August–September | around May of the prior year | around March of the prior year | around November, two years prior |
| October (before the autumn travel season) | June–July | around February of the prior year | around December, two years prior | around September, two years prior |
Built using the median construction periods by scale in the table above and three to four months of preparation from completion to opening. Source: compiled by MetroEngines Research & Consulting from the MLIT Building Construction Dynamics Statistics Survey
Earlier still, building-confirmation filing sits a median of 3.2 months before groundbreaking. For a 200+ room property targeting a late-December opening, filing lands roughly two years and four months before the opening. Put the other way round: for projects at the filing stage today, the opening month is already all but fixed.
How Much Schedule Variance to Allow — The Filing-to-Opening Range
The countdown table above is drawn using median construction periods. In real projects the construction period itself has a distribution, so the landing point moves even at the same scale. Adding the measured filing-to-groundbreaking interval (30–99 rooms +3.1 months, 100–199 rooms +3.2 months, 200+ rooms +3.4 months) and four months of post-completion preparation to the construction-period quartiles shown above (faster 25%, median, slower 25%) puts total lead time from filing to opening in the following ranges.
| Scale | Optimistic (faster 25%) | Median case | Pessimistic (slower 25%) | Pessimistic − optimistic spread |
|---|---|---|---|---|
| 30–99 rooms | 20.1 | 23.1 | 28.6 | 8.5 |
| 100–199 rooms | 22.1 | 25.0 | 30.0 | 7.9 |
| 200+ rooms | 24.4 | 28.8 | 34.3 | 9.9 |
Source: compiled by MetroEngines Research & Consulting from the MLIT Building Construction Dynamics Statistics Survey (construction period N=1,232 projects, filing → groundbreaking N=655 projects). Total lead time = filing → groundbreaking + construction period + four months of post-completion preparation.
The spread widens with scale: 8.5 months at 30–99 rooms and 9.9 months at 200+ rooms. The 28.8-month median case for 200+ rooms is the four-month-preparation version of the same calculation behind the “filing roughly two years and four months before opening” noted above (27.8 months if preparation is set at three months). If the target opening month is to be fixed to a specific month, the decision about where in the schedule to absorb the gap to the pessimistic case has to be made up front.
Crossing scale with target opening month fixes when groundbreaking should be placed. Each cell is the target opening month less the lead time formed by the median construction period plus four months of preparation (under 30 rooms 19 months, 30–99 rooms 20 months, 100–199 rooms 22 months, 200+ rooms 25 months, overall 23 months).
| Scale (median construction period) | March | April (start of fiscal year) | July (before the summer holidays) | October (before the autumn travel season) | Late December (before the New Year holidays) |
|---|---|---|---|---|---|
| Under 30 rooms (15.0 months) | around August, two years prior | around September, two years prior | around December, two years prior | around March of the prior year | around May of the prior year |
| 30–99 rooms (16.0 months) | around July, two years prior | around August, two years prior | around November, two years prior | around February of the prior year | around April of the prior year |
| 100–199 rooms (17.8 months) | around May, two years prior | around June, two years prior | around September, two years prior | around December, two years prior | around February of the prior year |
| 200+ rooms (21.4 months) | around February, two years prior | around March, two years prior | around June, two years prior | around September, two years prior | around November, two years prior |
| Overall (18.5 months) | around May, two years prior | around June, two years prior | around September, two years prior | around December, two years prior | around February of the prior year |
Source: compiled by MetroEngines Research & Consulting from the MLIT Building Construction Dynamics Statistics Survey (median construction period, N=1,232 projects). “Prior year” and “two years prior” are relative to the target opening year. December assumes a late-month opening, so this grid runs one month apart from the earlier countdown table, which set preparation at three months.
Read vertically, a 200+ room property has to break ground five months earlier than a 30–99 room one to open in the same month. Read horizontally, at the same scale, moving the target opening month by three months moves groundbreaking by three months too. The construction period is fixed by scale and hard to move; the opening month is a variable that can be chosen by reading the demand calendar. Which of the two you anchor the countdown to changes the range of options you can secure.
Do Not Read 2026 Monthly Counts Straight as Seasonality
All of the seasonality analysis in this article rests on the three settled years from 2023 to 2025. There is a reason 2026 data is not treated the same way.
As of the survey date (August 2026), 1,252 properties are captured as 2026 openings, but the monthly breakdown starts at 240 in January and 203 in April before thinning rapidly through the back half of the year: 36 in August, 13 in September, 13 in October, 4 in November and 12 in December. This does not mean fewer openings later in the year. As the previous section showed, OTA listings go live at essentially the same time as opening, so properties that have not yet opened are structurally absent from the count. The monthly figures for the second half of 2026 will grow as time passes. For the actual picture of the first-half 2026 cohort that has already opened, see our analysis comparing the rates and inventory sell-through of 1,002 newly opened properties against existing properties by type.
For the same reason, opening-date records include cases where a rebrand or major renovation reopening is treated as a new opening. Of the 753 properties with 30 rooms or more, 7.6% had listed prices observed seven months or more before the recorded opening month. The effect on reading month-level distribution trends is limited, but it is worth confirming when working with the vintage of an individual property.
Conclusion — The Opening Month Sits Where the Demand Calendar Meets the Build Schedule
What three years and 5,732 properties of measured data show is a structure in which the opening month is not an accident but is placed at the intersection of two constraints: the demand calendar and the construction period. Peaks form just ahead of demand periods — the fiscal year in April, the summer holidays in July, the New Year holidays in December — and even the choice of day within the month follows that intent. Groundbreaking leans to the first half of the year and, after a construction period of 15.0 to 21.4 months depending on scale, lands on those peaks.
On top of that, the optimal landing point moves with property type and scale. Outdoor formats peak in spring, ryokan just before summer, hostels at year-end, and properties of 100 rooms or more spread additional peaks into March and October. On the rate ramp-up, openings just before peak season secure their result through the fast start, and off-season openings through headroom into year two — two different shapes of the same outcome. The +13.2% market-adjusted uplift from year one to year two is a trajectory common to every month of opening.
For projects at the planning stage now, this distribution is the coordinate system for deciding first which month to open in, and then working filing and groundbreaking backwards from it. The opening month is a subject that comes too late if it is left until after completion.
Frequently Asked Questions
Which month sees the most hotel openings in Japan?
Among the 5,732 properties whose openings could be confirmed on OTA listings over the three years from 2023 to 2025, April is the busiest with 738 properties (12.9%), followed by July with 685 (12.0%) and December with 658 (11.5%). Against the low of 273 properties in February (4.8%), the gap is 2.70x.
Is April also the largest month by room count?
No. On a room-count basis July leads with 16,250 rooms (13.1%), followed by December at 15,799 rooms (12.7%) and April at 14,286 rooms (11.5%). March and October are large at 28.3 and 27.4 rooms per property respectively, and move up relative to their property-count rankings.
Does the opening month differ by property type?
It does. Glamping peaks in April at 20.1%, cottages in April at 14.3%, ryokan in July at 17.1%, hostels in December at 15.4% and rental villas in December at 12.3%. Business hotels hold all three peaks evenly at July 13.0%, April 11.8% and December 10.5%, making them the type with the smallest month-to-month spread.
Does the opening month change how first-year rates ramp up?
Across 480 properties with 30 rooms or more, the median growth in estimated settled ADR from the launch month to the same month in year two was +17.2%, or +13.2% after adjusting for the market level in the same prefecture. Months adjacent to peak season (March, April, July, December, N=243) ran +11.7% market-adjusted and quieter months (January, February, May, September, October, November, N=164) +14.4% — a split between fast starters and slow builders.
When should groundbreaking be placed relative to a target opening month?
Median construction periods are 16.0 months for 30–99 rooms, 17.8 months for 100–199 rooms and 21.4 months for 200+ rooms. Setting preparation from completion to opening at four months puts groundbreaking 20 to 25 months before opening. For an April opening, the guide is around August two years prior at 30–99 rooms, and around March two years prior at 200+ rooms.
When is building-confirmation filing needed?
Across 655 projects with 30 rooms or more, the median from filing to groundbreaking is 3.2 months (30–99 rooms +3.1 months, 100–199 rooms +3.2 months, 200+ rooms +3.4 months), with little variation by scale. For a 200+ room property targeting a late-December opening, filing lands roughly two years and four months before opening.
Can 2026 monthly counts be read as seasonality?
They cannot. Because OTA listings go live at essentially the same time as opening, properties that have not yet opened are structurally absent from the count. As of August 2026, 1,252 properties are captured, and the thinning through the back half of the year — 36 in August, 13 in September, 12 in December — reflects capture lagging rather than fewer openings.
Related Reading
- New Hotel Reviews Rise +0.38pt in 2 Months: 1,728 Japan 2025 Openings
- Hotel Supply Pressure Ranking 2026-2027: Ozu Kumamoto Tops at 30.8%
- 226k Hotel Rooms in 32 Regional Cities: 42.7% Built Before 1996
- Japan Hotel Closures 2026: 3 Hotels, 316 Rooms Closed, 1,149 Delayed
- Leasehold Hotel Development: 1.38x Land Price Reach Across 9 Markets
- Hotel Build Times: 2.80-Year Median, 1.96 Solo vs 4.00 Mixed-Use
- 1,002 New Japan Openings H1 2026: ADR 1.14x, Ryokan Lag +18.8pt
References and Sources
■ Data sources
Opening months and room counts cover the 5,732 properties and 124,248 rooms opened between 2023 and 2025 that MetroEngines Research & Consulting confirmed on major OTA listings. Estimated settled ADR covers the 480 properties with 30 rooms or more whose listing could be confirmed within three months of the opening month and which were still listed in the same calendar month twelve months later. Construction periods and filings come from plan data in the MLIT Building Construction Dynamics Statistics Survey (construction period N=1,232 projects, filing → groundbreaking N=655 projects, groundbreaking-month distribution N=950 projects).
■ Calculation assumptions
The countdown table and the two-axis grid were built using median construction periods by scale and three to four months of preparation from completion to opening. Total lead time in the three-scenario table is “filing → groundbreaking + construction period + four months of preparation,” with the faster 25%, the median and the slower 25% of construction periods substituted into the optimistic, median and pessimistic cases respectively. The market adjustment on launch rates subtracts the growth in the market level for the same prefecture and the same two-month pair as each property (median +3.8%). Share indices are set against the twelve-month average at 100.
■ Limitations and caveats
This is not a complete census but an aggregation over the range for which listings on major OTAs could be confirmed. Because 47.3% of records carry the opening date at month-level granularity only, all aggregation is performed by month. Records include cases where a rebrand or major renovation reopening is logged as a new opening: of the 753 properties with 30 rooms or more, 7.6% had listed prices observed seven months or more before the recorded opening month. Because listings ramp up at essentially the same time as opening, 2026 figures are structurally under-counted in the second half of the year and are not used as evidence of seasonality. Construction periods are plan-based values and may differ from actual completion records. Estimated settled ADR is an estimate and differs from each property’s actual transacted prices and accounting figures.
■ Market data
- MetroEngines Research & Consulting — opening months and room counts of newly opened properties (based on confirmed OTA listings, 2023–2025 / N=5,732 properties, 124,248 rooms) and estimated settled ADR (30+ rooms, N=480 properties)
■ Government statistics and public data
- MLIT, “Report on Statistical Survey on Building Construction Started — time series index” (建築着工統計調査報告 時系列一覧) — published materials of the Building Construction Dynamics Statistics Survey
- e-Stat, “Statistical Survey on Building Construction Starts” (建築着工統計調査) (government statistics code 00600120)
- Japan Tourism Agency, “Overnight Travel Statistics Survey” (宿泊旅行統計調査) — reference for the monthly seasonality of accommodation demand