

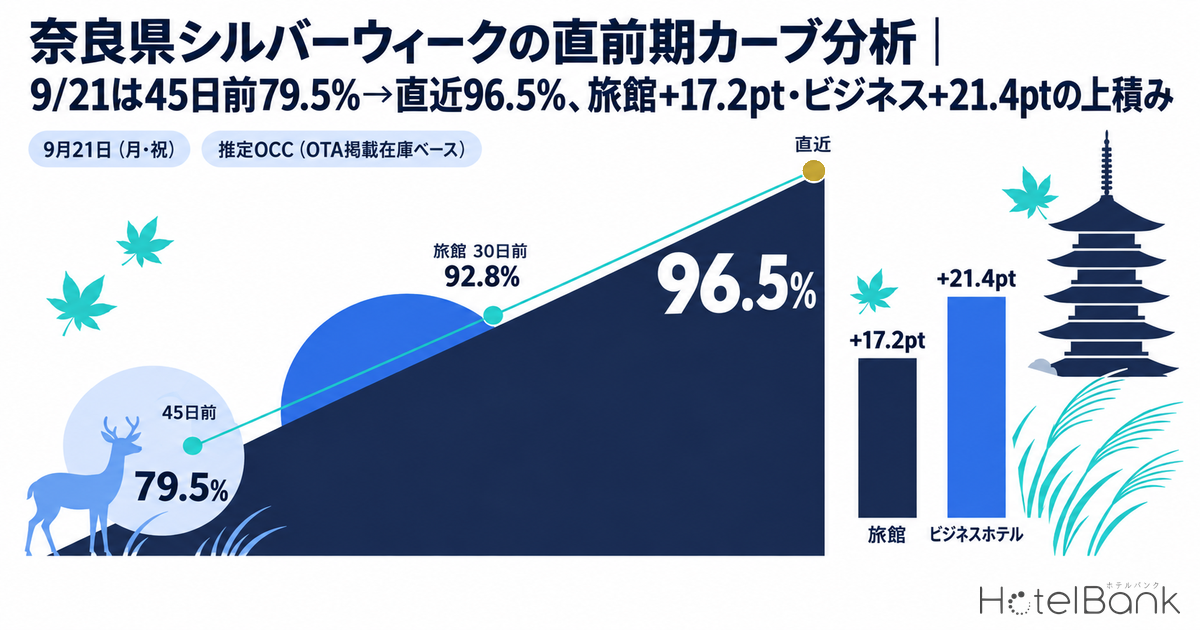
Saturday September 19 through Wednesday September 23, 2026 forms a five-day run — the first in eleven years — bracketed by Respect for the Aged Day and the Autumnal Equinox. Nara’s lodging inventory data shows that for Monday September 21 (national holiday), the middle day of the run, estimated OCC (based on OTA-listed inventory) across all property types stood at 79.5% when measured 45 days before the stay date, and had climbed to 96.5% by the latest observation (September 10, T-11). That is a gain of +17.0pt. By property type, ryokan moved from 80.6% to 97.8% (+17.2pt, N=55 properties) and business hotels from 74.3% to 95.7% (+21.4pt, N=22 properties); both added roughly +12pt between T-45 and T-30, after which the gap widened — ryokan added +5.0pt and business hotels +9.7pt from T-30 onward. By contrast, Saturday October 3, used here as a control date, went from 57.0% at T-45 to 65.7% at the latest observation (T-23) — the same day of the week, but a different market altogether. This article breaks down the shape of Nara’s late-booking curve by property type and translates it into practical steps: how to release remaining rooms, how to set minimum-stay conditions, and how to be ready for cancellations coming back.
Scope: Nara, all properties N=139 / 5,087 rooms (based on listings across major booking sites, fixed cohort), of which ryokan N=55 / 1,179 rooms and business hotels N=22 / 2,613 rooms. Price figures in this article are estimated settled ADR (the transaction price level estimated from OTA and other sales data, tax-excluded equivalent); occupancy is an estimate based on OTA-listed inventory. Full definitions appear at the end of the article. Data as of September 11, 2026.
• ADR (average daily rate) = an estimated settled rate (tax-excluded equivalent) calculated by applying a property-type correction coefficient to the lowest published plan level each property shows on OTAs (two guests per room, per-room rate, tax included). Cross-checked against property-level results disclosed by listed hotel REITs (91 properties, most recent three months), the median error is approximately 7%. These are estimates and differ from each property’s actual transaction prices and accounting figures.
• ADR at the area level (prefecture or municipality) is the median of the estimated settled rates of the properties covered — the level of a typical property in that area.
• Where published prices are mentioned, they are per-room rates for two guests in one room (tax included).
• OCC (occupancy) = sold rooms as a share of total rooms in the area (an estimate based on inventory offered for sale on OTAs).
• Source: MetroEngines Research (continuous tracking of published OTA rates for approximately 168,000 properties in Japan, of which approximately 27,000 have confirmed occupancy)
- — For Monday September 21 (holiday), Nara’s all-property figure went from 79.5% at T-45 to 96.5% at the latest observation (September 10), a gain of +17.0pt. The middle day of the run had already reached 70–80% at T-45.
- — Ryokan were essentially settled by T-30 at 92.8% (only +5.0pt thereafter); business hotels added +9.7pt after T-30, a late-booking shape. The two property types settle on different timelines.
- — Lined up against the six neighbouring prefectures in and around Kansai, Nara’s business hotels on September 21 fell from 3rd at T-45 (74.3%) to 6th at the latest observation (95.7%). Kyoto, Hyogo and Wakayama added 15–21pt after T-30 and passed Nara.
- — On September 19, the first day of the run, business hotels sat at 90.7% with a sold-out property rate of 45.5% at the latest observation. Their +8.5pt gain from T-45 was the smallest among the seven prefectures — the loosest cross-section inside the holiday run.
- — On price, finalized August estimated settled ADR came in above the prior year: ryokan ¥16,000 (+3.8%) and business hotels ¥9,500 (+5.9%). In the late-booking window the question is no longer how to fill rooms, but in what order and on what terms to release the ones left.
September 21 (Mon, holiday) — 70–80% at T-45, then another 20 points on top
Start with the booking curve for September 21, the middle day of the run. All three cuts are already high at T-45, but the shape from there differs. Ryokan went from 80.6% at T-45 to 92.8% at T-30, adding 12.2pt, and then a further +5.0pt to 97.8% at the latest observation (T-11). Business hotels entered from the lowest position of the three at 74.3%, reached 86.0% at T-30 (+11.7pt) and 95.7% at the latest observation (+9.7pt) — roughly twice the ryokan pace once inside 30 days.
The sold-out property rate (the estimated share of properties whose listed inventory can no longer be found on OTAs and similar channels) shows the same structure. Ryokan moved 30.9% at T-45 to 63.6% at T-30 to 90.9% at the latest observation: nearly two-thirds had dropped their inventory by T-30. Business hotels went 36.4% to 40.9% to 63.6%, absorbing the bulk of it only once inside the late-booking window. In other words, even for two days that both look set to finish near full, ryokan have already decided the outcome by T-30, while for business hotels the stretch from T-30 to the last minute is the main event.
Source: MetroEngines Research; compiled by the HotelBank Editorial Team
Nara’s city hotels are excluded from this analysis: only four properties in the prefecture meet the listed-inventory criteria for the fixed cohort, too few to report (categories with fewer than ten properties are not published). The upper-tier segment in the prefecture is touched on later, on a monthly basis, in the estimated settled ADR section.
Three fixed observation points — the first day and the middle day are different animals, and the first Saturday of October is different again
Using three fixed points — T-45, T-30 and the latest observation — the table below lines up Saturday September 19 (first day of the run), Monday September 21 (middle day) and the control date, Saturday October 3. The procedure for judging the character of a stay date from these three points is set out in our article on reading booking curves at three checkpoints: at T-45, T-30 and the last minute.
| Stay date / property type | N | T-45 | T-30 | Latest obs. | Gain | Sold-out rate (latest) |
|---|---|---|---|---|---|---|
| 9/19 (Sat) all properties | 139 | 81.6% | 86.0% | 92.4% | +10.8pt | 64.7% |
| 9/19 (Sat) ryokan | 55 | 76.9% | 84.1% | 94.0% | +17.1pt | 67.3% |
| 9/19 (Sat) business | 22 | 82.2% | 84.7% | 90.7% | +8.5pt | 45.5% |
| 9/21 (Mon, holiday) all properties | 139 | 79.5% | 89.3% | 96.5% | +17.0pt | 84.9% |
| 9/21 (Mon, holiday) ryokan | 55 | 80.6% | 92.8% | 97.8% | +17.2pt | 90.9% |
| 9/21 (Mon, holiday) business | 22 | 74.3% | 86.0% | 95.7% | +21.4pt | 63.6% |
| 10/3 (Sat) all properties | 139 | 57.0% | 61.8% | 65.7% | +8.7pt | 28.8% |
| 10/3 (Sat) ryokan | 55 | 70.3% | 77.5% | 76.4% | +6.1pt | 30.9% |
| 10/3 (Sat) business | 22 | 47.1% | 49.4% | 55.6% | +8.5pt | 0.0% |
The latest observation for 9/19 and 9/21 is September 10, 2026 (T-9 and T-11 respectively); for 10/3 it is the same date (T-23). Source: MetroEngines Research; compiled by the HotelBank Editorial Team
Three things stand out. First, the ordering at T-45 is reversed between the first day (Sat 9/19) and the middle day (Mon 9/21). On 9/19 it was business 82.2% > all properties 81.6% > ryokan 76.9%; on 9/21 it was ryokan 80.6% > all properties 79.5% > business 74.3%. The first day fills the urban product first as a travel day, while the middle day thickens on the stay-put product — and that sequence is already visible in the T-45 cross-section.
Second, business hotels on 9/19 remain at a 45.5% sold-out property rate and 90.7% estimated OCC even at the latest observation, making them the loosest of the nine date-by-type combinations despite high demand. The gain is a gentle +8.5pt. That contrasts with ryokan on the same date at 94.0% and 67.3% sold out: the first day of the run enters the late-booking window with a temperature gap still open between property types.
Third, the control date of Saturday October 3 is an entirely different market. Business hotels sat at 47.1% at T-45 and only 55.6% at the latest observation, with a sold-out property rate of 0.0% at all three points. For the same day of the week, whether or not a demand event sits on top moves the T-45 level by around 35 points. Our verification of booking curves in Nara around the Tokae 2026 festival, comparing the T-45 cross-section during and after the event, covers the same effect: Nara Tokae 2026: 78.3% Estimated OCC 45 Days Out, 14.3pt Above After.
Source: MetroEngines Research; compiled by the HotelBank Editorial Team
Lined up against the six neighbouring prefectures — on September 21, Nara’s business hotels fell from 3rd at T-45 to 6th
Read on its own, Nara’s business hotel figure for September 21 looks like a large +21.4pt gain. Lined up against Kansai and the adjacent prefectures (Mie, Shiga, Kyoto, Osaka, Hyogo and Wakayama) on the same observation dates and the same aggregation definition, the assessment changes. All comparisons use estimated OCC (based on OTA-listed inventory) for a fixed cohort (the same set of properties for each stay date). T-45 is August 7, 2026 for the 9/21 stay date and August 5 for 9/19; the latest observation for both is September 10.
| Property type | Prefecture | N | 9/21 T-45 | 9/21 T-30 | 9/21 latest | 9/21 gain | 9/19 gain | 9/19 sold-out rate (latest) |
|---|---|---|---|---|---|---|---|---|
| Ryokan | Mie | 122 | 86.7% | 96.0% | 99.4% | +12.7pt | +18.8pt | 73.8% |
| Ryokan | Shiga | 36 | 89.0% | 95.0% | 100.0% | +11.0pt | +16.1pt | 81.1% |
| Ryokan | Kyoto | 117 | 67.9% | 81.3% | 96.7% | +28.8pt | +23.6pt | 54.2% |
| Ryokan | Osaka | 23 | 64.6% | 75.3% | 89.8% | +25.2pt | +18.8pt | 56.5% |
| Ryokan | Hyogo | 173 | 80.7% | 90.9% | 98.9% | +18.2pt | +24.1pt | 73.4% |
| Ryokan | Nara | 55 | 80.6% | 92.8% | 97.8% | +17.2pt | +17.1pt | 67.3% |
| Ryokan | Wakayama | 71 | 80.8% | 89.9% | 98.8% | +18.0pt | +26.0pt | 56.3% |
| Business | Mie | 64 | 74.7% | 87.2% | 99.9% | +25.2pt | +27.3pt | 62.5% |
| Business | Shiga | 46 | 88.0% | 94.2% | 99.6% | +11.6pt | +8.9pt | 89.1% |
| Business | Kyoto | 196 | 69.0% | 78.4% | 96.0% | +27.0pt | +20.0pt | 29.1% |
| Business | Osaka | 296 | 52.4% | 62.5% | 82.6% | +30.2pt | +20.9pt | 19.6% |
| Business | Hyogo | 76 | 64.2% | 75.4% | 96.6% | +32.4pt | +24.0pt | 53.3% |
| Business | Nara | 22 | 74.3% | 86.0% | 95.7% | +21.4pt | +8.5pt | 45.5% |
| Business | Wakayama | 34 | 71.2% | 82.6% | 97.8% | +26.6pt | +20.5pt | 67.6% |
N is the fixed-cohort property count for the 9/21 stay date (for 9/19 it is 118 for Kyoto ryokan, 37 for Shiga ryokan and 75 for Hyogo business hotels; the rest are unchanged). Osaka ryokan, at N=23, is a small base and should be treated as indicative. Source: MetroEngines Research; compiled by the HotelBank Editorial Team
Two things stand out. First, Nara’s business hotels on 9/21 ranked 3rd of the seven prefectures at T-45 (74.3%) but slipped to 6th at the latest observation (95.7%). Wakayama (71.2% to 97.8%), Hyogo (64.2% to 96.6%) and Kyoto (69.0% to 96.0%) all sat below Nara at T-45, then added +15.2pt, +21.2pt and +17.6pt respectively after T-30 and overtook it (Nara added +9.7pt). Nara’s +21.4pt is large measured inside the prefecture, but it is the sixth-largest gain of the seven.
Second, for the first day of the run on 9/19, Nara’s business hotels added only +8.5pt from T-45, the smallest of the seven prefectures. The next smallest, Shiga at +8.9pt, was already near the ceiling at T-45 with 90.8%; Nara moved only from 82.2% to 90.7%, and its latest sold-out property rate of 45.5% trails Mie (62.5%), Wakayama (67.6%) and Hyogo (53.3%). The 9/19 business hotel cross-section called the loosest within the run above also stands out as loose relative to its neighbours. Ryokan on 9/21, by contrast, put Nara at 97.8% against 98.8–100.0% in Shiga, Mie, Hyogo and Wakayama: the gap between property types is wider than the gap between prefectures.
How individual prefectures build their late-booking window is covered in Osaka Sep 2026 Holiday: Demand Peaks First 2 Nights, Sep 23 at 58.0% and Wakayama Silver Week Peaks Midway: Ryokan 93.7% Sun, 82.9% Sat. For a revenue manager in Nara, the implication is to judge late-booking gains not only against the prefecture’s own market but against the gains posted by neighbouring prefectures (see implication 5 below).
Monthly estimated settled ADR — finalized August was +3.8% YoY for ryokan and +5.9% for business hotels
On the price side, look at monthly estimated settled ADR. For the most recent finalized month, August 2026, Nara ryokan came in at ¥16,000 (N=87 properties, against ¥15,400 / N=92 a year earlier, +3.8%) and business hotels at ¥9,500 (N=31 properties, against ¥8,900 / N=32 a year earlier, +5.9%). Both landed above the prior year.
From September onward the figures are current estimates based on sales to date and may move: ryokan ¥17,200 (N=88 properties) and business hotels ¥10,500 (N=31 properties). For October the current estimates are ¥17,600 for ryokan (N=83) and ¥12,900 for business hotels (N=31). Because finalized values and current estimates are calculated on different bases, we do not read a change by placing finalized August next to estimated September (September and October can only be assessed once the month closes). Overlaying the years, both property types share the same shape in 2025 and 2026, with levels rising from autumn into November. Price and inventory movements from late October into early November are covered in detail in Shosoin Exhibition 2026: Nara Weekday Rates +32% During 17-Day Run.
Solid lines = finalized values; dotted lines = current estimates based on sales to date. Source: MetroEngines Research; compiled by the HotelBank Editorial Team
Set against the occupancy picture, Nara is a market where holiday dates are already running high at T-45 and then add roughly 17–21pt by the latest observation to land close to full, while prices on a finalized-month basis sit above the prior year. The question in the late-booking window is no longer filling inventory but in what order, and on what terms, to release the rooms that remain.
For revenue managers running ryokan and business hotels in Nara — implications and an action plan
(1) Read your own curve against the settling timeline of your property type. On 9/21, ryokan went from 80.6% at T-45 to 92.8% at T-30 and were largely settled there, while business hotels went from 74.3% at T-45 to 95.7% at the latest observation (+21.4pt), converting late. When you overlay your own pace on the market curve, the same “85% at T-30” reads as behind the market for a ryokan (92.8%) and as running alongside it for a business hotel (86.0%). Not judging every property type and every date against a single benchmark line is the starting point.
(2) Pick up the “high-demand but loose” dates first. Business hotels on Saturday 9/19 were still at a 45.5% sold-out property rate and 90.7% estimated OCC at the latest observation — the thickest remaining inventory inside the run. Ryokan on Monday 9/21, by contrast, were 90.9% sold out. Even within one holiday run, date and property type put you in completely different positions. There is room to check the depth of remaining inventory date by date and type by type before deciding what to do, rather than treating the run as a single block.
(3) Consider applying minimum-stay conditions to the middle day only. Across the market the sold-out property rate reaches 84.9% on 9/21 while the first day, 9/19, sits at 64.7%. Because the multi-night demand is concentrated on the middle day, applying a length-of-stay condition uniformly across the whole run risks turning away single-night demand on the first day. Conditions are worth separating date by date.
(4) Manage control dates (non-holiday Saturdays) on a separate calendar. Business hotels on Saturday 10/3 were at 47.1% at T-45 with a 0.0% sold-out rate. Because the T-45 level differs so sharply from the holiday dates despite being the same day of the week, harmonising price and inventory settings simply because “it is a Saturday” tends to cost you on one side or the other.
(5) Judge post-T-30 gains alongside neighbouring prefectures. For business hotels on 9/21, Kyoto (+17.6pt), Hyogo (+21.2pt) and Wakayama (+15.2pt) all added faster than Nara (+9.7pt) after T-30 and finished above it at the latest observation (Table 2). Measured only against the prefecture’s own market, a date can look like it is filling adequately while, viewed across a wider area, headroom remains.
| Time horizon | Action | Trigger (tied to figures in this article) | Purpose |
|---|---|---|---|
| Today to this week (late-booking window) | Take stock of remaining inventory by date and property type across the run, and decide the release order | Whether you still hold inventory against a market sold-out property rate of 84.9% on 9/21, while 9/19 stands at only 64.7% market-wide | Separate the middle day and the first day into different decisions |
| Today to this week | Prepare to catch cancellations coming back (a re-selling path and same-day handling) | On dates where market estimated OCC has tightened to 96.5% at the latest observation, returned inventory can move within a short window | Avoid holding returned rooms empty |
| Today to this week | Review single-night and minimum-stay conditions for the first day of the run (9/19) | Business hotels on 9/19 remain at 90.7% estimated OCC and 45.5% sold out — the loosest cross-section inside the run | Check whether your own conditions are choking demand |
| Within two weeks | Rebuild non-holiday Saturdays in October on a separate price and inventory calendar from the holiday run | Business hotels on 10/3: 47.1% at T-45, 55.6% at the latest observation, 0.0% sold out | Do not carry high-demand settings over to an ordinary Saturday |
| Within two weeks | Compare your October levels against the market’s estimated settled ADR | Current October estimates are ¥17,600 for ryokan (N=83) and ¥12,900 for business hotels (N=31). If you remain well below that, it is worth examining | Spot a gap in your price band early |
| Looking to next month | Make a habit of recording your own curve at the three fixed points — T-45, T-30 and the last minute — ahead of the next high-demand date | Keep this run’s market gains (ryokan +17.2pt, business hotels +21.4pt) in a form you can compare against your own results | Build a yardstick you can use at the same time next year |
Source: MetroEngines Research; compiled by the HotelBank Editorial Team
Summary — three yardsticks for the late-booking window
Yardstick 1: the position at T-45. On 9/21, ryokan were at 80.6%, all properties at 79.5% and business hotels at 74.3%. Holiday dates have already reached 70–80% at T-45, and that position sets the class of the date. Conversely, when T-45 sits in the 50s as it does on 10/3, the date belongs to a different demand calendar entirely.
Yardstick 2: the size of the gain from T-45. On 9/21 all properties added +17.0pt (of which the stretch after T-30 accounts for +7.2pt, 89.3% to 96.5%), business hotels +21.4pt and ryokan +17.2pt. If your own gain falls well short of that, it is material for reviewing how you release inventory and set conditions in the late-booking window.
Yardstick 3: the water level of the sold-out property rate. On 9/21 the market reached 84.9%, and ryokan 90.9%. The stance to take in the late-booking window differs between a date where everyone around you has dropped their inventory and one like 9/19 where only 45.5% have. On price, finalized August was up year on year — +3.8% for ryokan and +5.9% for business hotels — which means late-booking decisions can rest on how to release rooms rather than on filling them.
About the data
• Definition of estimated OCC (based on OTA-listed inventory): OTA-listed-inventory occupancy = 100 − 100 × rooms still listed on OTAs ÷ total rooms. Coverage is a fixed cohort (the same set of properties for each stay date) made up of properties that list at least 30% of their total rooms on OTAs. It is an estimate based on how inventory offered for sale on OTAs is absorbed, and is defined differently from actual room occupancy (it runs high because rooms not listed are counted as already sold).
• Booking curve: based on observations from 45 days before the stay date through to the latest observation.
• Definition of estimated settled ADR: a transaction price level (tax-excluded equivalent) estimated from OTA and other sales data (lowest plan level × property-type coefficient, ensembled across multiple channels). Past months are finalized values; the current and future months are estimates based on sales to date. Cross-checked against published operating results, the median error is 6.6%.
• Breakdown of N: for booking curves, Nara all properties N=139 / 5,087 rooms, ryokan N=55 / 1,179 rooms, business hotels N=22 / 2,613 rooms. For estimated settled ADR, ryokan N=70–93 properties and business hotels N=29–33 properties (varying by month; the N for each month is given in the text). Nara’s city hotels are excluded from the occupancy aggregation because the fixed cohort holds only four properties, below the ten-property threshold.
• The sold-out property rate is “the estimated share of properties whose listed inventory can no longer be found on OTAs and similar channels” and does not mean the properties are actually full.
• Data as of September 11, 2026. Sales conditions and inventory change daily, so the figures in this article are a snapshot as at the time of retrieval.
References and sources
■ Data sources
Estimated OCC, sold-out property rates and booking curves are compiled by prefecture and property type from listed-inventory data for major booking sites collected by MetroEngines Research. For Nara the stay dates are September 19, September 21 and October 3, 2026; for the six comparison prefectures in and around Kansai (Mie, Shiga, Kyoto, Osaka, Hyogo and Wakayama) they are September 19 and 21. All were tracked from 45 days before the stay date through the observation of September 10, 2026. Estimated settled ADR is a monthly level estimated from the same published-rate data, using January 2025 to December 2026 for ryokan and business hotels in Nara. Data retrieved as of September 11, 2026.
■ Calculation assumptions
The gain is calculated as “estimated OCC at the latest observation − estimated OCC at T-45”, and the post-T-30 gain as the point difference between the latest observation and T-30. The aggregation set for each stay date is a fixed cohort (properties listing at least 30% of total rooms on OTAs, held constant through the observation period), and cross-prefecture comparisons are aligned on identical observation dates and definitions (Table 2). Year-on-year changes in estimated settled ADR are calculated only between finalized months (August 2025 versus August 2026); current estimates from September onward, which use a different basis, are excluded from the year-on-year comparison. The action plan in Table 3 sets out considerations that can be read from market aggregates and does not guarantee results.
■ Limitations and caveats
Because estimated OCC is based on the absorption of OTA-listed inventory, rooms not listed are counted as already sold and the figure runs higher than actual room occupancy. The latest observation is a snapshot at T-9 to T-11 for the stay dates concerned (T-23 for 10/3) and is not the final landing point. Nara business hotels (N=22) and Osaka ryokan (N=23) rest on small bases, where inventory changes at a handful of properties can move the value by several points. Estimated settled ADR is an estimate with a median error of 6.6% against published operating results, so where a year-on-year change is only a few points, the sign can flip within the margin of estimation error. Nara city hotels are excluded because the fixed cohort falls short of ten properties.
■ Reference material
• Cabinet Office of Japan, “About National Holidays” https://www8.cao.go.jp/chosei/shukujitsu/gaiyou.html (September 21, 2026 = Respect for the Aged Day; September 23 = Autumnal Equinox Day; September 22, falling between them, = a citizens’ holiday)
Related reading
- Nara Tokae 2026: 78.3% Estimated OCC 45 Days Out, 14.3pt Above After
- Shosoin Exhibition 2026: Nara Weekday Rates +32% During 17-Day Run
- Osaka Sep 2026 Holiday: Demand Peaks First 2 Nights, Sep 23 at 58.0%
- Wakayama Silver Week Peaks Midway: Ryokan 93.7% Sun, 82.9% Sat
- Chuseok Sep 24-27: Only Fukuoka, Saga, Kyoto Hold After Silver Week