

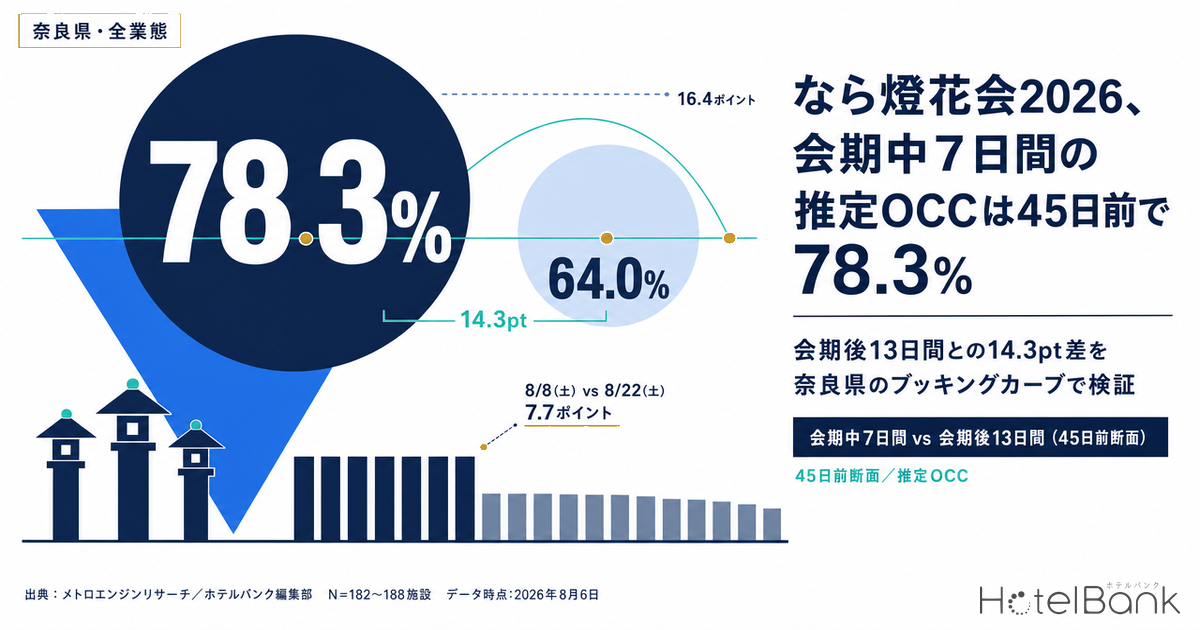
How large a step in lodging demand is the Nara Tokae 2026 lantern festival (August 5–14, 19:00–21:30, across the Nara Park area) actually creating in Nara Prefecture? Lining up the booking curves for every stay date across all property types in Nara, from 45 days out through the most recent observation, the seven days of August 8–14 in the back half of the festival period average an estimated OCC of 78.3% at the 45-days-out cut, against 64.0% for the thirteen days of August 17–29 after the festival ends — a gap of 14.3 points. At the 30-days-out cut the comparison is 82.9% versus 66.5%, and the gap actually widens to 16.4 points. Even comparing like with like on Saturdays, August 8 (Sat) during the festival sits at 75.1% at 45 days out while August 22 (Sat) after it reaches only 67.4%, a 7.7-point spread. And Wednesday, August 12, inside the festival period, hits 84.9% at the 21-days-out cut — 10.1 points above the 74.8% recorded for Saturday, August 22, after it. For these two weeks in summer Nara, the ordering of the days of the week is itself turned upside down.
Scope: Nara Prefecture, all property types, N=182–188 properties (varies by stay date; 7,053–7,109 rooms in total). Price figures in this article refer to estimated settled ADR (the transaction price level inferred from OTA and other sales data, on a tax-exclusive basis), and occupancy is an estimate based on OTA-listed inventory. Both definitions appear at the end of the article. Data as of August 6, 2026.
- — A 14.3pt gap at 45 days out — the seven festival days (Aug 8–14) average an estimated OCC of 78.3% at the 45-days-out cut, against 64.0% for the thirteen days after (Aug 17–29). At 30 days out the gap widens to 16.4pt.
- — The gap opens early, not late — the spread between Aug 8 (Sat) and Aug 22 (Sat) narrows from 7.7pt at 45 days out to 5.8pt at 30 days and 4.7pt at 21 days. Whatever room there is to design the festival dates sits earlier than T-45.
- — 7.7–9.5pt is the conservative read on the festival effect — the 14.9pt gap on Aug 12 (Wed) also carries pre-Obon demand, and Aug 11 (Tue) is Mountain Day. The cleaner pairs — Aug 8 vs Aug 22 (7.7pt) and Aug 5 (Wed) vs Jul 29 (Wed) (9.5pt) — bracket the range.
- — The day-of-week ranking inverts during the festival week — in the July 2026 actuals Saturday leads at 88.0%, but at the 30-days-out cut for the festival week, Monday 93.3%, Sunday 88.3% and Tuesday 87.3% all sit above Saturday’s 78.4%.
- — The trough after the festival is part of the design too — the estimated share of properties with no listed inventory runs 50.6% for the festival week against 22.9% after it at 21 days out, a 27.7pt spread. Plan the festival and its aftermath together.
The seven festival days and the thirteen after them start 14.3pt apart at 45 days out
The chart below lays the stay dates out horizontally and places the estimated OCC (based on OTA-listed inventory) at the 45-days-out cut alongside the 30-days-out cut for each. The Nara Tokae 2026 period runs from Wednesday, August 5 to Friday, August 14. The seven days from Saturday, August 8 to Friday, August 14 — the back half of the period — had already accumulated an average of 78.3% by 45 days out (124–141 properties observed per day). The thirteen days from Monday, August 17 to Saturday, August 29, after the festival closes, stop at an average of 64.0% on the same cut (128–148 properties). The difference is 14.3 points. Take the 30-days-out cut instead and it becomes 82.9% versus 66.5%, widening the gap to 16.4 points. In other words, the festival-side curve keeps building between 45 and 30 days out, while the post-festival stretch grows only sluggishly over the same window.
Day by day, August 9 (Sun), August 10 (Mon) and August 11 (Tue) — the stretch containing Mountain Day — are the highest at 45 days out, at 85.0%, 88.8% and 82.7%. That block is inside the festival period and simultaneously part of the long weekend running from Saturday, August 8 through Tuesday, August 11 (Mountain Day), so the demand drivers cannot be separated. More on that below, but the most straightforward day for isolating the festival effect alone is Wednesday, August 5, early in the period, which overlaps neither the long weekend nor Obon. August 5 (Wed) tracked 69.7% at 45 days out, 67.9% at 30 days and 69.4% at 21 days (128–130 properties observed). The comparable Wednesday before the festival, July 29, ran 60.2% at 45 days, 64.0% at 30 days and 66.8% at 21 days (134–136 properties). That is a 9.5-point difference at the 45-days-out starting point and 2.6 points at 21 days. The festival effect shows up as a lift in the early starting position, and the tendency is for the gap to close as the stay date approaches. For an example of the same procedure applied to isolating a festival effect from the 45-days-out cut, Yamagata Hanagasa 2026: Demand Settled 45 Days Out, +9.6pt vs Normal shows how to construct a day-of-week-matched comparison.
Source: MetroEngines Research; compiled by the HotelBank Editorial Team
One note: the 45-days-out cut for Sunday, August 16 rests on only 4 properties observed, an extremely thin cross-section, so the 45-days-out value is not plotted for that date in the chart above (the 30-days-out figure is 61.7% on 138 properties). Variation in the number of properties observed across cuts is something worth checking every time in this kind of comparison.
Matching the day of the week — Aug 8 (Sat) vs Aug 22 (Sat), Aug 12 (Wed) vs Aug 19 (Wed)
Because period averages absorb the long weekend and Obon, the next chart and table overlay curves for matched days of the week. The anchor is the Saturday comparison: August 8 (Sat) during the festival against August 22 (Sat) and August 29 (Sat) after it.
August 8 (Sat) climbs from 75.1% at 45 days out to 78.4% at 30 days (+3.3pt) and 79.5% at 21 days (+4.4pt versus 45 days), reaching 86.9% at the most recent observation with three days to go (+11.8pt versus 45 days; 177 properties observed). August 22 (Sat) runs 67.4% at 45 days, 72.6% at 30 days (+5.2pt), 74.8% at 21 days (+7.4pt) and 77.3% at the latest observation with 17 days to go (178 properties). August 29 (Sat) is lower still: 64.2% at 45 days, 68.3% at 30 days and 71.8% at the latest observation with 24 days remaining. That leaves a 7.7-point gap at 45 days out (Aug 8 vs Aug 22), and 10.9 points against Aug 29 — a gap that narrows steadily to 5.8 points at 30 days and 4.7 points at 21 days. Between matched Saturdays, in other words, the presence or absence of the festival mainly determines how far the curve has already built early on.
Source: MetroEngines Research; compiled by the HotelBank Editorial Team
The Wednesday comparison shows an even larger gap, but it needs care in interpretation. August 12 (Wed), inside the festival, runs 73.4% at 45 days, 79.3% at 30 days, 84.9% at 21 days and 88.4% at the latest observation with seven days to go (174 properties). After the festival, August 19 (Wed) runs 58.5% at 45 days, 62.0% at 30 days, 64.0% at 21 days and 68.0% at the latest observation with 14 days to go, while August 26 (Wed) runs 61.1% at 45 days, 62.1% at 30 days and 67.3% at the latest observation with 21 days remaining. That is a 14.9-point gap at 45 days out (against Aug 19) and as much as 20.9 points at 21 days. But August 12 (Wed) falls on the day before the Obon holiday break begins, so the festival effect and pre-Obon travel demand are layered on top of each other. The gap on that date cannot be read straight through as “the Tokae effect.” The same applies to Tuesday, August 11, inside the festival period, which is Mountain Day itself (August 11, a Tuesday, in 2026). The Kochi case, where the festival’s main day coincides with Mountain Day (Yosakoi 2026: Kochi Aug 11 86.9% Sold Out at 45 Days, 45.0pt Gap), runs into the same problem of not being able to fully separate the holiday effect from the festival effect.
| Stay date | Category | 45 days out | 30 days out | 21 days out | Latest observation | Properties observed |
|---|---|---|---|---|---|---|
| Aug 8 (Sat) | Festival | 75.1% | 78.4% | 79.5% | 86.9% (3 days out) | 134–177 |
| Aug 22 (Sat) | After festival | 67.4% | 72.6% | 74.8% | 77.3% (17 days out) | 142–182 |
| Aug 29 (Sat) | After festival | 64.2% | 68.3% | — | 71.8% (24 days out) | 145–181 |
| Aug 12 (Wed) | Festival *pre-Obon | 73.4% | 79.3% | 84.9% | 88.4% (7 days out) | 124–174 |
| Aug 19 (Wed) | After festival | 58.5% | 62.0% | 64.0% | 68.0% (14 days out) | 128–181 |
| Aug 26 (Wed) | After festival | 61.1% | 62.1% | 67.3% | 67.3% (21 days out) | 130–179 |
| Aug 11 (Tue) | Festival *Mountain Day | 82.7% | 87.3% | 90.0% | 92.3% (6 days out) | 128–174 |
| Aug 25 (Tue) | After festival | 61.6% | 63.2% | 66.7% | 68.0% (20 days out) | 138–181 |
Nara Prefecture, all property types; estimated OCC (based on OTA-listed inventory) / Source: MetroEngines Research; compiled by the HotelBank Editorial Team
The week when the day-of-week ranking flips
What matters most operationally in this window is not the height of the average but the fact that the ordering of the days of the week reverses relative to normal. Averaging the July 2026 actuals for Nara Prefecture across all property types by day of week (a completed month, 31 days, 149–182 properties observed, observation coverage 50.9–99.5%) gives a monthly mean of 80.5%, with Saturday standing out at 88.0%, followed by Thursday 81.7%, Friday 80.5%, Tuesday 80.1%, Wednesday 78.8%, Sunday 78.7% and Monday 75.6%. Saturday leads second-placed Thursday by 6.3 points — an entirely standard shape.
Line up the week from August 8 (Sat) to August 14 (Fri) at the 30-days-out cut, however, and the top slot goes to Monday at 93.3% (Aug 10), then Sunday at 88.3% (Aug 9) and Tuesday at 87.3% (Aug 11), with Saturday’s 78.4% (Aug 8) dropping to fifth within the week. In the weeks after the festival, August 17–23 and August 24–30, Saturday returns to the upper ranks at 72.6% and 68.3%. In a week where the festival, the long weekend and Obon all overlap, a standard design weighted toward the weekend simply does not fit as-is.
Source: MetroEngines Research; compiled by the HotelBank Editorial Team
Inventory depletion confirms the same picture. Looking at the estimated share of properties with no listed inventory on OTAs at the 21-days-out cut, the seven days of the festival week (Aug 8–14) average 50.6%, running 27.7 points above the 22.9% average for the ten days of August 17–26 after it. Individually, August 10 (Mon) is at 63.4%, August 11 (Tue) 56.8%, August 12 (Wed) 50.8% and August 8 (Sat) 43.4%, against 26.8% for August 22 (Sat) and 23.9% for August 19 (Wed). Even on weekdays, the festival week reached the three-weeks-out mark with more properties showing no available listed inventory than the Saturdays after the festival. That said, this is a share estimated from the presence or absence of listed inventory, and its definition differs from actual sold-out status.
For revenue managers running properties in Nara — implications and an action plan
(1) The market’s starting position is largely set 45 days out. The gap between the seven festival days and the thirteen days after them was 14.3 points at 45 days out and 16.4 points at 30 days. If most of that difference is already in place by 45 days out, then the room to shape your own property’s festival dates most likely sits earlier than T-45 as well. Overlaying your own booking pace for the same dates against this market level: if you are starting from a position clearly below the market at 45 days out, it is hard to assume a late push will make up the difference.
(2) The 7.7-point gap between matched Saturdays is the conservative benchmark for the festival premium. The 14.9-point gap for August 12 (Wed) against the post-festival Wednesdays carries pre-Obon travel demand, and the level on August 11 (Tue) has Mountain Day mixed into it. The cleaner Saturday pair (7.7 points at 45 days out for Aug 8 vs Aug 22, 10.9 points against Aug 29) and the 9.5 points at 45 days out for August 5 (Wed) vs July 29 (Wed) — neither of which overlaps the long weekend or Obon — give a range that is easier to attribute to the festival itself. When you set your own festival-date pricing, start from this conservative range rather than the larger figures.
(3) A “weekend-heavy” design does not fit the festival week. Where the July actuals show the standard shape — Saturday at 88.0% leading second-placed Thursday at 81.7% by 6.3 points — the 30-days-out cut for the festival week puts Monday at 93.3%, Tuesday at 87.3% and Sunday at 88.3% above Saturday’s 78.4%. Carrying minimum-stay rules and day-of-week rate calendars into the festival week unchanged from a normal month leaves room to miss weekday demand.
(4) The trough after the festival matters as much as the festival. The thirteen post-festival days average 64.0% at 45 days out, and even the latest observations grow slowly — 67.3% for August 26 (Wed) and 61.4% for August 31 (Mon). Concentrating on festival-date design while leaving the weekdays after it alone can make for a substantial shortfall on a monthly view. Plan the festival and its aftermath as a set. On how far normal days after a festival recover in the final two weeks, Aomori Nebuta 2026: 97.4% Sold 45 Days Out, Post-Festival +14pt tracks the shape of that post-festival build.
| Time frame | Move | Decision trigger | Objective |
|---|---|---|---|
| This week (remaining festival days, Aug 12–14) | Review stop-sell conditions and minimum-stay rules on remaining rooms on a day-by-day basis | If your own pace for Aug 12–14 sits well below the market’s latest observation for the same dates (88.4%, 87.2%, 83.9%) | Avoid missing demand that still moves in the final few days |
| This week | Check the step down from the closing day, Aug 14 (Fri), to the days that follow, and revisit how you accept consecutive-night stays | Given that the market steps down at the 45-days-out cut from 70.1% on Aug 14 (Fri) to 66.5% on Aug 15 (Sat), with Aug 16 (Sun) at 61.7% on the 30-days-out cut | Leave room for stay extensions anchored on the festival’s closing day |
| Within two weeks (post-festival, Aug 17–31) | Release inventory and loosen sales conditions for post-festival weekdays first | Because the market remains sluggish at an average of 64.0% at 45 days out and 68.0% for Aug 19 (Wed) at the latest observation | Limit what is left on the table through the trough |
| Within two weeks | Treat the post-festival Saturdays (Aug 22 and Aug 29) separately from weekdays | Because Aug 22 (Sat) at 77.3% and Aug 29 (Sat) at 71.8% still sit above the weekdays in the same weeks (Aug 19 Wed 68.0%, Aug 26 Wed 67.3%) | Avoid flattening out the relatively stronger days within the trough |
| Looking to next year (T-45) | Carve the festival dates out as a separate calendar from normal months, and set the review point for festival-weekday minimum stays and rate levels at 45 days out | Given that the gap between the festival and the days after it was already 14.3 points at 45 days out (16.4 points at 30 days) | Fix your position before the gap has fully formed |
| Looking to next year (T-30) | Rebuild the day-of-week settings for the festival week away from “weekend-heavy,” raising weekday conditions first | If the pattern repeats in which Monday 93.3%, Tuesday 87.3% and Sunday 88.3% sit above Saturday’s 78.4% at the 30-days-out cut | Capture weekday demand in a week where the ranking inverts |
Source: MetroEngines Research; compiled by the HotelBank Editorial Team
Conclusion — three yardsticks for reading a festival period
Relaying the Nara Tokae 2026 festival period and its aftermath against the booking curves for Nara Prefecture across all property types, the results come down to three points.
First, the gap is formed by 45 days out. The 45-days-out averages for the seven festival days and the thirteen days after are 78.3% versus 64.0%, a 14.3-point gap; at 30 days they are 82.9% versus 66.5%, a 16.4-point gap. Designing for an event period is work that begins earlier than 45 days out.
Second, to measure the festival effect, use matched-weekday pairs that avoid holidays. Saturday against Saturday, Aug 8 versus Aug 22, gives a 7.7-point gap at 45 days out; Aug 5 (Wed) versus Jul 29 (Wed) gives 9.5 points. By contrast, the 14.9-point gap for Aug 12 (Wed) has pre-Obon travel demand mixed in, and the level for Aug 11 (Tue) has Mountain Day, so neither can be treated as the festival effect as-is. The safer order of operations is to bracket the range with the cleaner pairs first, then treat the overlapping days as an increment on top.
Third, the day-of-week ranking inverts during the festival week. In the July actuals Saturday led at 88.0%, but at the 30-days-out cut for the festival week, Monday 93.3%, Tuesday 87.3% and Sunday 88.3% all came in above Saturday’s 78.4%. The estimated share of properties with no listed inventory likewise splits 50.6% for the festival week against 22.9% after it at 21 days out, a 27.7-point spread. A week where the festival, the long weekend and Obon overlap is not a period in which to carry a normal month’s day-of-week design across unchanged.
About the data
| Definition of estimated OCC | Occupancy based on OTA-listed inventory = 100 − 100 × rooms still listed on OTAs ÷ total rooms. This is an estimate based on how far the inventory offered for sale on OTAs has been taken up, and its definition differs from actual room occupancy (it reads high). This article labels it “estimated OCC (based on OTA-listed inventory).” |
| Booking curves | Based on observations from 45 days before the stay date through the most recent observation. Scope covers stay dates from July 29 to August 31, 2026. |
| Definition of estimated settled ADR | The transaction price level (tax-exclusive basis) inferred from OTA and other sales data (lowest-plan level × property-type coefficient, an ensemble across multiple channels). Past months are confirmed values; the current and future months are estimates based on the sales position at this point in time. Reconciliation against published operating results gives a median error of 6.6%. Note that this article deals only with booking pace (estimated OCC and inventory depletion) and carries no price-level figures. |
| Breakdown of N | Nara Prefecture, all property types. The number of properties covered by stay date is 182–188 (7,053–7,109 rooms in total). The number of properties observed at each cut is 124–184 as noted in the text and tables, with only the 37-days-out cut for Aug 8 (Sat) at 12 properties and only the 41-days-out cut for Aug 12 (Wed) at 8 properties running thin, though both are continuous with the cuts on either side. The 45-days-out cut for Aug 16 (Sun) rests on just 4 properties, an extremely thin cross-section, and is excluded from the chart. The July 2026 actuals cover 31 days, 149–182 properties observed, observation coverage 50.9–99.5%. |
| Share of properties with no confirmable inventory | The estimated share of properties for which no listed inventory can be confirmed on OTAs and similar channels. Its definition differs from actual sold-out status. |
| Data date | Data as of August 6, 2026. Sales positions and inventory move daily, so the figures in this article are a snapshot as of the time of retrieval. |
References and sources
| Nara Tokae official website | https://www.toukae.jp/ (period: August 5–14, 2026, 19:00–21:30, across the Nara Park area) |
| Nara City Tourist Association official site | https://narashikanko.or.jp/event/detail_10194.html |
| Ee Koto Nara (Nanto Economic Research Institute) | https://www.nantokanko.jp/gyoji/731.html |
| National Holidays (Cabinet Office, Government of Japan) | https://www8.cao.go.jp/chosei/shukujitsu/gaiyou.html (Mountain Day = August 11) |
Related Reading
- Yamagata Hanagasa 2026: Demand Settled 45 Days Out, +9.6pt vs Normal
- Owara Kaze no Bon 2026: 85.0% OCC on 3 Weekdays, 45 Days Out
- 94.5% Sold 45 Days Out: Omagari Fireworks vs a Normal Akita Weekend
- Yosakoi 2026: Kochi Aug 11 86.9% Sold Out at 45 Days, 45.0pt Gap
- Aomori Nebuta 2026: 97.4% Sold 45 Days Out, Post-Festival +14pt
- Kyoto Obon 2026 Booking Curves: Ryokan Add the Most Close In, +11.4pt
- Shimane Obon 2026: Only Aug 15-16 Dip; Aug 22 Business Hotels 90.9%