

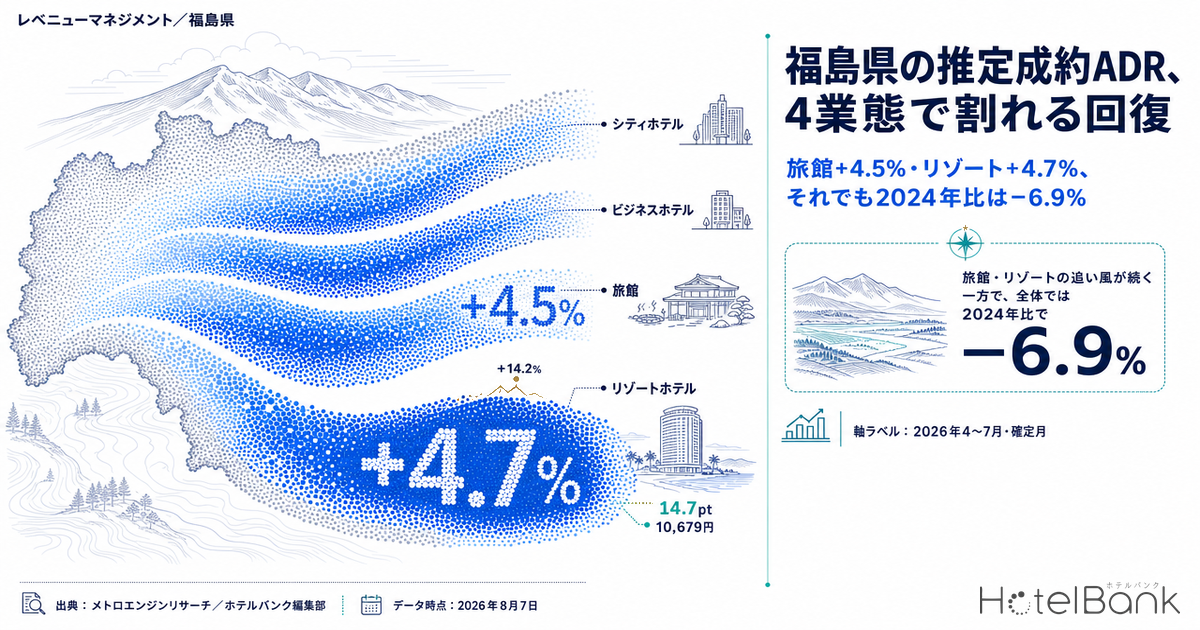
Breaking Fukushima’s estimated settled ADR down into four hotel categories and taking the year-on-year change for finalized months only, all four landed in positive territory over April–July 2026: City Hotels +1.9%, Business Hotels +1.1%, Ryokan +4.5% and Resort Hotels +4.7%. The month-to-month volatility, however, differs completely by category. Ryokan were positive in all four months, with a maximum-minus-minimum spread of just 4.3 points, while Resort Hotels ranged from +14.2% in June to −0.5% in July — a 14.7-point spread. Compare the same period against 2024 and both Ryokan and Resort Hotels come in at −6.9%, meaning much of the year-on-year gain reflects a rebound from the 2025 trough. This article decomposes where each of the four categories stands in its recovery, using finalized figures only.
Scope: City Hotels, Business Hotels, Ryokan and Resort Hotels in Fukushima, N=17/156/232/34 properties (July 2026 finalized values, in category order). The price metric in this article is estimated settled ADR (the transaction price level estimated from OTA and other sales data, tax-exclusive equivalent); occupancy is an estimate based on OTA-listed inventory. Full definitions appear at the end of the article. Data as of August 7, 2026.
- — All four categories beat the prior year — averaged across the finalized months of April–July 2026: City +1.9%, Business +1.1%, Ryokan +4.5%, Resort +4.7%.
- — Versus 2024, both Ryokan and Resort Hotels sit at −6.9%. The year-on-year gain is mainly a rebound from the 2025 trough, not a return to the level of two years ago.
- — The Resort +14.2% in June is a denominator effect — June 2025 at ¥9,026 was the lowest June in three years. Against June 2024’s ¥11,262, the 2026 figure is still 8.5% short.
- — Year-on-year volatility differs more than tenfold by category — the max-minus-min spread is 1.3pt for Business, 4.3pt for Ryokan, 8.3pt for City and 14.7pt for Resort.
- — The shape of demand explains the volatility — in estimated OCC for July 2026, the Saturday-versus-Wednesday gap is 13.8pt for Ryokan and 12.2pt for Resort, against 4.0pt for Business and 5.4pt for City.
Breaking the finalized-month YoY into four categories — a range from −2.8% to +14.2%
First, a note on method: year-on-year changes are taken between finalized values only. Months through July 2026 are finalized, while August onward are estimates based on current sales conditions, so those months are excluded from the year-on-year calculation. The table below lines up estimated settled ADR by category for April through July 2026 alongside the finalized values for the same months a year earlier.
| Category | Apr 2026 | May | Jun | Jul | Apr–Jul avg. |
|---|---|---|---|---|---|
| City Hotels (N=17) | ¥7,425 +2.6% |
¥7,726 +5.5% |
¥7,366 +2.6% |
¥7,256 −2.8% |
¥7,443 +1.9% |
| Business Hotels (N=156–160) | ¥6,222 +0.8% |
¥6,298 +0.4% |
¥6,160 +1.5% |
¥6,216 +1.7% |
¥6,224 +1.1% |
| Ryokan (N=232–239) | ¥10,505 +5.2% |
¥11,143 +6.3% |
¥9,769 +4.5% |
¥9,774 +2.0% |
¥10,298 +4.5% |
| Resort Hotels (N=31–34) | ¥10,443 +1.5% |
¥11,550 +4.7% |
¥10,310 +14.2% |
¥10,414 −0.5% |
¥10,679 +4.7% |
Source: Compiled by the HotelBank Editorial Team from MetroEngines Research
The upper figure in each cell is the 2026 estimated settled ADR (finalized), and the lower figure is the change against the finalized value for the same month a year earlier. N is the number of properties covered in each month and shifts slightly from month to month. Across the four months combined, the price bands form a four-tier structure: Ryokan (¥10,298) and Resort Hotels (¥10,679) in the ¥10,000s, City Hotels (¥7,443) in the ¥7,000s, and Business Hotels (¥6,224) in the ¥6,000s. Fukushima’s rates also split into tiers geographically, with Aizu, Urabandai, Iwaki and Koriyama forming a four-layer structure across the prefecture.
Looking at the range of change rates month by month brings out the difference in character between categories. Business Hotels moved only from +0.4% to +1.7%, a max-minus-min spread of just 1.3 points across four months. Ryokan ran from +2.0% to +6.3%, a 4.3-point spread. City Hotels went from −2.8% to +5.5%, or 8.3 points. Resort Hotels swung from −0.5% to +14.2% — a 14.7-point spread, more than ten times that of Business Hotels. The same category divide shows up in other prefectures as well: Aichi Settled ADR 18 Months: City Swings 25.0pt, Business 14.0pt tracks a case where City year-on-year swung across a 25.0-point range while Business stayed within 14.0 points, using 18 months of finalized values.
Source: Compiled by the HotelBank Editorial Team from MetroEngines Research
Only two categories — Business Hotels and Ryokan — never dipped negative across the four months. City Hotels and Resort Hotels each turned negative in July, at −2.8% and −0.5% respectively. More than the magnitude of the year-on-year figure itself, whether the sign flips in any given month is what best describes the situation a category’s pricing is in.
What was behind the Resort Hotels’ +14.2% in June — lining up three years
June 2026 for Resort Hotels was the only double-digit year-on-year figure among the four categories, so it is worth checking the prior-year value that served as the basis of comparison. Lining up the same month across three years gives the following.
| Category (June, finalized) | Jun 2024 | Jun 2025 | Jun 2026 | 2026 vs. 2024 |
|---|---|---|---|---|
| City Hotels | ¥7,224 (N=18) | ¥7,182 (N=18) | ¥7,366 (N=17) | +2.0% |
| Business Hotels | ¥6,013 (N=154) | ¥6,068 (N=155) | ¥6,160 (N=158) | +2.4% |
| Ryokan | ¥10,478 (N=242) | ¥9,349 (N=243) | ¥9,769 (N=236) | −6.8% |
| Resort Hotels | ¥11,262 (N=32) | ¥9,026 (N=32) | ¥10,310 (N=34) | −8.5% |
Source: Compiled by the HotelBank Editorial Team from MetroEngines Research
June 2025 for Resort Hotels came in at ¥9,026, the lowest June of the three years. The ¥10,310 recorded in June 2026 is +14.2% year on year, but it is 8.5% below June 2024’s ¥11,262. In other words, that double-digit gain represents a recovery from a level that had dropped a notch the previous year, not a move above the level of two years ago. Resort Hotels also have the smallest coverage of the four categories at 31–34 properties, which makes any single property’s influence on the monthly median relatively large.
Source: Compiled by the HotelBank Editorial Team from MetroEngines Research
Plotted year over year, Resort Hotels sank to their lowest band of the three years from spring into early summer 2025 (March ¥10,048, April ¥10,289, June ¥9,026), and 2026 has been filling that stretch back in from below. At the peaks, however — August 2024 at ¥13,594 and August 2025 at ¥13,864 — no month in 2026 has yet reached the height of the 2025 level.
Source: Compiled by the HotelBank Editorial Team from MetroEngines Research
The year-over-year plot for Ryokan takes a somewhat different shape. In 2026 they built up sharply in the first half of the year — January at ¥13,233 (+31.4% year on year) and March at ¥10,573 (+16.7%) — then from April onward held positive at +5.2%, +6.3%, +4.5% and +2.0% while the growth rate narrowed. That narrowing into the summer is because the comparison base, July 2025 (¥9,586), sat at a higher level than the first half of 2025 (February ¥9,190, March ¥9,058); the shape of the prior year itself differs month to month, and that matters.
Matching the four categories against the same period in 2024 (the April–July average) makes the difference in how far each has come even clearer. City Hotels rose from ¥7,297 to ¥7,443, or +2.0%, and Business Hotels from ¥6,174 to ¥6,224, or +0.8% — both above their 2024 levels. Ryokan, by contrast, went from ¥11,056 to ¥10,298, or −6.9%, and Resort Hotels from ¥11,466 to ¥10,679, also −6.9%, leaving both categories close to 10% below where they stood two years ago. On a year-on-year basis Ryokan and Resort Hotels look like the growth leaders, but add the two-year view and the picture reverses: these are the two categories still in the middle of their recovery.
The shape of demand differs — what day-of-week estimated OCC reveals about category gaps
To see why price volatility differs more than tenfold by category, it helps to look at how demand comes in. The scope here is Fukushima in July 2026 (a month in progress), with daily estimated OCC (based on OTA-listed inventory) averaged by day of the week. The number of properties observed within the month was 154–200 for Ryokan, 22–30 for Resort Hotels, 120–127 for Business Hotels and 15–16 for City Hotels.
| Category | Mon | Tue | Wed | Thu | Fri | Sat | Sun | Monthly avg. |
|---|---|---|---|---|---|---|---|---|
| Ryokan | 78.4% | 78.9% | 78.5% | 78.0% | 82.0% | 92.3% | 84.7% | 81.6% |
| Resort Hotels | 77.2% | 79.3% | 77.1% | 79.2% | 81.1% | 89.3% | 83.5% | 80.8% |
| Business Hotels | 84.1% | 89.0% | 90.9% | 91.3% | 88.2% | 94.9% | 82.7% | 88.9% |
| City Hotels | 83.7% | 90.3% | 91.1% | 92.8% | 91.2% | 96.5% | 84.4% | 90.2% |
Source: Compiled by the HotelBank Editorial Team from MetroEngines Research
Taking the gap between Saturday and Wednesday, the four categories split cleanly into two groups: 13.8 points for Ryokan and 12.2 points for Resort Hotels, against 5.4 points for City Hotels and 4.0 points for Business Hotels. Ryokan and Resort Hotels sit flat in the 77–79% range on weekdays, with only Saturday jumping. Business Hotels and City Hotels run thick from Tuesday through Friday in the 88–93% range and are weakest on Sunday (82.7% and 84.4%). This weekday-heavy profile for Business Hotels is not unique to Fukushima; the same Sunday trough and Thursday peak pattern appears in Aichi and Hiroshima as well.
This difference in shape feeds directly into how monthly estimated settled ADR moves. For Ryokan and Resort Hotels, the center of gravity of demand shifts with how many Saturdays, pre-holiday nights and long weekends fall in a given month, so a change in the calendar alone can move the year-on-year figure by several points. Indeed, July 18 (Sat) and 19 (Sun), 2026 fell within the Marine Day three-day weekend, and Ryokan hit 98.4% and 97.1% while Resort Hotels reached 98.3% and 95.4% — more than 15 points above their monthly averages (81.6% and 80.8%). On the final day of that weekend, Monday the 20th, the figures fell back to 78.8% for Ryokan and 76.9% for Resort Hotels. Business Hotels and City Hotels, with their thicker weekday floor, are far less prone to having monthly values pulled around by calendar factors.
For revenue managers running Ryokan and Resort Hotels in Fukushima — implications and an action plan
(1) Do not judge your own property’s progress by the sign of the year-on-year figure alone. Fukushima’s Ryokan averaged +4.5% year on year over April–July 2026 and Resort Hotels +4.7%, but against the same period in 2024 both stood at −6.9%. Whether your annual plan targets “getting back to 2024 levels” or “building on 2025” completely changes how the same +4-something percent should be read. Since the market itself offers two years’ worth of yardsticks, it is worth stating explicitly which year your internal targets are benchmarked against.
(2) Take a single month’s double-digit growth only after checking the shape of the prior year. Resort Hotels’ +14.2% in June 2026 is the flip side of the fact that June a year earlier was the lowest month in three years at ¥9,026, and the figure still falls 8.5% short of June 2024’s ¥11,262. The same applies at property level: any month where the prior year was unusual — an event cancellation, a renovation — will produce a year-on-year figure larger than the underlying strength warrants. Before adopting a market year-on-year figure as your own target, build in a step to confirm that the comparison month itself was normal.
(3) Monthly volatility corresponds to the demand shape of the category. The max-minus-min year-on-year spread was 4.3 points for Ryokan and 14.7 points for Resort Hotels, against 1.3 points for Business Hotels. Day-of-week estimated OCC shows the same divide: Ryokan and Resort Hotels have a large Saturday-versus-Wednesday gap at 13.8 and 12.2 points, while Business and City stay at 4.0 and 5.4 points. The more a category concentrates demand into Saturdays and long weekends, the more its monthly average rate is governed by the calendar. When reviewing year-on-year figures, noting how many Saturdays and pre-holiday nights fell in that month makes it harder to mistake month-to-month noise for a change in underlying performance.
(4) Look for room to lift the weekday floor in the shape of occupancy, not in price. In July 2026, Ryokan ran at 78.0–78.9% from Monday through Thursday — almost no variation by day. Weekday demand not being skewed toward any particular day makes it harder to narrow down which days to target, but it can equally be read as room to consider product design that works across all weekdays: consecutive-night stays, weekday-only stay value, and weekday allocation across booking channels.
The following organizes the practical steps that follow from the above, by time horizon.
| Time horizon | Action | Decision trigger (figures from this article) | Objective |
|---|---|---|---|
| Today–this week | For the finalized months of April–July, line up your own achieved rates on the same four-month average basis as the market category averages | Are you below ¥10,298 (Ryokan) / ¥10,679 (Resort Hotels)? (both tax-exclusive equivalent, April–July 2026 average) | Establish where you sit within the market band over a period, not a single month |
| Today–this week | Match the same four months against your own 2024 results | Is your gap larger or smaller than the market’s −6.9% versus 2024? | Separate how much of the “positive year-on-year” is rebound and how much is genuine gain |
| Within two weeks | Aggregate your own recent-month occupancy by day of week and measure the Saturday-versus-Wednesday gap | The market shows 13.8 points for Ryokan and 12.2 points for Resort Hotels — if your gap is larger than that | Identify the stretches where weekend dependence exceeds the market average |
| Within two weeks | Redesign the price steps across the first, middle and final day of holiday weekends | 98.4% on July 18 and 97.1% on the 19th, against 78.8% on the 20th, the final day (Ryokan) | Stop treating long weekends as a single flat rate and price in the drop on the final day |
| Toward next month | Add a column to your rate-revision calendar for whether the same month a year earlier was normal | The misreading pattern shown by placing Resort Hotels’ June +14.2% alongside −8.5% versus 2024 | Avoid over- or under-ambitious targets driven by the size of a year-on-year figure |
| Toward next month | Begin work on products that work across all weekdays (consecutive nights, weekday-only stay value) | Whether Ryokan’s Monday–Thursday range of 78.0–78.9%, with almost no variation by day, is persisting | Prepare non-price levers for lifting weekdays that cannot be narrowed to specific days |
Source: Compiled by the HotelBank Editorial Team from MetroEngines Research
How far can revenue density move by category, combining price and occupancy?
Up to this point, rate (estimated settled ADR) and occupancy (estimated OCC) have been examined separately. Multiplying the two lets us restate, using only the measured values in this article, the range within which each category’s “revenue density per room” moves. What follows is the definitional multiplication estimated RevPAR equivalent = estimated settled ADR × estimated OCC, not a new forecast. Because estimated OCC is based on OTA-listed inventory and runs higher than actual room occupancy, the amounts below should be read as a yardstick for relative comparison between categories and between scenarios, not as absolute levels.
| Category | Low scenario cheapest month × lowest weekday |
Mid scenario four-month avg. × monthly avg. |
High scenario highest month × Saturday |
Spread vs. mid scenario |
|---|---|---|---|---|
| Ryokan | ¥7,620 ¥9,769 × 78.0% | ¥8,403 ¥10,298 × 81.6% | ¥10,285 ¥11,143 × 92.3% | 31.7% |
| Resort Hotels | ¥7,949 ¥10,310 × 77.1% | ¥8,629 ¥10,679 × 80.8% | ¥10,314 ¥11,550 × 89.3% | 27.4% |
| Business Hotels | ¥5,094 ¥6,160 × 82.7% | ¥5,533 ¥6,224 × 88.9% | ¥5,977 ¥6,298 × 94.9% | 16.0% |
| City Hotels | ¥6,073 ¥7,256 × 83.7% | ¥6,714 ¥7,443 × 90.2% | ¥7,456 ¥7,726 × 96.5% | 20.6% |
Source: Compiled by the HotelBank Editorial Team from MetroEngines Research
Dividing the spread by the mid scenario gives 31.7% for Ryokan and 27.4% for Resort Hotels, against 20.6% for City Hotels and 16.0% for Business Hotels. Because the year-on-year rate volatility (4.3 points for Ryokan and 14.7 points for Resort Hotels versus 1.3 points for Business Hotels) and the day-of-week occupancy spread (13.8 points for Ryokan and 12.2 points for Resort Hotels versus 4.0 points for Business Hotels) stack in the same direction, the arithmetic puts Ryokan and Resort Hotels at around 30% movement in revenue density between scenarios. Business Hotels, conversely, keep the gap between their worst and best scenarios within 16.0% of the mid case.
For Ryokan, laying out the sensitivity to moving rate and occupancy separately gives the following. Both rows and columns stay inside the range observed in this article (estimated settled ADR of ¥9,769–11,143 for April–July 2026, and estimated OCC of 78.0–92.3% across days of the week in July 2026).
| Est. settled ADR \ Est. OCC | 78% | 81% | 84% | 87% | 90% |
|---|---|---|---|---|---|
| ¥9,800 | 7,644 | 7,938 | 8,232 | 8,526 | 8,820 |
| ¥10,100 | 7,878 | 8,181 | 8,484 | 8,787 | 9,090 |
| ¥10,400 | 8,112 | 8,424 | 8,736 | 9,048 | 9,360 |
| ¥10,700 | 8,346 | 8,667 | 8,988 | 9,309 | 9,630 |
| ¥11,000 | 8,580 | 8,910 | 9,240 | 9,570 | 9,900 |
Source: Compiled by the HotelBank Editorial Team from MetroEngines Research
One step in the grid equals ¥300 on the rate side and 3 points on the occupancy side. Near the mid scenario (estimated settled ADR of ¥10,100–10,400 and estimated OCC of 81–84%), a one-step increase in rate adds ¥243 while a one-step increase in occupancy adds ¥312 — the occupancy side has slightly more effect. Put differently, recovering the revenue density lost by cutting the rate by ¥300 requires roughly 2.42 points of additional estimated OCC. In July 2026, Ryokan sat flat at 78.0–78.9% from Monday through Thursday, leaving a gap of more than 13 points to Saturday’s 92.3%. If there is room to push the weekday floor up by a few points, the relationship implies that holding price and building weekday occupancy does more for revenue density than cutting price to chase occupancy.
That said, this calculation is a definitional consequence of multiplying two measured values from this article, not a prediction of the effect of any given initiative. To apply it at your own property, rebuild the same table using your actual room occupancy and achieved ADR in place of estimated OCC.
Summary — three yardsticks for reading Fukushima’s four categories
First, always view year-on-year and two-year comparisons as a set. All four categories in Fukushima were positive year on year over April–July 2026, but against the same period in 2024 the signs split: City Hotels +2.0% and Business Hotels +0.8% versus Ryokan −6.9% and Resort Hotels −6.9%. Looking at year-on-year alone, Ryokan and Resort Hotels appear to be leading the growth; add the two-year comparison and the picture inverts into one where these are the two categories still working their way back.
Second, verify a single month’s growth rate against the month it is being compared with. Resort Hotels’ +14.2% in June 2026 is the flip side of the fact that June a year earlier, at ¥9,026, was the lowest month in three years. Whenever a month shows a large growth rate, it pays to make a habit of first checking whether the year in the denominator was normal.
Third, monthly volatility can be explained by the demand shape of the category. The max-minus-min year-on-year spread was 1.3 points for Business Hotels, 4.3 points for Ryokan, 8.3 points for City Hotels and 14.7 points for Resort Hotels. Daily results for July 2026 show the corresponding pattern: the larger a category’s Saturday-versus-Wednesday estimated OCC gap, the more its monthly values move. When your own year-on-year figure swings sharply in a given month, suspect the calendar first, then assess the change in underlying performance.
About the Data
| Item | Details |
|---|---|
| Definition of estimated OCC | Occupancy based on OTA-listed inventory = 100 − 100 × rooms remaining on OTAs ÷ total rooms. It is an estimate based on how listed inventory is being sold down on OTAs, and is defined differently from actual room occupancy (it runs higher). This article averages the daily results for July 2026 (Fukushima, month in progress) by day of the week. |
| Observation window | Booking curve: based on observations from 45 days before the stay date up to the most recent point. The estimated OCC in this article is the most recent value obtained within this observation window for each stay date in the target month. |
| Definition of estimated settled ADR | The transaction price level (tax-exclusive equivalent) estimated from OTA and other sales data (lowest-plan level × category-specific coefficients, ensembled across multiple channels). Past months are finalized values; the current and future months are estimates based on present sales conditions. Median error of 6.6% when checked against published operating results. Year-on-year figures in this article are calculated between finalized months only and exclude months that are current-point estimates. |
| Breakdown of N= | Estimated settled ADR (July 2026 finalized): City Hotels N=17, Business Hotels N=156, Ryokan N=232, Resort Hotels N=34 (439 properties in total). For April–June 2026: Business Hotels N=158–160, Ryokan N=236–239, Resort Hotels N=31–34, City Hotels N=17. Figures for each month of 2025 and 2024 are noted in the tables in the body text. Properties observed within the month for estimated OCC (July 2026, Fukushima): Ryokan 154–200, Resort Hotels 22–30, Business Hotels 120–127, City Hotels 15–16. |
| Data date | Data as of August 7, 2026. Sales conditions and inventory change daily, so the figures in this article are a snapshot as of the time of retrieval. |
Source: Compiled by the HotelBank Editorial Team from MetroEngines Research
■ Data sources
Estimated settled ADR was obtained as monthly area aggregates (finalized months) from January 2024 to July 2026 for four categories in Fukushima: City Hotels, Business Hotels, Ryokan and Resort Hotels. Estimated OCC averages the category-level daily values for the same prefecture in July 2026 by day of the week. Both are MetroEngines Research aggregate data (re-aggregated by the HotelBank Editorial Team). Data as of August 7, 2026.
■ Calculation assumptions
Both the year-on-year and the versus-2024 figures are calculated between finalized months only and exclude months that are current-point estimates (August 2026 onward). The April–July average is a simple average of each month. The estimated RevPAR equivalent in Tables 5 and 6 is the definitional multiplication “estimated settled ADR × estimated OCC,” with both axes limited to values inside the range observed in the body text (Ryokan estimated settled ADR of ¥9,800–11,000 and estimated OCC of 78–90%). No new demand forecast or assumed initiative effect has been applied.
■ Limitations and caveats
Estimated settled ADR has a median error of 6.6% when checked against published operating results. Estimated OCC is an estimate based on OTA-listed inventory and runs higher than actual room occupancy, so the estimated RevPAR equivalent derived by multiplying the two must be treated as an indicator for relative comparison rather than an absolute level. Resort Hotels have the smallest coverage of the four categories at 31–34 properties, which makes the effect of a single property’s movement on the monthly median relatively large. Figures are a snapshot as of the time of retrieval and may shift slightly after the fact as observations accumulate or data is re-aggregated.
Related reading
- Aichi Settled ADR 18 Months: City Swings 25.0pt, Business 14.0pt
- Japan Hotel ADR Polarization 2026: 57.6pt Prefecture×Category Gap
- Kyoto Hotel ADR Falls YoY in June 2026: City -14.6%, Business -9.8%
- Ishikawa ADR H1 2026: City +3.6%, Business −1.3%, a 14.2pt Gap
- Japan Autumn 2026 Hotel Price Range: 3.3x CV Gap Across 47 Prefectures