

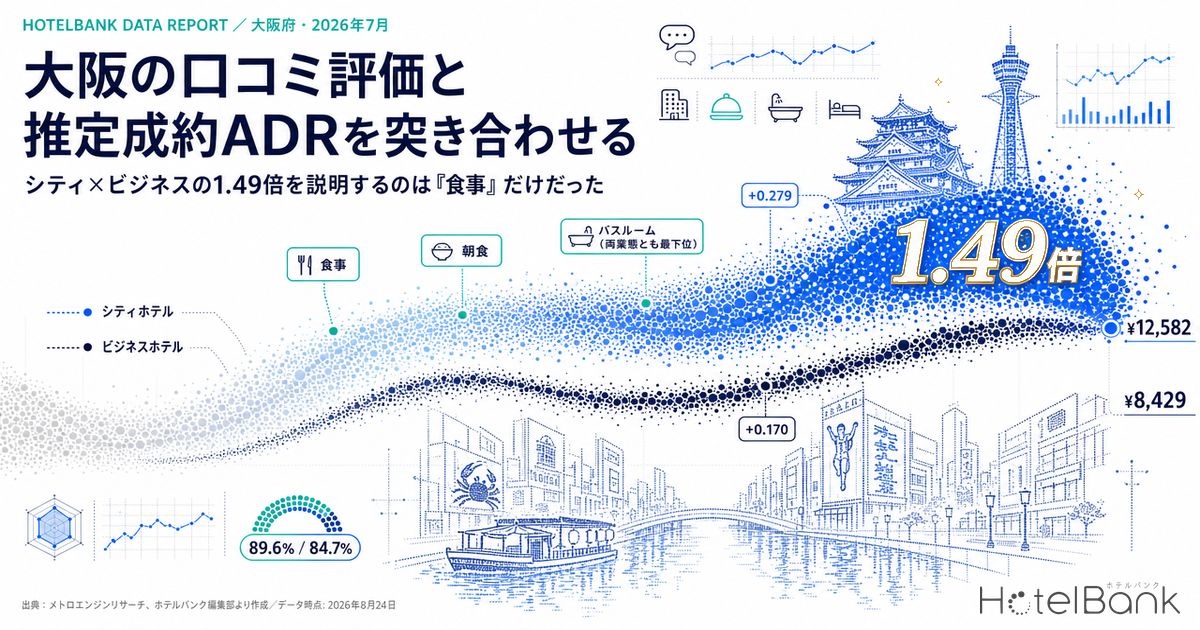
Between city hotels and business hotels in Osaka there is, as of July 2026, a gap of roughly 1.49x in estimated settled ADR (City ¥12,582, N=97 properties / Business ¥8,429, N=497 properties). Yet when guest review scores are broken into ten categories and the two segments are placed side by side, the only categories with a clear gap are Meals (+0.279) and Breakfast (+0.170). Location (+0.088), Rooms (+0.085) and Staff (+0.066) all stay below 0.1. Estimated occupancy for the same month (July 2026) is also close — City 89.6% (91 properties) versus Business 84.7% (449 properties) — so this is a market where the two segments differ not in how they fill, but in what they charge. This article lines up Osaka’s review structure against its price structure and turns one question into a revenue-management agenda: where exactly is a review-score gap being translated into money?
• Scope: city hotels and business hotels in Osaka Prefecture. Review scores N=up to 67 city / up to 309 business properties (past 24 months; property counts differ by category). Estimated settled ADR N=97 city / 497 business properties (July 2026).
• Estimated settled ADR = a transaction-price level (tax-excluded equivalent) estimated from sales data such as OTA listings (lowest-plan level × segment coefficient). Median error against published operating results is 6.6%. It is an estimate and differs from any individual property’s actual transaction prices or accounting figures.
• Estimated occupancy (OCC) = sold rooms as a share of total rooms in the area, estimated from OTA sales inventory. The definition differs from actual room occupancy.
• Source: MetroEngines Research. Data as of August 24, 2026. Full definitions and the breakdown of N are given in the “About the Data” section at the end of this article.
- — 1.49x July 2026 estimated settled ADR was City ¥12,582 versus Business ¥8,429 (N=97 / 497 properties). Placed against six major markets, Osaka has the smallest segment price gap of them all.
- — Meals +0.279, Breakfast +0.170 These are the only two of the ten review categories where the segment gap stands out. Location +0.088 and Rooms +0.085 show no meaningful gap and do not explain the price difference.
- — Approx. 2.5x The breakfast-included minus room-only gap is ¥4,349 at city hotels and ¥1,736 at business hotels (August 2026, same-hotel paired comparison). A 0.170-point review gap is implemented as a 2.5x gap in money.
- — 4.9pt Estimated occupancy in the same month was City 89.6% versus Business 84.7%. Fill rates are close; the gap sits on the rate side. Day-of-week swings are larger at business hotels (amplitude 12.0pt versus 7.7pt).
- — ¥694 per room Setting the breakfast gap at the market mid-point of ¥1,736 with a 40% attach rate lifts average rate per room by ¥694 (about ¥694,000 per 1,000 rooms sold).
A 1.49x rate gap and a 4.9pt occupancy gap — where the Osaka market stands
Start with price. In July 2026 (final figures) estimated settled ADR was ¥12,582 for city hotels (N=97 properties) and ¥8,429 for business hotels (N=497 properties) — a gap of ¥4,200, or 1.49x. A year earlier (also final figures) the same months were City ¥16,798 (N=90 properties) and Business ¥12,380 (N=502 properties), putting year-on-year change at −25.1% for city and −31.9% for business. Osaka hosted Expo 2025 Osaka, Kansai from April 13 to October 13, 2025 (a 184-day run; source listed at the end of this article), so the 2025 level already embeds that large-event demand. The practical signal, then, is less the size of the 2026 decline than its asymmetry. How that rebound deepened month by month is broken out in Osaka Settled ADR June 2026: City −26.3%, Business −32.8% Post-Expo.
In fact, the absolute gap has barely moved. The city-minus-business spread was ¥4,418 in July 2025 and ¥4,153 in July 2026 — a narrowing of just ¥265 even though the overall level fell by 20–30%. The multiple therefore widened from 1.36x to 1.49x. Even as business-hotel rates fall, city hotels are not falling by the same margin. The annual shape tells the same story: both segments bottom out in the first half of the year. In 2026 the low month is June (City ¥10,769, Business ¥7,884); in 2025 both segments bottomed in January. Both then lift toward autumn (figures from August 2026 onward are estimates), but the city-hotel swing is the wider of the two.
Now occupancy. For July 2026 (month in progress, 31-day average) estimated occupancy was 89.6% at city hotels (91 properties) and 84.7% at business hotels (449 properties) — a gap of only 4.9pt. Rates differ by 1.49x, but fill rates differ by less than five points: that was the real shape of Osaka in July. Averaged by day of week across the 29 days with sufficient observations, city hotels ran 94.1% on Saturday and 86.4% on Monday (amplitude 7.7pt), while business hotels ran 90.4% on Saturday and 78.4% on Monday (amplitude 12.0pt). That business hotels swing more by day of week is worth holding onto when designing measures to lift weekday nights.
Is 1.49x large? Against six major markets, it is the smallest
Taken alone, 1.49x looks like a wide spread. But lined up against other major markets for the same month on the same definition, Osaka has the smallest city-to-business multiple of the six. The table below compares estimated settled ADR for July 2026 (all final figures).
| Area | City | N (properties) | Business | N (properties) | Multiple |
|---|---|---|---|---|---|
| Osaka | ¥12,582 | 97 | ¥8,429 | 497 | 1.49x |
| Aichi | ¥11,466 | 30 | ¥7,491 | 323 | 1.53x |
| Hokkaido | ¥17,819 | 75 | ¥11,154 | 432 | 1.60x |
| Fukuoka | ¥16,608 | 40 | ¥10,382 | 340 | 1.60x |
| Kyoto | ¥17,420 | 58 | ¥10,230 | 325 | 1.70x |
| Tokyo | ¥22,434 | 107 | ¥12,306 | 913 | 1.82x |
Tokyo tops the list at 1.82x, followed by Kyoto at 1.70x, Fukuoka at 1.60x and Hokkaido at 1.60x; Osaka’s 1.49x sits below even Aichi’s 1.53x. In other words, Osaka is a market where city and business hotels are priced relatively close together. The review structure seen in the next section — neither location nor rooms separating the segments by as much as 0.1 — points in the same direction as this narrow multiple. In a market with a thick supply of business hotels holding sites right by major stations, the segment label alone cannot build a price hierarchy. Which is exactly why how the few genuinely differentiated areas (meals and breakfast) get translated into money carries relatively more weight in Osaka.
One caveat on the comparison: the multiples are aligned on the same month and the same definition (estimated settled ADR, final figures), but segment mix and inbound share differ by market, so the level of the multiple should not be read as better or worse. The single point to take away is that in Osaka the price hierarchy between segments is relatively flat.
Of ten categories, only meals and breakfast separate the segments
So what part of the guest experience supports that rate gap? The table below splits guest review scores into ten categories, averages them over the past 24 months, and places Osaka’s city and business hotels side by side. The city side draws on 236,294 reviews in total and the business side on 479,301 (because the set of properties carrying a score differs by category, both the property count N and the review volume vary row by row).
| Review category | City average | N (properties) | Business average | N (properties) | Gap |
|---|---|---|---|---|---|
| Meals | 4.173 | 54 | 3.894 | 157 | +0.279 |
| Breakfast | 4.157 | 58 | 3.987 | 211 | +0.170 |
| Cleanliness | 4.145 | 63 | 4.039 | 283 | +0.106 |
| Bathroom | 3.788 | 60 | 3.684 | 262 | +0.104 |
| Facilities | 3.982 | 61 | 3.881 | 284 | +0.101 |
| Service | 4.130 | 67 | 4.036 | 309 | +0.094 |
| Location | 4.304 | 67 | 4.216 | 309 | +0.088 |
| Rooms | 4.117 | 67 | 4.032 | 309 | +0.085 |
| Staff | 4.242 | 61 | 4.176 | 267 | +0.066 |
| Amenities | 4.157 | 52 | 4.094 | 181 | +0.063 |
Three things stand out. First, Meals (+0.279) and Breakfast (+0.170) are the outliers. From third place down the field bunches — Cleanliness +0.106, Bathroom +0.104, Facilities +0.101 — and everything after that falls below 0.1. Second, the two factors most often invoked to explain a price gap, Location (+0.088) and Rooms (+0.085), barely separate the segments at all. Osaka has a deep supply of business hotels, and properties with sites right by major stations exist regardless of segment, so location is not the exclusive property of city hotels. Rooms are the same story: on review scores, the difference is under 0.1. Third, Bathroom is the lowest-scoring category in both segments (City 3.788 / Business 3.684). It is the only one of the ten categories sitting in the high 3-point range, meaning the floor of the review structure is shared across segments. This is a figure to read not as an explanation of the price gap but as a market-wide common issue. Bathroom landing as the weakest category is not unique to Osaka; the same ranking shows up in our analysis matching Kyoto’s review-score distribution against estimated settled ADR.
How much money is that review gap worth? The meal-plan spread
Next, how much the meal-related categories that do show a review gap are actually being sold for. The method here is a paired comparison: take only properties selling both a room-only plan and a meal-inclusive plan, and measure the spread within each hotel (a simple property-to-property comparison would import a selection bias, since higher-priced properties sell more meal-inclusive plans in the first place). Ryokan are excluded as a different segment. The figures are the August 2026 sales cross-section.
| Comparison pair | Segment | Spread | vs room-only | N (paired properties) |
|---|---|---|---|---|
| Breakfast included − room only | City hotels | ¥4,349 | +17.1% | 57 |
| Breakfast included − room only | Business hotels | ¥1,736 | +10.9% | 164 |
| Half board − room only | City hotels | ¥14,274 | +44.3% | 20 |
| Half board − room only | Business hotels | ¥8,348 | +52.1% | 23 |
| Breakfast included − room only | Osaka overall | ¥3,125 | +15.0% | 245 |
Adding breakfast is worth ¥4,300 at city hotels (+17.1%, N=57 properties) and ¥1,700 at business hotels (+10.9%, N=164 properties) — a gap of roughly 2.5x in money. A breakfast review gap of +0.170 points shows up, in how the product is priced, as a 2.5x difference. Across Osaka as a whole the figure is ¥3,125 (+15.0%, N=245 properties).
Extend to half board and the absolute gap widens — City ¥14,300 (N=20 properties) versus Business ¥8,300 (N=23 properties) — but measured against room-only, business hotels lead at +52.1% versus city hotels’ +44.3%. With only about twenty paired properties on each of those rows, this is not a basis for firm conclusions, but it is worth noting that there is a real cohort of business-segment properties where bundling dinner supports pricing at 1.5x the room-only rate. Even within one segment, how far meals have been productized changes the ceiling on rate. For how to design the width of each step in that room-only → breakfast → half-board staircase by segment, see also our breakdown of Oita’s meal premiums by segment.
Move the breakfast spread and what happens to average rate? Three scenarios and a two-axis sensitivity grid
Everything to this point has been measured market data. What follows is a simulation of how much rate would move if those measured values were applied to your own hotel (read it as a calculation under the stated assumptions, not as a measurement). The formula is simple: uplift in average rate per room = breakfast spread × breakfast-plan attach rate. The breakfast spread uses the measured same-hotel paired values from the previous section; the attach rate is an assumption you set for your own property.
| Scenario | Assumption (spread × attach rate) | Per room | Per 1,000 rooms sold | Situation it represents |
|---|---|---|---|---|
| Pessimistic | ¥1,000 × 25% | ¥250 | ¥250,000 | Own breakfast spread at half the market level or less, with a low attach rate |
| Mid-case | ¥1,736 × 40% | ¥694 | ¥694,000 | Spread set at the business-segment market level (¥1,736) |
| Optimistic | ¥3,125 × 50% | ¥1,563 | ¥1,563,000 | Spread raised to the Osaka-wide level (¥3,125) and attach rate stretched to 50% |
| Reference: city-segment market level | ¥4,349 × 40% | ¥1,740 | ¥1,740,000 | City-segment breakfast spread (¥4,349) applied at the same attach rate |
In the mid-case — own breakfast spread set at Osaka’s business-segment market level (¥1,736) with a 40% breakfast attach rate — average rate per room rises by ¥694, or about ¥694,000 per 1,000 rooms sold. Whether that can be stretched to ¥1,563 (optimistic) depends on whether you move the spread itself, the attach rate, or both. To see which lever does more work, the next table varies the two axes.
| Breakfast spread \ Breakfast attach rate | 20% | 30% | 40% | 50% | 60% |
|---|---|---|---|---|---|
| ¥1,000 | ¥200 | ¥300 | ¥400 | ¥500 | ¥600 |
| ¥1,750 (business level) | ¥350 | ¥525 | ¥700 | ¥875 | ¥1,050 |
| ¥2,500 | ¥500 | ¥750 | ¥1,000 | ¥1,250 | ¥1,500 |
| ¥3,250 | ¥650 | ¥975 | ¥1,300 | ¥1,625 | ¥1,950 |
| ¥4,350 (city level) | ¥870 | ¥1,305 | ¥1,740 | ¥2,175 | ¥2,610 |
There are two ways to read it. First, because spread and attach rate multiply, moving both by a moderate amount is easier to reach than pushing either one hard. A ¥1,750 spread at a 60% attach rate (¥1,050) and a ¥3,250 spread at 30% (¥975) land in essentially the same place. Second, the ¥4,350 row — the city-segment level — delivers ¥870 even at a 20% attach rate, ahead of the business level at 40% (¥700). There is an asymmetry here: where the absolute spread is high, contribution to rate can be secured without forcing the attach rate up.
The limits of this simulation should be stated as well. (1) The breakfast spread is a difference in listed plan prices, not a profit contribution net of food cost and labor. (2) Raising the attach rate may simply displace demand that would have booked room-only, so the uplift does not necessarily flow through as incremental revenue. (3) The paired comparison covers only properties selling both room-only and meal-inclusive plans. This table is therefore best used not as a decision input, but as a tool for working out which variables are worth debating, and by how much.
For revenue managers running city and business hotels in Osaka — implications and an action plan
1. Test the assumption that “location is what earns our rate” against the numbers. The location gap is +0.088 and rooms +0.085 — essentially no separation across segments. If your pricing is built on location as your strength, check whether that advantage actually shows up above your neighbors in review scores. Arguing for a higher price band on the basis of a category where no gap exists is unlikely to register as differentiation on the market side.
2. Meals and breakfast are the rare areas where a review gap is implemented as a price gap. The only categories with a gap are Meals +0.279 and Breakfast +0.170; from third place down everything clusters near 0.1. And the breakfast spread differs by roughly 2.5x — City ¥4,349 versus Business ¥1,736. Where your own breakfast spread sits relative to your segment’s level is the most concrete yardstick available for measuring room to raise rates.
3. Bathroom is not an explanation of the price gap; it is a shared floor. At City 3.788 and Business 3.684 it ranks last of the ten categories in both segments, so it is not differentiation material between them. At the same time, being the only category in the high 3-point range points to upside in lifting overall review scores. As an input to capex decisions, it belongs in the “raise the floor on reviews” conversation rather than the “raise rate” one.
4. The rate gap comes from pricing, not from occupancy. July 2026 estimated occupancy was City 89.6% versus Business 84.7%, a 4.9pt gap, against a 1.49x gap in estimated settled ADR. And day-of-week swings are larger at business hotels (amplitude 12.0pt versus 7.7pt). There is room to separate the days you build occupancy from the days you take rate.
| Horizon | Action | Trigger | Objective |
|---|---|---|---|
| Today to this week | Measure your own breakfast-included minus room-only spread and line it up against your segment level (City ¥4,349 / Business ¥1,736) | Your spread sits clearly below your segment’s level | Put a yen figure on the room to reprice breakfast |
| Today to this week | Split your review scores into the ten categories and judge whether meals and breakfast are a relative strength or weakness for your property | Meals and breakfast score above your property average yet the spread is thin | Surface the places where review equity is not reflected in pricing |
| Within two weeks | Assign different roles to rate and occupancy by day of week — lean on occupancy where the week dips, on rate where it is strong | Your day-of-week amplitude resembles the business segment’s 12.0pt shape | Fill the mid-week trough with add-on value such as meal plans |
| Within two weeks | Do not stop at the room-only / breakfast-included binary — assess whether a higher tier bundling dinner is viable | Dinner can be served in-house or via a partner, and against the half-board spread (Business +52.1% / City +44.3%) your property has no upper-tier plan | Raise the ceiling on rate |
| Looking to next month | Align your pricing calendar with the seasonal shape — check the lift from the first-half trough to the autumn peak against your segment’s curve | Your autumn (October–November) settings stay flat relative to the lift in market estimated settled ADR | Avoid leaving peak-season demand on the table |
| Looking to next month | Read through bathroom-related review comments and sort which items — cleaning, fixtures, layout — actually move with improvement | Your bathroom score is at or below the market level (around 3.7) | Build support for repricing by lifting the floor on overall review scores |
Conclusion — three yardsticks Osaka gives you
From the Osaka city-versus-business comparison, three “yardsticks” carry over to other areas.
Yardstick 1 | Do not treat a category with a sub-0.1 review gap as an explanation for price. In Osaka that covers location, rooms, staff and amenities. Pricing in a category where no gap exists as if it were a strength puts you out of step with how the market scores you.
Yardstick 2 | Follow a review gap all the way to whether it has been translated into money. Against a breakfast review gap of +0.170, the spread is ¥4,349 versus ¥1,736 — roughly 2.5x. What moves rate is not scoring well in itself, but whether that score is being sold as a spread.
Yardstick 3 | Diagnose the occupancy gap and the rate gap separately. A 4.9pt gap in July 2026 estimated occupancy sits against a 1.49x gap in estimated settled ADR for the same month. In a market where properties fill at similar rates but charge differently, reworking product design and pricing usually beats chasing occupancy.
About the Data
• Definition of estimated occupancy (OTA-listed-inventory basis): OTA-listed-inventory occupancy = 100 − 100 × rooms remaining on OTA listings ÷ total rooms. It is an estimate based on how listed inventory is consumed on OTAs and differs by definition from actual room occupancy (it reads higher). This article covers daily results for Osaka Prefecture in July 2026 (month in progress); monthly averages are City 89.6% (91 properties, 31 days) and Business 84.7% (449 properties, 31 days). Day-of-week averages are calculated from the 29 days with sufficient observations.
• Definition of estimated settled ADR: a transaction-price level (tax-excluded equivalent) estimated from sales data such as OTA listings (lowest-plan level × segment coefficient, ensembled across multiple channels). Past months are final; the current and future months are estimates based on current sales conditions. Median error against published operating results is 6.6%. All year-on-year comparisons in this article are calculated between final figures only.
• Breakdown of N: estimated settled ADR covers Osaka city hotels N=97 properties (July 2026) and N=90 properties (July 2025), and Osaka business hotels N=497 properties (July 2026) and N=502 properties (July 2025). Review scores are an anonymized aggregate over the past 24 months, with 52–67 city properties and 236,294 reviews in total, and 157–309 business properties and 479,301 reviews in total (the base differs by category). The meal-plan spread is a paired comparison limited to properties selling both room-only and meal-inclusive plans within the same hotel (ryokan excluded); paired property counts are stated in the table.
• Estimated settled ADR from August 2026 onward is an estimate based on current sales conditions and will move with future demand. It should not be compared directly with prior-year final figures; wait for month-end finalization before judging.
• Data as of August 24, 2026. Sales conditions and inventory change daily, so the figures in this article are a snapshot as of the time of retrieval.
References and Sources
■ Data sources
Guest review scores are anonymized category averages compiled by MetroEngines (Osaka Prefecture, past 24 months, 236,294 city reviews / 479,301 business reviews in total). Estimated settled ADR is our own estimate based on OTA public prices and inventory data (July 2026 final; August 2026 onward estimated from current sales conditions). Estimated occupancy is our own estimate based on how OTA-listed inventory is consumed (Osaka Prefecture, daily results for July 2026). The meal-plan spread is a paired comparison of properties selling both room-only and meal-inclusive plans within the same hotel (August 2026 cross-section, ryokan excluded). The six-market multiple comparison is aligned on July 2026, final figures, and a single definition. All sourced from MetroEngines Research.
■ Simulation assumptions
Tables 5 and 6 in the section on moving the breakfast spread are simulations, not measurements. The formula is: uplift in average rate per room = breakfast spread × breakfast-plan attach rate. The breakfast spread uses the measured same-hotel paired values shown in the article (Business ¥1,736 / Osaka overall ¥3,125 / City ¥4,349) plus a ¥1,000–¥4,350 range; attach rates are assumptions of 20–60%. Per-room amounts are rounded to the nearest yen, and per-1,000-rooms amounts are those values multiplied by 1,000. The mid-case is a ¥1,736 spread at a 40% attach rate.
■ Limitations and caveats
(1) Estimated settled ADR and estimated occupancy are both estimates, and differ from any individual property’s actual transaction prices and room occupancy in both definition and level. (2) Because the set of properties carrying a score differs by review category, the base (property count and review volume) varies by row. (3) The breakfast spread is a difference in listed plan prices, not a profit contribution net of food cost and labor. (4) Raising the attach rate may simply displace part of room-only demand, so the uplift does not necessarily flow through as incremental revenue. (5) With only about twenty paired properties, the half-board rows are presented as an indication of direction only. (6) The 2025 level embeds demand from Expo 2025 Osaka, Kansai (April 13 – October 13, 2025), and year-on-year figures are calculated between final figures only.
• EXPO 2025 Osaka, Kansai official website, “Overview” (run period April 13 – October 13, 2025; 184 days)
https://www.expo2025.or.jp/overview/
Related reading
- Osaka Settled ADR June 2026: City −26.3%, Business −32.8% Post-Expo
- Osaka Obon 2026 Booking Curve: Aug 14 at 74.9%, Aug 16 Stuck at 64.1%
- Kyoto Reviews vs Settled ADR: Bathroom 4.002 Weakest, July ¥17,420
- A 4.1 Review Score Is Average, Not a Strength: Sapporo Price Position
- Oita Meal Premiums: Business Breakfast +10.6%, Half-Board +39.3%
- Nagano Breakfast Premium: City +11.1% vs Resort +3.2% — 3x Segment Gap
- Fukuoka Settled ADR Slows +14.4% to +3.6% — Breakfast Premium Next?