

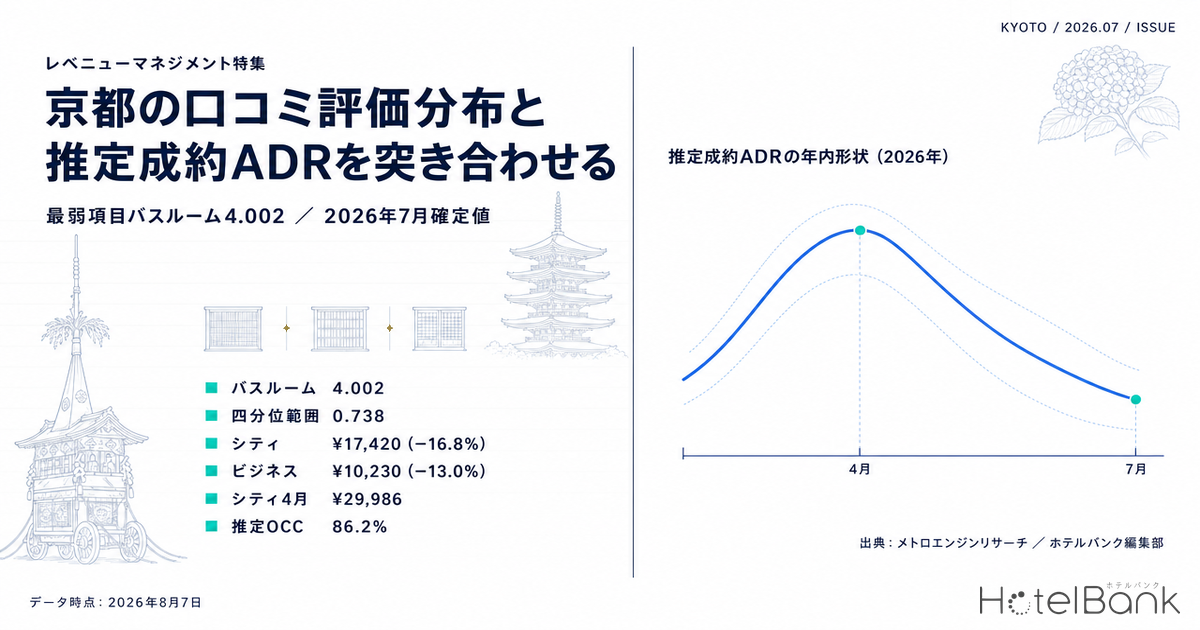
For accommodations in Kyoto, we cross-referenced the area baseline for 10 guest-review categories (last 24 months, 459,696 reviews in total) against final estimated settled ADR. Of the 10 categories, the lowest average belongs to Bathroom at 4.002 (319 properties, 38,231 reviews), and it is simultaneously the widest, with a first quartile of 3.660 and a third quartile of 4.398 — an interquartile range of 0.738 points, the largest of the 10. In other words, Bathroom is the category where Kyoto scores lowest and where properties differ most from one another. On the price side, final estimated settled ADR for July 2026 came in at ¥17,420 for city hotels (N=58 properties), ¥10,230 for business hotels (N=325 properties) and ¥18,838 for ryokan (N=203 properties). Against the final figures for the same month a year earlier, that is −16.8% for city hotels, −13.0% for business hotels and −2.1% for ryokan: rates landed below the prior year even though estimated occupancy that month was high, at 86.2% for city hotels and 83.5% for business hotels. The data below builds a yardstick for reading where your own property sits within these distributions.
Scope: city hotels, business hotels and ryokan in Kyoto. Review scores cover 175–610 properties depending on the category (459,696 reviews across 10 categories, last 24 months); estimated settled ADR covers N=58 properties (city hotels), N=325 properties (business hotels) and N=203 properties (ryokan) for the July 2026 final figure; estimated occupancy is drawn from 55–56 observed properties (city) and 285–293 observed properties (business). Price figures in this article are estimated settled ADR (a settled price level inferred from OTA and other sales data, tax-exclusive equivalent); occupancy is an estimate based on OTA-listed inventory. Full definitions appear at the end of the article. Data as of August 7, 2026.
- — Bathroom 4.002 — the lowest average of Kyoto’s 10 guest-review categories, and simultaneously the widest with an interquartile range of 0.738 points. The weakest category and the most dispersed category are one and the same.
- — A 0.460-point gap between property types — the same Bathroom category runs 3.754 at business hotels, 4.043 at city hotels and 4.214 at ryokan. A single prefecture-wide benchmark line is either too high or too low depending on where you sit.
- — July 2026 estimated settled ADR fell below the prior year — city hotels ¥17,420 (−16.8%), business hotels ¥10,230 (−13.0%), ryokan ¥18,838 (−2.1%). The more a property type depends on room revenue, the deeper the decline.
- — The shape of the year peaks in April and troughs in June–July — city hotels run from ¥29,986 in April to ¥17,420 in July; business hotels from ¥20,308 in April to ¥9,616 in June. This is the skeleton of a rate-revision calendar.
- — Volume came through; rates did not recover — estimated occupancy in July 2026 was high at 86.2% (city) and 83.5% (business). The day-of-week spread widens to 14.1 points at business hotels.
Kyoto’s 10 guest-review categories — the weakest category is also the most dispersed
Start with the review baseline for Kyoto as a whole. Ranked by average, the top is Staff at 4.460 (336 properties, 27,017 reviews), followed by Location at 4.430 (578 properties, 87,662 reviews) and Amenities at 4.421 (175 properties, 8,863 reviews). Bottom of the list is Bathroom at 4.002 (319 properties, 38,231 reviews), just below Facilities at 4.210 (333 properties, 35,859 reviews) and Room at 4.290 (610 properties, 97,784 reviews).
What matters here is not the average itself but the width of the spread. Taking the gap between the first and third quartiles, Bathroom is widest at 0.738 points, followed by Facilities at 0.690 and Service at 0.652. At the narrow end sit Amenities at 0.414, Breakfast at 0.466 and Location at 0.499. Location averages a high 4.430 yet is tightly packed — a structural hint that in the Kyoto market “being well located” is hard to turn into differentiation. Bathroom, by contrast, has an average of 4.002 and a median of exactly 4.000 while its third quartile stretches to 4.398: within the same Kyoto market, guests receive it very differently from one property to the next.
Source: MetroEngines Research; compiled by the HotelBank Editorial Team
| Review category | Properties | Reviews | Average | P25 | Median | P75 | IQR |
|---|---|---|---|---|---|---|---|
| Bathroom | 319 | 38,231 | 4.002 | 3.660 | 4.000 | 4.398 | 0.738 |
| Facilities | 333 | 35,859 | 4.210 | 3.896 | 4.258 | 4.586 | 0.690 |
| Room | 610 | 97,784 | 4.290 | 4.058 | 4.369 | 4.631 | 0.573 |
| Service | 602 | 90,243 | 4.321 | 4.049 | 4.407 | 4.701 | 0.652 |
| Breakfast | 267 | 16,959 | 4.334 | 4.134 | 4.396 | 4.600 | 0.466 |
| Cleanliness | 396 | 39,355 | 4.361 | 4.110 | 4.444 | 4.706 | 0.596 |
| Meals | 219 | 17,723 | 4.385 | 4.133 | 4.455 | 4.715 | 0.582 |
| Amenities | 175 | 8,863 | 4.421 | 4.253 | 4.474 | 4.667 | 0.414 |
| Location | 578 | 87,662 | 4.430 | 4.223 | 4.508 | 4.722 | 0.499 |
| Staff | 336 | 27,017 | 4.460 | 4.202 | 4.533 | 4.771 | 0.569 |
Kyoto, last 24 months; properties covered differ by category / Source: MetroEngines Research; compiled by the HotelBank Editorial Team
The fact that coverage ranges from 175 to 610 properties depending on the category bears directly on how to read these numbers. Room, Service and Location are each scored by roughly 600 properties, while Amenities covers only 175 and Meals only 219. Categories with a small base shift more easily with the mix of reviews posted. Property counts and review counts are therefore stated alongside every comparison that follows. The same procedure — checking price position by asking where your property sits in the distribution — was applied to central Sapporo in A 4.1 Review Score Is Average, Not a Strength: Sapporo Price Position.
Redraw the benchmark by property type and Bathroom moves 0.46 points
Setting the prefecture-wide average of 4.002 as your own target line is risky. Broken out by property type, the Bathroom average is 3.754 at business hotels (121 properties, 18,406 reviews), 4.043 at city hotels (32 properties, 9,905 reviews) and 4.214 at ryokan (92 properties, 6,459 reviews) — a 0.460-point gap between the lowest and highest type. For a business hotel, 4.002 is not “average for the prefecture”; it is upper-tier within its own type.
The other categories follow the same pattern. Room runs 4.182 (business), 4.339 (city) and 4.293 (ryokan); Cleanliness 4.164, 4.446 and 4.473; Service 4.120, 4.304 and 4.413. Even Location — the most divisive category across Kyoto as a whole — sits close together at 4.362 (business, 147 properties), 4.425 (city, 37 properties) and 4.467 (ryokan, 139 properties), holding high regardless of type.
The table below places those review levels alongside price in the same market. Final estimated settled ADR for July 2026 was ¥17,420 for city hotels (N=58 properties), ¥10,230 for business hotels (N=325 properties) and ¥18,838 for ryokan (N=203 properties). Against the final figures for the same month a year earlier, ryokan were down just 2.1% while city hotels fell 16.8% and business hotels 13.0% — the more a property type depends on room revenue, the wider the shortfall.
| Property type | Bathroom | Room | Cleanliness | Service | July 2026 estimated settled ADR (final) | YoY (final vs final) |
|---|---|---|---|---|---|---|
| City hotels | 4.043 32 properties, 9,905 reviews | 4.339 37 properties, 21,486 reviews | 4.446 33 properties, 8,417 reviews | 4.304 37 properties, 20,163 reviews | ¥17,420 N=58 properties | −16.8% |
| Business hotels | 3.754 121 properties, 18,406 reviews | 4.182 149 properties, 45,974 reviews | 4.164 130 properties, 21,385 reviews | 4.120 148 properties, 40,984 reviews | ¥10,230 N=325 properties | −13.0% |
| Ryokan | 4.214 92 properties, 6,459 reviews | 4.293 157 properties, 13,108 reviews | 4.473 112 properties, 4,689 reviews | 4.413 155 properties, 11,902 reviews | ¥18,838 N=203 properties | −2.1% |
Review scores are 24-month averages / ADR figures are final for July 2026 and for the same month a year earlier / Source: MetroEngines Research; compiled by the HotelBank Editorial Team
What is shown here are two cross-sections of the same market; no causal claim is made between reviews and price. That said, the ordering — the property types whose rates landed below the prior year are also the ones with lower review baselines — gives you a coordinate system for locating your own property.
The shape of the year in estimated settled ADR — April peaks, June to August troughs
Tracked monthly, Kyoto’s shape through the year is unmistakable. Final 2026 figures for city hotels open low at ¥18,432 in January and ¥18,660 in February, climb to ¥26,774 in March and ¥29,986 in April — the high for the year — then pass through ¥25,867 in May before falling to ¥17,738 in June and ¥17,420 in July. Business hotels follow the same arc: from ¥9,773 in January and ¥9,641 in February to a peak of ¥20,308 in April, with ¥9,616 in June the low for the year and ¥10,230 in July. The cherry-blossom month of April and the June–July trough are the two poles around which a rate-revision calendar is built. How both property types came to fall below the prior year in that trough month of June is broken out month by month in Kyoto Hotel ADR Falls YoY in June 2026: City −14.6%, Business −9.8%.
Figures from August 2026 onward are estimates based on current sales conditions and may shift as selling progresses. For reference, city hotels stand at ¥17,244 in August, ¥19,118 in September, ¥29,445 in October, ¥34,202 in November and ¥23,971 in December (N=57–58 properties); business hotels at ¥10,244, ¥12,265, ¥20,599, ¥24,155 and ¥15,812 respectively (N=284–315 properties). A straight comparison with prior-year final figures has to wait for month-end confirmation, but the shape itself — levels stepping up into autumn — is common to both years.
Solid lines = final figures / dotted lines = estimates based on current sales conditions / Source: MetroEngines Research; compiled by the HotelBank Editorial Team
Demand in July 2026 — a 14.1-point day-of-week spread at business hotels
For July 2026, the month in which rates fell below the prior year, it is worth looking at the demand side as well. Estimated OCC that month (OTA-listed inventory basis) averaged 86.2% for city hotels (55–56 properties observed) and 83.5% for business hotels (285–293 properties observed). The daily high for both fell on Saturday, July 18, at 94.7% (city) and 95.5% (business). Next highest was Thursday, July 16, at 92.8% and 94.1% — a week that spans the Yoiyama evenings of the Gion Matsuri Saki Matsuri (July 14–16) through the Yamahoko Junko procession on Friday, July 17 (Kyoto City Official Travel Guide, Kyoto Kanko Navi).
Levelled out by day of week, city hotels range from 83.4% on Monday to 90.9% on Saturday, a spread of 7.5 points. Business hotels bottom out at 75.2% on Monday and peak at 89.3% on both Thursday and Saturday, widening the spread to 14.1 points. Business hotels clearly slacken in the first half of the week while Thursday builds to the same level as Saturday. Thursday topping the week is not unique to Kyoto: the same shape appears in the business-hotel markets of Aichi and Hiroshima, where the Sunday trough runs 7.1 and 8.5 points below the weekly average and Thursday takes the peak.
July 2026, Kyoto / Source: MetroEngines Research; compiled by the HotelBank Editorial Team
Total demand held at a high level, yet final estimated settled ADR came in below the same month a year earlier. When volume is there, what matters is less the price itself than the reason a property gets chosen within its price band. The review distribution at the top of this article is the yardstick for auditing that reason.
Folding rate and occupancy into one yardstick — unit conversion to estimated RevPAR equivalent
So far price (estimated settled ADR) and demand (estimated occupancy) have been treated as separate cross-sections. The two fold into a single figure through the identity estimated RevPAR equivalent = estimated settled ADR × estimated occupancy. What follows adds no new measurement: it is a unit conversion of the July 2026 figures already presented above into a daily revenue level per room, and it does not forecast future revenue. Because estimated occupancy is based on OTA-listed inventory and therefore reads higher than true room occupancy, treat it as an indicator for relative comparison between property types and between days of the week rather than as an absolute level.
| Cross-section | City — estimated occupancy | City — estimated RevPAR equivalent | Business — estimated occupancy | Business — estimated RevPAR equivalent |
|---|---|---|---|---|
| Monday (weekly trough) | 83.4% | ¥14,528 | 75.2% | ¥7,693 |
| Monthly average | 86.2% | ¥15,016 | 83.5% | ¥8,542 |
| Saturday (weekly peak) | 90.9% | ¥15,835 | 89.3% | ¥9,135 |
On the monthly-average cross-section for July 2026, city hotels come to ¥15,016 and business hotels to ¥8,542. The swing across days of the week is ¥1,307 for city hotels (¥14,528 on Monday to ¥15,835 on Saturday) and ¥1,442 for business hotels (¥7,693 to ¥9,135). Rates themselves differ by a factor of 1.70, yet the monetary swing across the week is 1.10 times larger at business hotels. The room to accumulate through day-of-week rate design sits with the type that has the wider swing, not the type with the higher rate.
| City hotels estimated settled ADR \ estimated occupancy | 83.4% | 86.2% | 90.9% | 92.8% | 94.7% |
|---|---|---|---|---|---|
| ¥17,420 | ¥14,528 | ¥15,016 | ¥15,835 | ¥16,166 | ¥16,497 |
| ¥18,660 | ¥15,562 | ¥16,085 | ¥16,962 | ¥17,316 | ¥17,671 |
| ¥23,971 | ¥19,992 | ¥20,663 | ¥21,790 | ¥22,245 | ¥22,701 |
| ¥26,774 | ¥22,330 | ¥23,079 | ¥24,338 | ¥24,846 | ¥25,355 |
| ¥29,986 | ¥25,008 | ¥25,848 | ¥27,257 | ¥27,827 | ¥28,397 |
| Business hotels estimated settled ADR \ estimated occupancy | 75.2% | 83.5% | 89.3% | 94.1% | 95.5% |
|---|---|---|---|---|---|
| ¥9,616 | ¥7,231 | ¥8,029 | ¥8,587 | ¥9,049 | ¥9,183 |
| ¥10,230 | ¥7,693 | ¥8,542 | ¥9,135 | ¥9,626 | ¥9,770 |
| ¥12,265 | ¥9,223 | ¥10,241 | ¥10,953 | ¥11,541 | ¥11,713 |
| ¥15,812 | ¥11,891 | ¥13,203 | ¥14,120 | ¥14,879 | ¥15,100 |
| ¥20,308 | ¥15,272 | ¥16,957 | ¥18,135 | ¥19,110 | ¥19,394 |
The grids show the range into which estimated RevPAR equivalent falls when the estimated settled ADR and estimated occupancy levels observed in this article are combined. City hotels move ¥12,566 in estimated settled ADR — from ¥29,986 in April to ¥17,420 in July — while their observed estimated occupancy spans only 83.4% to 94.7% (July 2026). For this property type, the main driver of estimated RevPAR equivalent is rate, not occupancy, and that shows in how much further the grid stretches vertically than horizontally.
Applying the same identity to the year-on-year comparison shows whether occupancy can absorb a rate shortfall. City hotels were down 16.8% year on year in July 2026, so restoring the prior year’s estimated RevPAR equivalent through occupancy alone would require 86.2% × 1/(1−0.168) = 103.6% — above 100%, and therefore unreachable. Business hotels were down 13.0%, putting the required level at 96.0%, or +12.5 points from the 83.5% monthly average (July 2026) — very nearly the whole of the 14.1-point day-of-week spread shown above. Turn it around and closing the gap on rate alone, at unchanged occupancy, would take an increase of 20.2% for city hotels and 14.9% for business hotels. Neither route carries the load on its own, which is precisely why a non-price yardstick — where your property sits in the review distribution — is needed.
For revenue managers running city and business hotels in Kyoto — implications and an action plan
1. In Kyoto, “the weakest category” and “the most dispersed category” are the same place. Bathroom has the lowest average of the 10 at 4.002 and, at the same time, the widest interquartile range at 0.738 points (first quartile 3.660 to third quartile 4.398). Look only at the average and conclude “everyone is low here, nothing to be done,” and you miss which side of a 0.7-point gap your property actually falls on. Location, conversely, averages a high 4.430 but spans only 0.499 — a category in which relative differentiation is hard to achieve.
2. Hold the benchmark line separately by property type. The Bathroom average is 3.754 at business hotels, 4.043 at city hotels and 4.214 at ryokan. Target the prefecture-wide 4.002 and a business hotel adopts a standard above its reality while a ryokan adopts one below it. When judging whether your score belongs at the first quartile, the median or the third quartile, overlay the distribution for your own type — it makes the available moves easier to separate.
3. Match the rate-revision calendar to the shape of the year. On 2026 final figures, city hotels peak at ¥29,986 in April and bottom at ¥17,420 in July; business hotels peak at ¥20,308 in April and bottom at ¥9,616 in June. That allows a time allocation in which review-improvement work is pulled forward into the trough months and settings are tuned ahead of the peaks. Levels from August onward are current estimates, so treat them as a range on the assumption they will move.
4. Record July 2026 as the month when volume came through but rates fell below the prior year. Estimated OCC was 86.2% (city) and 83.5% (business), and the peak on Saturday, July 18 reached 94.7% and 95.5% — yet final estimated settled ADR was down 16.8% and 13.0% respectively. Checking your own results for that month against this sequence makes it easier to separate market-wide rate pressure from something specific to your property.
| Time horizon | Move | Decision trigger (figures from this article) | Objective |
|---|---|---|---|
| Today to this week | Overlay your 10 review categories on Kyoto’s quartiles | If Bathroom sits at or below the first quartile of 3.660, or Room at or below 4.058 | Confirm your standing in the category where properties differ most |
| Today to this week | Redraw the benchmark line by property type | If your Bathroom score is below 3.754 as a business hotel, or below 4.043 as a city hotel | Avoid conflating your target with the prefecture-wide 4.002 and set it within your own type |
| Within two weeks | Check your August–September settings against the market’s current estimates | If you remain well below ¥17,244 (August) and ¥19,118 (September) as a city hotel, or ¥10,244 and ¥12,265 as a business hotel | Size the gap. Estimates move, so treat the levels themselves as a range |
| Within two weeks | Audit inventory allocation and rate emphasis by day of week | If your own day-of-week operation is flat against the 14.1-point gap between Monday at 75.2% and Thursday/Saturday at 89.3% for business hotels | Room to prepare different moves for the slack days and the days that build |
| Looking to next month | Design the revision timing for the autumn peak | If the current October–November estimates of ¥29,445 and ¥34,202 (city) and ¥20,599 and ¥24,155 (business) mark a shift in level from the recent trough (July final: ¥17,420 / ¥10,230) | Bring the start of the revision forward and prepare a staged setting with room either side |
| Looking to next month | Decide the order of investment in review improvement | If your Bathroom score sits around the median of 4.000 and the gap to the third quartile of 4.398 is widening | Start with the categories that have wide interquartile ranges and place the narrow ones (Amenities 0.414, Location 0.499) later |
Source: MetroEngines Research; compiled by the HotelBank Editorial Team
Conclusion — three yardsticks for Kyoto
First, read reviews by position in the distribution, not by the average. In Kyoto, Bathroom is last at an average of 4.002 and widest at an interquartile range of 0.738 points. What changes the move available to you is not whether you clear the average but whether you sit nearer the first quartile of 3.660 or the third quartile of 4.398.
Second, hold the benchmark line by property type. The same Bathroom category runs 3.754 at business hotels, 4.043 at city hotels and 4.214 at ryokan — a 0.460-point gap. A single prefecture-wide line is too high for some types and too low for others.
Third, read price by the shape of the year and demand by the day of the week. On 2026 final figures, city hotels peak at ¥29,986 in April and trough at ¥17,420 in July; business hotels peak at ¥20,308 in April and trough at ¥9,616 in June. Estimated OCC in July was high at 86.2% (city) and 83.5% (business), with a 14.1-point day-of-week spread at business hotels. When volume and rate move in opposite directions, line up these three and refresh your position every month.
About the Data
| Definition of estimated OCC | Occupancy on an OTA-listed inventory basis = 100 − 100 × rooms still listed on OTAs ÷ total rooms. It is an estimate based on how listed inventory sells through and is defined differently from true room occupancy (it reads higher). This article covers July 2026 in Kyoto, aggregating 55–56 observed properties across 30 days for city hotels and 285–293 observed properties across 29 days for business hotels. |
| Observation window | Based on observations from 45 days before the stay date through the most recent reading. |
| Definition of estimated settled ADR | A settled price level (tax-exclusive equivalent) inferred from OTA and other sales data (lowest-plan level × property-type coefficient, ensembled across multiple channels). Past months are final; the current and future months are estimates based on current sales conditions. Median error against published operating results is 6.6%. |
| Aggregation of guest reviews | The distribution of property-level scores (average, first quartile, median, third quartile) from reviews posted about accommodations in Kyoto over the last 24 months. Because the set of properties scored differs by category, the number of properties and the number of reviews are stated alongside each figure. Score levels also shift with the mix of reviews posted, so comparisons between properties are made within the same category and the same property type. |
| Breakdown of N | Guest reviews (Kyoto overall): Bathroom 319 properties / 38,231 reviews; Facilities 333 / 35,859; Room 610 / 97,784; Service 602 / 90,243; Breakfast 267 / 16,959; Cleanliness 396 / 39,355; Meals 219 / 17,723; Amenities 175 / 8,863; Location 578 / 87,662; Staff 336 / 27,017 (459,696 reviews across the 10 categories). Estimated settled ADR (July 2026 final): city hotels N=58 properties, business hotels N=325 properties, ryokan N=203 properties. |
| Data as of | Data as of August 7, 2026. Sales conditions and inventory change daily, so the figures in this article are a snapshot at the time of retrieval. |
Source: MetroEngines Research; compiled by the HotelBank Editorial Team
References and Sources
Gion Matsuri Yamahoko Junko (Saki Matsuri and Ato Matsuri) | Kyoto City Official Travel Guide, Kyoto Kanko Navi
Kyoto Gion Matsuri 2026: Saki Matsuri Yoiyama, July 14–16 | Kyoto Travel Guide
■ Data sources
Guest-review scores come from the Kyoto area baseline (last 24 months, 10 categories, 175–610 properties depending on the category, 459,696 reviews in total). Benchmark lines by property type break that same baseline into city hotels, business hotels and ryokan. Estimated settled ADR is the monthly series for Kyoto by property type (January 2025 to December 2026; the July 2026 final figure covers city N=58 properties, business N=325 properties and ryokan N=203 properties, while August 2026 onward covers city N=57–58 properties and business N=284–315 properties). Estimated occupancy is the daily series for Kyoto in July 2026 (55–56 observed properties for city hotels, 285–293 for business hotels). Gion Matsuri dates are from the Kyoto City Official Travel Guide, Kyoto Kanko Navi.
■ Calculation assumptions
Because the number of properties and reviews differs by review category, averages are compared only within the same category, and the interquartile range is used for comparisons across categories. Day-of-week and monthly-average estimated occupancy figures aggregate 30 days for city hotels and 29 days for business hotels, excluding days with markedly low observation coverage (one day for city, two for business). Estimated RevPAR equivalent is a unit conversion under the identity “estimated settled ADR × estimated occupancy” and is not a forecast of future revenue. Both axes of the three-cross-section table and the sensitivity grids use only levels actually observed in the article; no extrapolation beyond that range has been applied. The occupancy and rate levels required to restore the prior year are derived solely from the year-on-year figures stated in the article (city −16.8%, business −13.0%).
■ Limitations and caveats
Review scores skew with the language a review is written in and with the size of the base, so they need to be treated as a position within a distribution rather than as a standalone ranking. Estimated settled ADR carries a median error of 6.6% against published operating results (tax-exclusive equivalent), and figures from August 2026 onward are estimates based on current sales conditions that may shift as selling progresses. Estimated occupancy is based on OTA-listed inventory and therefore reads higher than true room occupancy; it also moves slightly after publication as observations accumulate (this article is a snapshot as of August 7, 2026). Placing reviews and price side by side presents two cross-sections of the same market and does not demonstrate a causal relationship between them.
Related reading
- Kyoto Hotel ADR Falls YoY in June 2026: City −14.6%, Business −9.8%
- A 4.1 Review Score Is Average, Not a Strength: Sapporo Price Position
- Kyoto Obon 2026 Booking Curves: Ryokan Add the Most Close In, +11.4pt
- Self-Select Amenities: 39 Japan Hotels, 96% Positive Mentions
- Policy Rate 1.00%: Break-Even ADR Across Japan’s 8 Hotel Markets