

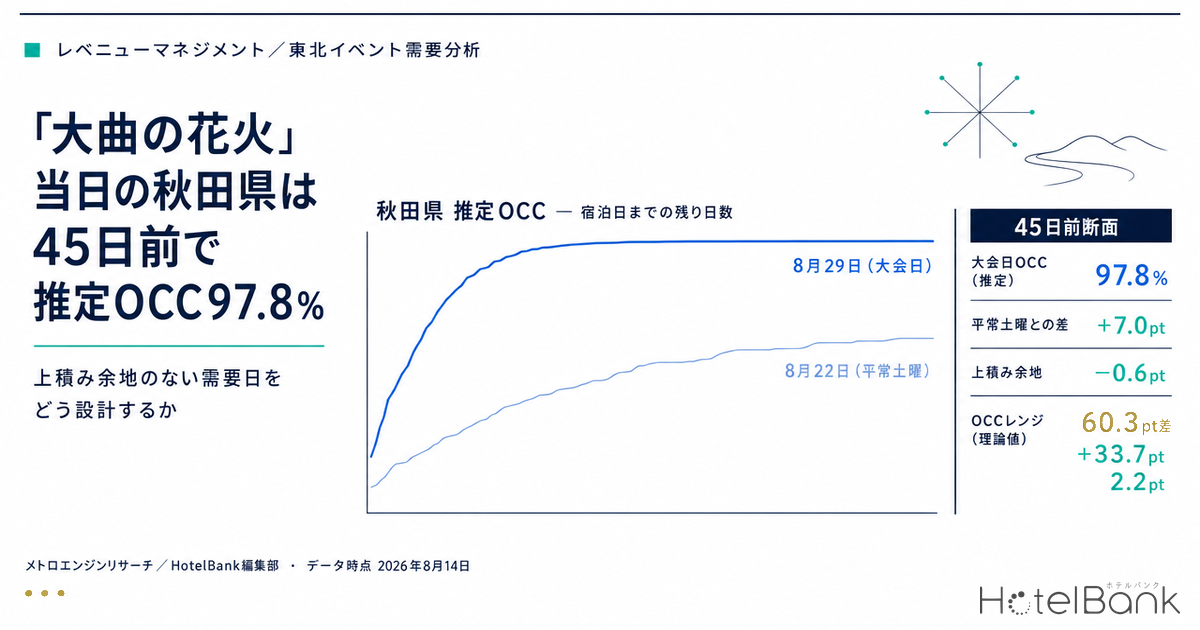
The 98th National Fireworks Competition, known as the Omagari Fireworks (大曲の花火), takes place on Saturday, 29 August 2026. For that stay date, the estimated OCC (OTA-listed inventory basis) across Akita Prefecture had already reached 97.8% when observed 45 days out. At the most recent observation (16 days out) it was 97.2%, meaning the swing from 45 days out to the latest reading was just −0.6pt. By contrast, 22 August — a normal Saturday in the same month — moved from 74.2% at 45 days out to 81.2% at 16 days out, a gain of +7.0pt. In other words, the event day is a date on which the usual booking curve of “selling inside the final 45 days” structurally does not exist. This article uses Akita’s lodging inventory data to break that singular day down by property type and by city, and to examine how to design for a demand day with no headroom left.
Scope: all lodging properties in Akita Prefecture, N=205 properties (29 August 2026 cross-section) / N=203 properties (22 August cross-section). Occupancy figures in this article are estimates based on OTA-listed inventory (estimated OCC); price metrics are not covered. Definitions are given at the end of the article. Data as of 14 August 2026.
- — Estimated OCC for the event day, 29 August, went from 97.8% at 45 days out to 97.2% at 16 days out — a change of −0.6pt. The “build-up stretch” worth +7.0pt that the normal Saturday of 22 August accumulates over the same window simply does not exist on this date.
- — On the 30-days-out cross-section, the sellout rate was 81.0% on the event day versus 20.7% on the normal Saturday — a 60.3pt gap. That is roughly three times the 20.9pt gap in estimated OCC, so tracking occupancy volume alone misses the shift in the competitive environment.
- — By property type, the gaps are +73.3pt for city hotels, +71.1pt for business hotels and +56.5pt for ryokan. The lower a segment’s normal-Saturday baseline, the deeper the fault line against the event day.
- — Semboku City, well away from the venue, hit 99.7% — above Daisen City’s 98.6%, where the venue sits — and its lift of +33.7pt was the largest of the four cities. Demand does not stay inside the venue catchment; it absorbs inventory across the prefecture almost uniformly.
- — At 97.8% 45 days out, the headroom left is only 2.2pt — arithmetically able to absorb just 31% of the market’s normal +7.0pt of pickup. The dividing line sits at 93.0% at 45 days out.
Ceiling at 45 Days Out — The Event Day’s Booking Curve Never Builds
First, a word on the event itself. The 98th National Fireworks Competition, the Omagari Fireworks, is held on Saturday, 29 August 2026 on the banks of the Omono River in Omagari, Daisen City, Akita Prefecture (the “Omagari Fireworks” park), with daytime fireworks from 17:10 to 18:00, night fireworks from 19:00 to 21:30 and roughly 18,000 shells launched (sources listed at the end of the article). It falls on the last Saturday of August, and the normal Saturday immediately preceding it is 22 August. The booking curve below places those two dates side by side over an identical observation window (45 days to 16 days before the stay date).
The difference in shape is unmistakable. On 29 August the level is already 97.8% at 45 days out and then moves flat within a 97.2%–98.1% band. There is no slope worth calling a curve. On 22 August, by contrast, the line climbs gently from 74.2% to 81.2%. What revenue management practice calls “the build-up over the remaining 45 days” is absent from the outset on the event day. For an analysis of the same event day from a different observation cross-section, see also 94.5% Sold 45 Days Out: Omagari Fireworks vs a Normal Akita Weekend.
Source: compiled by MetroEngines Research and the HotelBank Editorial Team / all property types in Akita Prefecture; observed-property range 74–204 properties for 29 August and 172–202 properties for 22 August (including the latest observation column)
To test whether this failure to build is specific to the event day, we calculated the difference in estimated OCC between 45 days out and 16 days out (the pickup) for all four Saturdays in August on the same basis. The level for 8 August is high in its own right because it runs into the start of the Obon period, and 15 August sits at roughly the same level as a normal Saturday — yet the pickup for both lands in the +7pt range, strikingly consistent. Saturdays in Akita are, under normal conditions, a market that accumulates around 7pt over the final 45 days. Against that backdrop, only 29 August stands alone at −0.6pt. The pattern of a festival date being settled by 45 days out is not unique to Akita: Yamagata Hanagasa 2026: Demand Settled 45 Days Out, +9.6pt vs Normal confirms the same shape in a day-of-week-matched comparison.
| Stay date (Saturday) | Estimated OCC, 45 days out | Estimated OCC, 16 days out | Pickup | Observed-property range |
|---|---|---|---|---|
| 8 August | 85.8% | 93.1% | +7.3pt | 38–167 properties |
| 15 August | 72.4% | 79.6% | +7.2pt | 15–201 properties |
| 22 August (normal Saturday) | 74.2% | 81.2% | +7.0pt | 172–202 properties |
| 29 August (event day) | 97.8% | 97.2% | −0.6pt | 74–204 properties |
Source: compiled by MetroEngines Research and the HotelBank Editorial Team / all property types in Akita Prefecture; all figures based on observations from 45 days to 16 days before the stay date
Note that the observed-property count for 29 August is thin around the 45-days-out mark at 74–96 properties, thickening to roughly 200 properties from 30 days out. The fact that estimated OCC stayed around 97.8% even as the observed population more than doubled and turned over indicates that this level is not an artefact of a skewed subset of properties. The comparisons that follow therefore centre on the 30-days-out cross-section, where the observed-property count is thick for both dates.
Up to a 73pt Sellout-Rate Gap — The Event Day by Property Type
Because estimated OCC is an inventory-volume metric, it reflects how many rooms remain but not how many properties have sold out. The companion measure is the sellout rate — the estimated share of properties for which no listed inventory can be confirmed on OTAs and similar channels. Taking the 30-days-out cross-section by property type, the gap between the event day and the normal Saturday opens far wider than estimated OCC alone suggests.
Source: compiled by MetroEngines Research and the HotelBank Editorial Team / Akita Prefecture, 30-days-out cross-section before the stay date
Across all property types, the sellout rate was 81.0% on 29 August against 20.7% on 22 August — a gap of 60.3pt. By segment the contrast is starker still: business hotels stood at 82.4% versus 11.3% (+71.1pt) and city hotels at 80.0% versus 6.7% (+73.3pt). On a normal Saturday only about one in ten business and city hotels has sold out, whereas on the event day eight in ten show no confirmable listed inventory. Ryokan came in at 75.0% versus 18.5% (+56.5pt) — a relatively smaller gap, but a high level in absolute terms.
| Property type | 29 Aug, 45 days out OCC / sellout |
29 Aug, 30 days out OCC / sellout |
29 Aug, latest 16 days out OCC / sellout |
22 Aug, 30 days out OCC / sellout |
Observed-property range 29 Aug / 22 Aug |
|---|---|---|---|---|---|
| All property types | 97.8% / 82.4% | 97.8% / 81.0% | 97.2% / 75.6% | 76.9% / 20.7% | 74–204 / 172–202 |
| Business hotels | 98.8% / 88.2% | 98.7% / 82.4% | 97.7% / 72.5% | 78.3% / 11.3% | 21–51 / 50–52 |
| City hotels | 98.6% / 80.0% | 98.6% / 80.0% | 99.1% / 80.0% | 77.5% / 6.7% | 5–15 / 14–15 |
| Ryokan | 95.0% / 72.5% | 95.7% / 75.0% | 94.8% / 71.2% | 75.1% / 18.5% | 35–79 / 71–81 |
Source: compiled by MetroEngines Research and the HotelBank Editorial Team / “sold out” = no listed inventory confirmable on OTAs and similar channels (estimated). The 45-days-out figure for city hotels rests on just 5 observed properties and should be treated as indicative
What stands out in the table is that, regardless of property type, the numbers barely move between 45 days out and 30 days out. For city hotels the sellout rate is flat at 80.0% across all three points — 45 days out, 30 days out and the latest reading at 16 days out (though the 45-days-out figure rests on a thin 5 observed properties and is indicative only). For business hotels the sellout rate declines from 88.2% to 82.4% to 72.5% as the stay date approaches, which means inventory is coming back — late cancellations or additional releases are being observed. If anything on the event day is “moving,” it is this final stretch.
The Demand Ring Extends Far Beyond Daisen City, Where the Venue Sits
Prefecture-level aggregation tends to dilute the demand lift generated by a municipal-level event. We therefore re-ran estimated OCC and sellout rate on the same 30-days-out cross-section for Daisen City, home to the venue, plus the prefectural capital Akita City and the neighbouring cities of Yokote and Semboku. The result shows that the prefecture-level figures were not being diluted at all.
Source: compiled by MetroEngines Research and the HotelBank Editorial Team / 30-days-out cross-section before the stay date
| City | 29 Aug estimated OCC | 29 Aug sellout rate | 22 Aug estimated OCC | 22 Aug sellout rate | Observed-property range 29 Aug / 22 Aug |
|---|---|---|---|---|---|
| Daisen City (venue location) | 98.6% | 92.3% | 79.6% | 7.7% | 2–13 / 11–13 |
| Akita City | 99.8% | 96.7% | 77.6% | 16.1% | 5–30 / 29–31 |
| Yokote City | 100.0% | 100.0% | 85.9% | 33.3% | 1–14 / 10–12 |
| Semboku City | 99.7% | 94.3% | 66.0% | 22.2% | 7–35 / 30–36 |
Source: compiled by MetroEngines Research and the HotelBank Editorial Team / observed-property ranges span the window from 45 days before the stay date to the latest observation (including the latest observation column)
All four cities are pinned at estimated OCC of 98.6% or above as of 30 days out (observed 30 July 2026, 30-days-out cross-section before the stay date). Semboku City, far from the venue, is a market that sits below the prefectural average on a normal Saturday at 66.0% — yet on the event day it is pushed up to 99.7%, a lift of +33.7pt, the largest of the four cities. In short, demand does not fit inside Daisen City, where the venue sits; it absorbs lodging inventory across the prefecture almost uniformly. The 97.8% recorded at the prefectural level was therefore not the product of aggregation smoothing, but a reflection of the entire prefecture genuinely being in the same state. For a different case study of event demand landing outside the venue catchment, SHINE UP FES 2026: Tottori’s Demand Peak Sat 100km From the Venue digs into the phenomenon.
For reference, the monthly average estimated OCC for Akita Prefecture in July 2026 (a completed month) was 90.4%, with the Saturday average at 94.5% (4 days). The event day’s 97.8% therefore sits above the typical level of the prefecture’s strongest day of the week.
Headroom Is Decided by Arithmetic — A Grid of 45-Days-Out Level × Pickup
Let us organise the cross-sections above into a form usable for revenue management decisions. Because estimated OCC can never exceed 100%, the higher the level at 45 days out, the arithmetically narrower the room to add afterwards. A single quantity — headroom (= 100 − estimated OCC at 45 days out) — explains every observation in this article. What follows is not a forecast; it is the fitting of values actually observed here.
First, for the three 45-days-out levels observed in the text, we line up the headroom against the +7.0pt that a normal Saturday in Akita actually accumulated (22 August, 45 days out → 16 days out) and ask whether that gain is arithmetically feasible.
| Case | Estimated OCC, 45 days out | Headroom (100 − level) |
Can it arithmetically absorb the normal Saturday’s +7.0pt? |
Resulting level if +7.0pt applied |
Actual reading at 16 days out, same date |
|---|---|---|---|---|---|
| Pessimistic 15 August, all property types | 72.4% | 27.6pt | Yes (headroom is 3.9× the +7.0pt) | 79.4% | 79.6% |
| Mid 8 August, all property types | 85.8% | 14.2pt | Yes (headroom is 2.0× the +7.0pt) | 92.8% | 93.1% |
| Optimistic 29 August, all property types (event day) | 97.8% | 2.2pt | No (headroom is 31% of the +7.0pt) | 104.8% arithmetically impossible | 97.2% |
Source: compiled by MetroEngines Research and the HotelBank Editorial Team / both the 45-days-out and 16-days-out figures are the observed values from Table 1 in the text. The +7.0pt is the observed pickup for 22 August (normal Saturday)
The dividing line is clear: the highest 45-days-out level at which the normal Saturday’s +7.0pt remains arithmetically feasible is 93.0%. Above that, a date cannot receive the full gain the market normally accumulates. The event day’s 2.2pt of headroom is only 31% of +7.0pt, so the observed pickup of −0.6pt is more accurately read not as “little was left unsold” but as there being no vessel to hold anything in the first place. Compared with the pessimistic case of 15 August (27.6pt of headroom), the size of that vessel differs by a factor of 12.5.
Next, we take the 45-days-out level and the pickup as two axes and lay out the resulting level (the sum of the two) in a 5×5 grid. The vertical axis uses the five 45-days-out levels observed in the text; the horizontal axis divides the observed pickup range from the text (−0.6pt to +7.3pt) into five equal steps. Both therefore sit inside this article’s observed range. Shaded cells are combinations whose sum exceeds 100% and are arithmetically impossible.
| Estimated OCC 45 days out \ pickup | −0.6pt | +1.4pt | +3.4pt | +5.3pt | +7.3pt |
|---|---|---|---|---|---|
| 72.4% 15 August, all property types | 71.8% | 73.8% | 75.8% | 77.7% | 79.7% |
| 74.2% 22 August, all property types | 73.6% | 75.6% | 77.6% | 79.5% | 81.5% |
| 85.8% 8 August, all property types | 85.2% | 87.2% | 89.2% | 91.1% | 93.1% |
| 95.0% 29 August, ryokan | 94.4% | 96.4% | 98.4% | 100.3% impossible | 102.3% impossible |
| 97.8% 29 August, all property types | 97.2% | 99.2% | 101.2% impossible | 103.1% impossible | 105.1% impossible |
Source: compiled by MetroEngines Research and the HotelBank Editorial Team / both axes use values observed in the text. The −0.6pt is the observed pickup for 29 August and the +7.3pt that for 8 August
There are two ways to read the grid. First, 5 of the 25 cells are arithmetically impossible — and all of them sit in the top two rows (45-days-out levels of 95.0% and above). Second, two cells on the diagonal reproduce the observed values: the −0.6pt column of the 97.8% row gives 97.2%, matching the event day’s latest reading, and the +7.3pt column of the 85.8% row gives 93.1%, matching the latest reading for 8 August. The grid is therefore not a product of assumptions; it contains the observed combinations in their proper positions.
The practical implication runs as follows. If progress on your own property’s target date is above 93.0% at 45 days out, that date is no longer a day on which you build. Instead of a build-up plan, resources are better directed at two things: (1) bringing decisions forward to earlier than 45 days out, and (2) going after the return of inventory in the final stretch. The former is a matter of design for next year and beyond; the latter concerns the remaining 16 days of this year.
For Revenue Managers Running Hotels and Ryokan in Akita — Implications and an Action Plan
(a) Operational insights
1. This date is decided well before 45 days out. A normal Saturday in Akita accumulates +7.0pt of estimated OCC between 45 days out and 16 days out (22 August). Over the same window, the event day moves −0.6pt. Viewing your own booking pace for this date on the premise that “there are still 45 days to build” does not match the market’s actual shape. Conversely, for comparable event days in future years, the pivot is whether you can move decision-making and inventory design to earlier than 45 days out.
2. Viewed through sellout rate rather than estimated OCC, the gap widens threefold. On the 30-days-out cross-section across all property types, the sellout-rate gap opens to 60.3pt while the estimated OCC gap stops at 20.9pt. Tracking only the volume of remaining occupancy means missing the change in the competitive environment — how many properties around you have already sold out. There is a case for holding the inventory-volume metric and the “have my competitors sold out?” metric separately in your pace reviews.
3. The size of the gap versus a normal Saturday varies by property type. Sellout-rate gaps run +73.3pt for city hotels, +71.1pt for business hotels and +56.5pt for ryokan. The more accommodation-led the segment, the larger the gap; because normal-Saturday levels are low (business hotels 11.3%, city hotels 6.7%), designing event days as an extension of ordinary days produces a wide divergence. Ryokan start from a higher base at 18.5% on a normal Saturday, so their gap is relatively smaller.
4. Do not draw the demand ring by proximity to the venue. On the 30-days-out cross-section, Daisen City stood at 98.6%, Akita City 99.8%, Yokote City 100.0% and Semboku City 99.7% — no meaningful difference in level, including cities far from the venue. Semboku City posted the largest lift, +33.7pt from a normal-Saturday 66.0%. The premise that “we are far from the venue, so this does not concern us” does not hold, at least for the prefecture’s inventory on this date.
5. Inventory comes back in the final stretch. The sellout rate for business hotels declines from 88.2% at 45 days out to 82.4% at 30 days out to 72.5% at the latest reading 16 days out. Cancellations and additional releases are creating openings close to the stay date, so there is a case for treating this stretch not as “after the sellout” but as a phase in which you sell again.
Translated into a practical timeline, the above looks as follows. Every decision trigger is tied to a figure presented in this article.
| Time horizon | Action | Decision trigger | Objective |
|---|---|---|---|
| Today to this week | Review your remaining allocation for 29 August and your capacity to receive returning cancellations (reopening inventory you had stopped selling) | If the market’s sellout rate on the latest 16-days-out cross-section — 75.6% across all property types and 72.5% for business hotels — is below its 45-days-out level, i.e. inventory is coming back | Avoid missing the “resell after selling out” opportunity |
| Today to this week | Check the availability position for the surrounding dates (Friday 28 August and Sunday 30 August) together with the event day | If your own 29 August is close to the market level (observed 13 August 2026, latest 16-days-out cross-section: estimated OCC 97.2%, sellout rate 75.6%) while the surrounding dates remain open | Establish how much single-day overflow demand can be redirected to adjacent dates |
| Within two weeks | Keep a record of the event day’s outcome (final occupancy, number of cancellations, when the bookings came in) | If you have not yet matched the fact that the market was already at an estimated OCC of 97.8% at 45 days out (observed 15 July 2026) against the timing of your own booking intake | Secure next year’s decision inputs as a record rather than a memory |
| Within two weeks | Add “sellout rate in the surrounding market” to your pace-monitoring metrics and track it separately from occupancy | If the divergence on the 30-days-out cross-section — a 20.9pt gap in estimated OCC against a 60.3pt gap in sellout rate — is not visible in your own review materials | Avoid misreading the competitive environment from occupancy alone |
| Looking to next month | For comparable event days next year, reset the milestones for decisions and inventory design to earlier than 45 days out | If you take account of the difference in shape — a normal Saturday accumulating +7.0pt from 45 days out while the event day moved −0.6pt over the same stretch | Stop making decisions retroactively on days that have no build-up period |
| Looking to next month | Redefine your property’s demand catchment on the basis of actual data rather than distance from the venue | If you had classified your property as “outside the venue catchment” despite Semboku City moving from 66.0% on a normal Saturday to 99.7% on the event day (+33.7pt) | Avoid overlooking demand days you can capture even from a remote location |
Source: compiled by MetroEngines Research and the HotelBank Editorial Team
Summary — Three Yardsticks for Measuring a Day With No Headroom
Three yardsticks emerge from Akita Prefecture on the day of the Omagari Fireworks that transfer to other demand days.
Yardstick 1: pickup. Take the difference in estimated OCC between 45 days out and the latest observation. Normal Saturdays in Akita cluster at +7.0 to +7.3pt, and that is this market’s “ordinary slope.” If a target date falls well below it, that date is not one to sell within the final 45 days but one to design around selling out before them.
Yardstick 2: the divergence between estimated OCC and sellout rate. On the 30-days-out cross-section the estimated OCC gap stopped at 20.9pt while the sellout-rate gap reached 60.3pt. An inventory-volume metric alone reveals only a third of the change in the competitive environment. Always hold the two metrics as a pair.
Yardstick 3: the geographic spread of the lift. Semboku City (+33.7pt), where the normal-Saturday level is low, showed a larger lift than Daisen City (+19.0pt), where the venue is located. The benefit of event demand is determined partly not by distance from the venue but by how low the ordinary level is and by the absolute volume of inventory. Whether your property is “outside the ring” is a question to settle with data, not distance.
About the Data
• Definition of estimated OCC: occupancy on an OTA-listed inventory basis = 100 − 100 × rooms still listed on OTAs ÷ total rooms. It is an estimate based on how listed inventory is being consumed and differs in definition from actual room occupancy (it reads higher). The target month for this article is August 2026, and the observation window runs from 45 days before each stay date to the latest reading.
• Booking curve: based on observations from 45 days before the stay date to the latest reading.
• Sellout rate: the estimated share of properties for which no listed inventory can be confirmed on OTAs and similar channels for the target date. It does not necessarily correspond exactly to being genuinely full.
• This article is built solely on occupancy-related metrics (estimated OCC and sellout rate) and does not cover price metrics (estimated settled ADR).
• Breakdown of N: all property types in Akita Prefecture, N=205 properties (29 August cross-section) / N=203 properties (22 August cross-section). By property type (property counts for the 29 August / 22 August cross-sections): business hotels N=51/53, city hotels N=15/15, ryokan N=80/81. By city (29 August / 22 August cross-sections): Daisen City N=13/13, Akita City N=30/31, Yokote City N=14/12, Semboku City N=35/36. Observed-property ranges for each cross-section are noted alongside the charts and tables.
• Data as of 14 August 2026. Because sales conditions and inventory change daily, the figures in this article are a snapshot at the time of retrieval.
References and Sources
■ Data source
OTA-listed inventory data from MetroEngines Research. Akita Prefecture, N=205 properties (29 August 2026 cross-section) / N=203 properties (22 August cross-section). Uses the booking curve from 45 days before the stay date to the latest observation (16 days out, observed 13 August 2026), together with cross-sections by property type (business hotels, city hotels, ryokan) and for four cities in the prefecture (Daisen, Akita, Yokote and Semboku). The monthly estimated OCC for July 2026 (monthly average 90.4%, Saturday average 94.5% across 4 days) is for a completed month. Data retrieved as of 14 August 2026.
■ Calculation assumptions
Estimated OCC = 100 − 100 × rooms still listed on OTAs ÷ total rooms. Pickup = estimated OCC at the latest observation (16 days out) − estimated OCC at 45 days out. Lift = event day − normal Saturday (difference on the same cross-section). Headroom = 100 − estimated OCC at 45 days out. Tables 5 and 6 are a fitting of values observed in this article and are not forecasts. The vertical axis of Table 6 uses the five 45-days-out levels observed in the text and the horizontal axis divides the observed pickup range from the text (−0.6pt to +7.3pt) into five equal steps; neither extrapolates outside the observed range. Cells are the simple sum of the two axes, and combinations above 100% are shaded as arithmetically impossible.
■ Limitations and caveats
Estimated OCC is an estimate on an OTA-listed inventory basis and differs in definition from actual room occupancy (it reads higher). The sellout rate is the estimated share of properties for which no listed inventory can be confirmed on OTAs and similar channels, and does not necessarily correspond to being genuinely full. Observed-property counts vary by cross-section, and for 29 August the count is thin around the 45-days-out mark at 74–96 properties. Cross-sections with thin observation — city hotels at 45 days out (5 properties) and Yokote City at 45 days out (1 property) — should be treated as indicative. This article is built solely on occupancy-related metrics and does not cover price metrics (estimated settled ADR). Because inventory changes daily, the figures are a snapshot at the time of retrieval.
• National Fireworks Competition “Omagari Fireworks” official site
• 98th National Fireworks Competition “Omagari Fireworks” (Daisen City): schedule and event details | Fireworks Festivals 2026 – Walkerplus (date, venue, launch times and number of shells)
• 98th National Fireworks Competition | Museum of Fireworks Heritage
• [Daisen City] The National Fireworks Competition (Omagari Fireworks) will be held on 29 August | Akitano
Further reading
- 94.5% Sold 45 Days Out: Omagari Fireworks vs a Normal Akita Weekend
- Aomori Nebuta 2026: 97.4% Sold 45 Days Out, Post-Festival +14pt
- Yamagata Hanagasa 2026: Demand Settled 45 Days Out, +9.6pt vs Normal
- SHINE UP FES 2026: Tottori’s Demand Peak Sat 100km From the Venue
- North Tohoku’s 2,079 New Rooms: Which Segments Can Absorb the Supply
- Hyogo Booking Curves: 3.6x Pickup Gap, Ryokan Sellout Rate 28.4%
- Hokkaido City Hotels: Only Aug 15 Trails at 78.7% OCC, 45 Days Out