

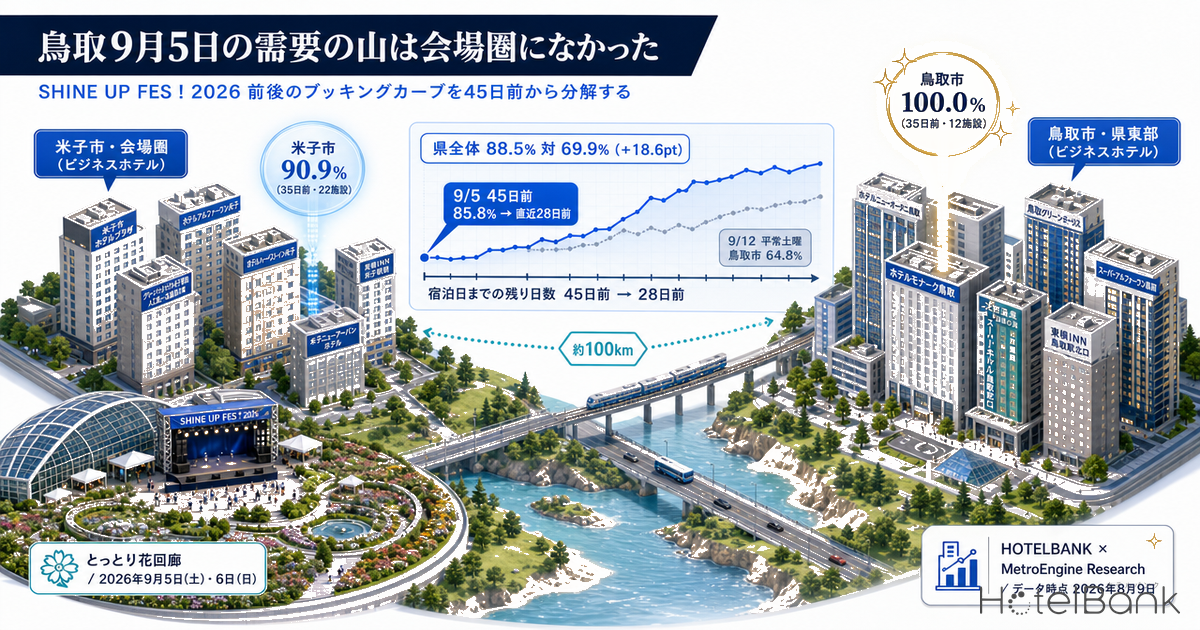
On Saturday 5 and Sunday 6 September 2026, SHINE UP FES!2026 will be held at Tottori Hanakairo (とっとり花回廊) in Nanbu Town, Saihaku District, Tottori Prefecture. As one of the largest outdoor music festivals in the prefecture, it was expected to ripple through local accommodation demand. Yet when we track lodging inventory across Tottori Prefecture from 45 days before the stay date, the demand peak on 5 September stood most sharply not in the venue area (Yonago City), but in the eastern part of the prefecture (Tottori City), roughly 100km from the venue. On a 35-days-out cross-section with the observed property counts aligned, estimated OCC for business hotels in Tottori City was 100.0% for 5 September (12 properties observed) versus 64.8% for the normal Saturday of 12 September (13 properties). On the same cross-section, Yonago City reached only 90.9% (22 properties) versus 78.8% (22 properties). This is a concrete case of how looking only at “the city that hosts the venue” leads to a misread when building an event-driven pricing strategy.
Scope: business hotels, city hotels and ryokan in Tottori Prefecture (prefecture-wide, plus Yonago City and Tottori City), N=8–186 properties (stated for each cross-section). The price metric in this article is estimated settled ADR (the transacted price level inferred from OTA and other sales data, on a pre-tax-equivalent basis); occupancy is an estimate based on OTA-listed inventory. Definitions for both appear at the end of the article. Data as of 9 August 2026 (latest observation 8 August 2026).
- — The eastern prefecture is sharper than the venue area — On a 35-days-out cross-section with property counts aligned, the gap between festival day one (5 September) and the normal Saturday of 12 September was +12.1pt in Yonago City, versus +35.2pt in Tottori City some 100km away.
- — It is decided by 45 days out — Business hotels in Tottori Prefecture went from estimated OCC 85.8% (stay date 5 September 2026, 45-days-out cross-section, N=39 properties) to 90.0% at the most recent 28-days-out reading (stay date 5 September 2026, N=45 properties) — an incremental gain of just +4.2pt.
- — The peak skews to day one — Day two, Sunday 6 September, moved from estimated OCC 73.4% (stay date 6 September 2026, 45-days-out cross-section, N=154 properties) to 73.2% at the most recent 29-days-out reading (stay date 6 September 2026, N=184 properties) — essentially flat.
- — Ryokan sit outside this demand — Prefecture-wide ryokan posted estimated OCC 66.7% (stay date 5 September 2026, 45-days-out cross-section, N=57 properties), only about 3pt above the normal Saturday. Their estimated settled ADR for July 2026 was also down 4.1% year on year.
- — A single strong day in a weak month — Business hotels in Tottori Prefecture show a seasonal shape that fell 8.9% from ¥6,301 in August 2025 to ¥5,742 in September 2025, so this one day stands in a month where price is hard to build.
At 45 days out, 5 September was already on a different level from a normal Saturday
Start with the prefecture-wide booking curve. The chart below shows the cumulative movement in estimated OCC (OTA-listed-inventory basis) for business hotels in Tottori Prefecture, from 45 days before the stay date to the most recent observation (28 days out for 5 September). Festival day one, Saturday 5 September, stood at 85.8% at 45 days out and 90.0% at the most recent 28-days-out reading. The normal Saturday of 12 September was at 67.1% at 45 days out and 69.9% at 35 days out. The gap between them already exceeded 18 points at the very first observation point, which shows that the outcome was settled earlier than 45 days out.
The second important point is that the incremental gain from 45 days out to the most recent reading is small. For 5 September, 85.8% at 45 days out to 90.0% at 28 days out is +4.2pt. For 12 September, 67.1% at 45 days out to 69.9% at 35 days out is +2.8pt. By comparison, Saturday 29 August — a nearer stay date — built from 69.0% at 45 days out to 76.3% at 21 days out, a gain of +7.3pt. In other words, 5 September is in a state where the room for late growth is structurally limited simply because so little inventory remains. The same structure — event-day demand formation finishing before the 45-day mark — can also be seen in our day-of-week-matched booking curve analysis of Yamagata Hanagasa 2026.
Source: MetroEngines Research; compiled by the HotelBank Editorial Team
Festival day two, Sunday 6 September, was at 73.4% at 45 days out and 73.2% at the most recent 29-days-out reading. The normal Sunday of 13 September was at 65.6% at 45 days out and 67.0% at 36 days out, so there is still a gap of around 8 points between the two Sundays. But it is not as sharp as day one: the peak skews to the first day. Even for a two-day event, this is the textbook pattern of lodging demand attaching to “the first day, which requires an overnight stay beforehand” — and here it appeared exactly as written.
The gap survives even when property counts are aligned — testing for population drift
The first thing to suspect in this kind of cross-section comparison is an apparent peak created by differences in the number of properties observed on each date (the population). And indeed, prefecture-wide across all property types, the 45-days-out cross-section for 5 September covered 144 properties, against 185 for 12 September — a difference of more than 40 properties. On dates with fewer observed properties, small properties holding no inventory drop out, which tends to push estimated OCC higher.
So we re-took the readings on cross-sections where the observed property counts nearly match. On the 35-days-out cross-section for business hotels, both 5 September and 12 September are covered by exactly 44 observed properties. Even under that condition, the figures are 88.5% versus 69.9% — a gap of +18.6pt. Yonago City, at 22 properties against 22, shows 90.9% versus 78.8% (+12.1pt); Tottori City, at 12 properties against 13, shows 100.0% versus 64.8% (+35.2pt). Prefecture-wide across all property types, the 35-days-out cross-section (166 properties against 182) still leaves +12.5pt, at 82.3% versus 69.8%. This is a gap that population drift cannot explain.
| Segment (Tottori Prefecture) | Stay date | 45 days out | 35 days out | Most recent observation |
|---|---|---|---|---|
| All property types | Sat 5 Sep — festival day 1 | 80.3% (144 properties) | 82.3% (166 properties) | 83.1% (186 properties, 28 days out) |
| All property types | Sun 6 Sep — festival day 2 | 71.6% (154 properties) | 72.1% (175 properties) | 72.1% (184 properties, 29 days out) |
| All property types | Sat 12 Sep — normal Saturday | 67.9% (185 properties) | 69.8% (182 properties) | 69.8% (182 properties, 35 days out) |
| Business hotels | Sat 5 Sep | 85.8% (39 properties) | 88.5% (44 properties) | 90.0% (45 properties, 28 days out) |
| Business hotels | Sat 12 Sep | 67.1% (44 properties) | 69.9% (44 properties) | 69.9% (44 properties, 35 days out) |
| City hotels | Sat 5 Sep | 93.3% (8 properties) | 94.4% (8 properties) | 96.8% (8 properties, 28 days out) |
| City hotels | Sat 12 Sep | 85.4% (8 properties) | 86.6% (8 properties) | 86.6% (8 properties, 35 days out) |
| Ryokan | Sat 5 Sep | 66.7% (57 properties) | 68.3% (56 properties) | 66.4% (70 properties, 28 days out) |
| Ryokan | Sat 12 Sep | 63.4% (71 properties) | 62.6% (69 properties) | 62.6% (69 properties, 35 days out) |
Source: MetroEngines Research; compiled by the HotelBank Editorial Team
The difference in response by property type is equally clear. City hotels (note the small base of 8 observed properties) were already close to the ceiling at 93.3% at 45 days out, reaching 96.8% at the most recent 28-days-out reading. Business hotels went from 85.8% at 45 days out to 90.0% most recently. Ryokan, by contrast, were essentially flat at 66.7% at 45 days out and 66.4% at 28 days out, leaving a gap of only about 3 points against the normal Saturday of 12 September (63.4% at 45 days out). Festival demand has barely flowed into the ryokan segment.
Asymmetry between the venue area and the eastern prefecture — the “prefecture average” blends two different phenomena
The venue, Tottori Hanakairo, is in Nanbu Town, and Yonago City is the natural centre of gravity for accommodation. Yet breaking the data down to city level shows that the prefecture-average peak is not a phenomenon confined to the venue area.
Source: MetroEngines Research; compiled by the HotelBank Editorial Team
| Area and property type | Sat 5 Sep, 45 days out | Sat 5 Sep, most recent | Sat 12 Sep, 45 days out | Gap at 35 days out (observed property counts shown) |
|---|---|---|---|---|
| Yonago City, all property types | 85.4% (41 properties) | 89.0% (49 properties, 28 days out) | 76.9% (48 properties) | +11.4pt (45 / 49 properties) |
| Yonago City, business hotels | 86.5% (21 properties) | 92.4% (22 properties, 28 days out) | 77.4% (21 properties) | +12.1pt (22 / 22 properties) |
| Yonago City, ryokan | 68.2% (13 properties) | 64.5% (14 properties, 28 days out) | 60.5% (14 properties) | +15.3pt (11 / 14 properties) |
| Tottori City, all property types | 97.0% (21 properties) | 97.0% (34 properties, 28 days out) | 65.4% (33 properties) | +29.3pt (29 / 34 properties) |
| Tottori City, business hotels | 100.0% (9 properties) | 100.0% (12 properties, 28 days out) | 62.6% (12 properties) | +35.2pt (12 / 13 properties) |
Source: MetroEngines Research; compiled by the HotelBank Editorial Team
Business hotels in Yonago City, the venue area, built steadily from 86.5% at 45 days out (21 properties) to 92.4% at the most recent 28-days-out reading (22 properties), functioning as the natural catchment for festival demand. Even so, the gap against the normal Saturday is +12.1pt on the property-count-aligned 35-days-out cross-section — smaller, in fact, than the prefecture-wide +18.6pt.
Tottori City, meanwhile, is a market of 12 business hotels and roughly 1,583 rooms, and its listed inventory for 5 September had already reached 100.0% at 45 days out (9 properties observed, zero rooms remaining). From there through to the most recent 28-days-out reading, remaining inventory moved in a range of 0 to 5 rooms, staying effectively sold out across almost the entire observation window. For the same Tottori City business hotels, the following day — Sunday 6 September — was at a normal level of 69.9% at 45 days out, so this is not a collection gap but a phenomenon specific to the date of 5 September. In the eastern part of the prefecture, roughly 100km from the venue, the natural reading is that a demand driver unrelated to the festival coincides with the same date.
This is where the practical point lies. The prefecture-average signal that “5 September is strong” in Tottori is an average of two qualitatively different phenomena: a moderate lift in the venue area, and a near-sell-out in the eastern prefecture. Pricing off the prefecture average alone leads to being too aggressive on the Yonago side and too slow on the Tottori City side. When reading event-driven demand, you need to check the event calendars of other cities in the same prefecture at the same time — not only the municipality hosting the venue. On how far event days should be separated from normal weekends, our analysis of inventory progress in Tokushima for Awaodori 2026, which quantified the gap between the four days of the dance grounds and normal weekends at 39.4pt, is also a useful reference.
The price yardstick — monthly estimated settled ADR and its seasonal shape
On the price side, we look at monthly estimated settled ADR. For business hotels in Tottori Prefecture, estimated settled ADR was ¥6,039 in July 2026 (N=53 properties, confirmed) against ¥5,990 in the same month a year earlier (N=51 properties, confirmed), or +0.8% year on year. Comparing confirmed months with each other, the year-on-year figures rose through early spring — +5.0% in January 2026, +6.7% in February, +5.7% in March and +5.7% in April — then converged into a flat band at +0.5% in May, −0.9% in June and +0.8% in July. The most recent confirmed September figure is ¥5,742 for September 2025 (N=51 properties, confirmed).
Source: MetroEngines Research; compiled by the HotelBank Editorial Team
The figures for August and September 2026 are estimates based on the current state of sales (August ¥9,230, N=50 properties; September ¥9,060, N=48 properties), and are calculated on a different basis from confirmed values. The chart distinguishes them with a dotted line. A simple comparison against confirmed values should wait for month-end confirmation. What should be read here is not the level itself, but the seasonal shape shown by the confirmed series — business hotels in Tottori Prefecture carry an annual rhythm of peaks in May and August and troughs in June and September (the highest confirmed level of the year was ¥6,396 in November 2025, N=52 properties). In particular, 2025 fell 8.9% from ¥6,301 in August to ¥5,742 in September, which makes September a month with a steep drop from the summer high season. It is in that trough month that a single day stands out — near sell-out in the eastern prefecture and above 90% in the venue area.
On the ryokan side, estimated settled ADR was ¥10,983 in July 2026 (N=78 properties, confirmed) against ¥11,447 in the same month a year earlier (N=80 properties, confirmed), or −4.1%. Not only is the occupancy response muted; the price side is also below the prior year.
For reference, as an actual result for an elapsed month, estimated OCC for business hotels in Tottori Prefecture in July 2026 averaged 85.1% for the month (42–47 properties observed daily), with the average across the four Saturdays at 93.1%. The 90.0% recorded for 5 September at 28 days out is therefore not conspicuously high compared with Saturdays in the summer high season. It is not that “the event day is abnormally strong” — rather, a September Saturday, which tends to swing towards the slack season, has been lifted to high-season levels. That is the true picture of this demand. For how late-summer Saturdays moved in the neighbouring San’in prefecture, see our analysis of inventory take-up in Shimane Prefecture over Obon 2026 and the post-Obon Saturday of 22 August.
For revenue managers running hotels and ryokan in Tottori Prefecture (the Yonago area and Tottori City) — implications and an action plan
(1) The “prefecture average” is not a benchmark for your property. Even for the same 5 September, market estimated OCC splits widely: 88.5% for business hotels prefecture-wide (35 days out, 44 properties), 90.9% in Yonago City (same cross-section, 22 properties) and 100.0% in Tottori City (same cross-section, 12 properties). If you want to check your own booking pace against the market, you need to look at least at the city level in which your property sits. This is exactly the kind of cross-section where a property concludes “we are weak” against the prefecture average when in fact it was running ahead of its own market.
(2) The 45-days-out cross-section is where that event day is won or lost. On 5 September, business hotels stood at 85.8% at 45 days out and 90.0% at the most recent 28-days-out reading. The incremental gain from 45 days out to the latest reading is only +4.2pt. In other words, the decisions that determine how this date is sold are finished before the 45-day mark. If you have a similar event ahead in future years, there is room to reset the starting point of your pricing-revision calendar from “one month out” to “two months out”.
(3) The peak skews to day one. Design day two and the following day separately. Sunday 6 September was essentially flat at 73.4% at 45 days out and 73.2% at 29 days out. There is a gap against the normal Sunday of 13 September (65.6% at 45 days out), but nothing like the sharpness of day one. Pushing consecutive-night capture, or pricing a single night on day two as aggressively as day one, carries the risk of leaving inventory unsold close in.
(4) Ryokan sit outside this demand. Capturing it starts with product design. Prefecture-wide ryokan were flat on 5 September at 66.7% at 45 days out and 66.4% at 28 days out, with a gap of only about 3 points against the normal Saturday. On price, estimated settled ADR for July 2026 was −4.1% year on year (confirmed against confirmed). Because event attendees spend the dinner hours at the venue, the timing does not mesh with a standard product built around one night with two meals. Whether you can hold room-only allocations with late check-in permitted may be the dividing line for picking up this segment.
(5) September is a month where price is hard to build across the year — which is exactly why losing a single day matters. On a confirmed basis, year-on-year change sits in a flat band at +0.5% in May, −0.9% in June and +0.8% in July, and in 2025 the level fell 8.9% from August to September. Given that a day of near sell-out in the eastern prefecture and above 90% in the venue area stands in that month, running this single date on the same settings as a normal Saturday is likely to be a lost opportunity.
| Time horizon | Action | Decision trigger (tied to figures in this article) | Objective |
|---|---|---|---|
| Today to this week | Re-align your property’s sales position for 5 and 6 September against your own market’s cross-section (Yonago City / Tottori City) rather than the prefecture average | If your property is in Yonago City and its take-up for 5 September is well below the market’s 90.9% (35 days out, 22 properties) | Avoid under- or over-estimation caused by comparing against the prefecture average |
| Today to this week | If inventory remains, review your settings for 5 September separately from those for the normal Saturday of 12 September | If your settings for 5 and 12 September are still identical while the market diverges at 88.5% versus 69.9% (35 days out, 44 properties each) | Avoid losing the demand of a single strong day in a trough month |
| Within two weeks | Re-check inventory and settings for 6 September (day two) and 7 September (the following Monday) separately from day one | Given that the market for 6 September was flat at 73.4% at 45 days out and 73.2% at 29 days out, if your own 6 September is still set at the same level as day one | Match the product to a demand shape weighted towards day one |
| Within two weeks | For ryokan and Japanese-style properties, consider whether you can hold room-only / no-dinner / late-check-in allocations limited to 5 September | If your take-up for 5 September has stalled at normal-Saturday levels, in line with the market’s ryokan figure of 68.3% (35 days out, 56 properties) | Create a touchpoint with the segment being missed by a two-meal assumption |
| Looking to next month | For event dates, bring the starting point of your pricing-revision calendar forward to earlier than 45 days before the stay date | Based on the fact that this 5 September moved from 85.8% at 45 days out to 90.0% at 28 days out (+4.2pt), leaving limited room for growth after the 45-day mark | Place decision timing ahead of demand formation for the next event |
| Looking to next month | Shift to managing the event calendars of other cities in the prefecture on the same sheet as your own city, not just your own | Based on the asymmetry of +12.1pt in the venue area of Yonago City against +35.2pt in Tottori City some 100km away (both at 35 days out, with property counts nearly aligned) | Reduce blind spots for demand drivers far from the venue |
Source: MetroEngines Research; compiled by the HotelBank Editorial Team
Summary — three yardsticks to take away
Yardstick 1: Before measuring event demand in “the city that hosts the venue”, line up the other cities in the prefecture on the same cross-section. Here, on the property-count-aligned 35-days-out cross-section, the gap between the festival day and the normal Saturday was +12.1pt in Yonago City, the venue area, and +35.2pt in Tottori City in the eastern prefecture. The prefecture average of +18.6pt is a figure that blends the two, and cannot be used as a benchmark for your property as it stands.
Yardstick 2: Always read cross-section comparisons alongside the observed property counts. Prefecture-wide across all property types, the 45-days-out cross-section covered 144 properties for 5 September against 185 for 12 September — the populations were not aligned. Here, re-taking the reading at 35 days out, where the property counts nearly match, still left a gap of +12.5pt, so it could be judged as real demand. Skip that verification and you risk mistaking an apparent peak for genuine demand.
Yardstick 3: Use the size of the incremental gain after 45 days out as a yardstick for decision timing. For 5 September, the gain from 45 days out to 28 days out was +4.2pt; for 12 September, from 45 days out to 35 days out, it was +2.8pt. By contrast, 29 August — a nearer stay date — built +7.3pt from 45 days out to 21 days out. A date with a small incremental gain is a date where demand formation has already finished. Rather than spending resources on days where no further build-up can be expected, it is more effective to redesign the process so that decisions are completed before that point.
About the data
| Item | Detail |
|---|---|
| Definition of estimated OCC | Occupancy on an OTA-listed-inventory basis = 100 − 100 × rooms remaining on OTA listings ÷ total rooms. It is an estimate based on the take-up of inventory offered for sale on OTAs, and is defined differently from actual room occupancy (it reads higher). This article labels it “estimated OCC (OTA-listed-inventory basis)”. |
| Booking curve | Based on observations from 45 days before the stay date through to the most recent reading. The stay dates covered are 5, 6, 12 and 13 September 2026, plus 29 August as a reference. The latest observation date is 8 August 2026 (equivalent to 28 days out for 5 September and 35 days out for 12 September). |
| Definition of estimated settled ADR | The transacted price level (pre-tax-equivalent) inferred from OTA and other sales data (lowest-plan level × property-type coefficient, ensembled across multiple channels). Past months are confirmed values; the current and future months are estimates based on the current state of sales. Median error against published operating results is 6.6%. Months covered are January 2025 to September 2026, for business hotels and ryokan in Tottori Prefecture. |
| Breakdown of property counts | Booking curve / Tottori Prefecture overall: all property types N=144–186, business hotels N=39–46, city hotels N=8, ryokan N=56–71 (each stated in the text and tables for the relevant cross-section). City level: Yonago City all property types N=41–49, business hotels N=21–22, ryokan N=11–14; Tottori City all property types N=21–34, business hotels N=9–13. Estimated settled ADR: business hotels N=48–53, ryokan N=73–80. Elapsed-month results (July 2026): Tottori Prefecture business hotels, daily observations N=42–47; all property types N=167–189. |
| Caveats | “Sold-out property rate” is an estimate of the share of properties for which no listed inventory can be confirmed on OTAs or elsewhere. City hotels (N=8) and Yonago City ryokan (N=11–14) rest on small observed property counts and are readily affected by inventory movements at a handful of properties. Data as of 9 August 2026. Because sales conditions and inventory change daily, the figures in this article are a snapshot as at the time of retrieval. |
References and sources
| Source | Content |
|---|---|
| SHINE UP FES!2026 official site | Dates (5 and 6 September 2026), venue (Tottori Hanakairo, Nanbu Town, Saihaku District, Tottori Prefecture) and event outline |
| CORE Inc. press release (PR TIMES) | Confirmation of SHINE UP FES!2026, scale of the line-up and outline of the food area |
| Tottorizumu, “[5–6 September] SHINE UP FES!2026” | Local media announcement covering the schedule, venue and programme on the day |
■ Data sources
The booking curves, estimated OCC and estimated settled ADR in this article are aggregated from daily observations of OTA-listed inventory and listed prices collected by MetroEngines Research & Consulting. Coverage is business hotels, city hotels and ryokan in Tottori Prefecture (prefecture-wide, Yonago City and Tottori City). The latest observation date is 8 August 2026; the article was prepared as of 9 August 2026. Event dates and the venue have been confirmed against the organiser’s official site and press release.
■ Calculation assumptions
Estimated OCC is calculated as “100 − 100 × rooms remaining on OTA listings ÷ total rooms”, and comparisons are made between cross-sections at the same lead time, starting from 45 days before the stay date. Because differences in the number of properties observed on each date (population drift) can create apparent gaps, the 35-days-out cross-section, where observed property counts nearly match, was used as the primary basis for comparison. For estimated settled ADR, past months are confirmed values while August 2026 onwards are estimates based on the current state of sales; the two are calculated on different bases and are therefore not compared directly.
■ Limitations and caveats
Estimated OCC is a metric on an OTA-listed-inventory basis and is defined differently from actual room occupancy (it generally reads higher). City hotels (N=8) and ryokan in Yonago City (N=11–14) rest on small observed property counts and are readily affected by inventory movements at a handful of properties. The sell-out level in Tottori City on 5 September may reflect demand drivers other than the festival coinciding on the same date; this article does not identify the cause. Because inventory and prices change daily, the figures in this article are a snapshot as at the time of retrieval.
Related reading
- Yamagata Hanagasa 2026: Demand Settled 45 Days Out, +9.6pt vs Normal
- Awaodori 2026: 98.8% Sold 45 Days Out — 39.4pt Over Normal Weekends
- Shimane Obon 2026: Only Aug 15-16 Dip; Aug 22 Business Hotels 90.9%
- Owara Kaze no Bon 2026: 85.0% OCC on 3 Weekdays, 45 Days Out
- Aomori Nebuta 2026: 97.4% Sold 45 Days Out, Post-Festival +14pt
- Yosakoi 2026: Kochi Aug 11 86.9% Sold Out at 45 Days, 45.0pt Gap
- 94.5% Sold 45 Days Out: Omagari Fireworks vs a Normal Akita Weekend
- Okayama Booking Curves: 3 Checkpoints, Aug 8 Late-Surges +11.8pt