

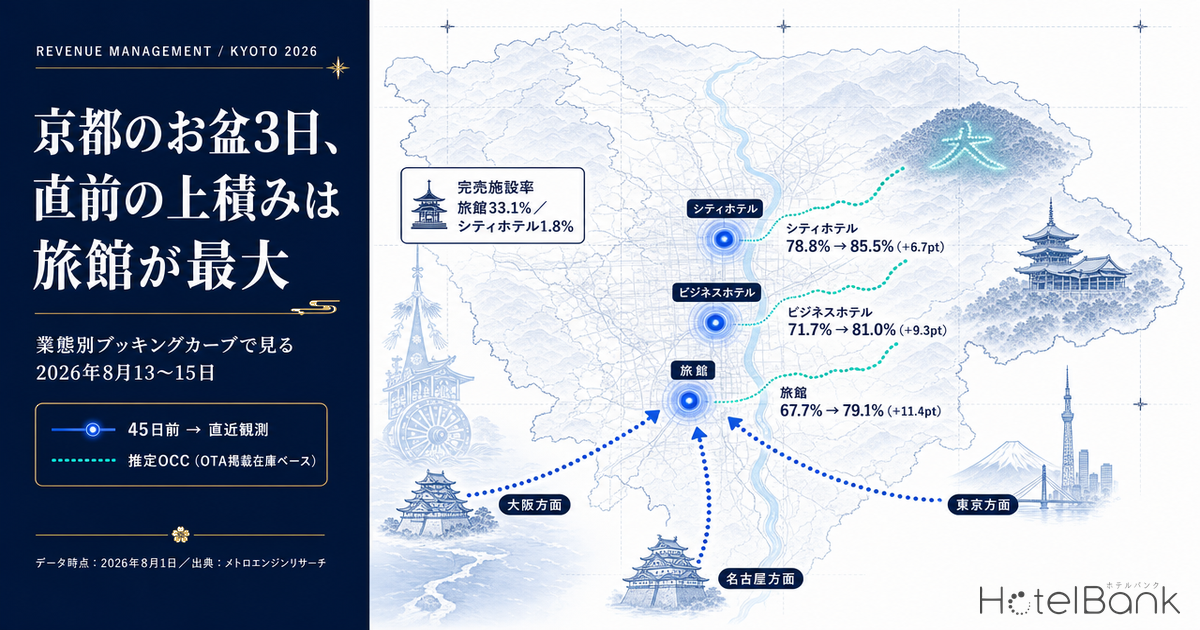
We arranged the three days of Obon in Kyoto (August 13–15, 2026) as booking curves running from 45 days before the stay date to the most recent observation, split into three property types: city hotels, business hotels, and ryokan. The conclusion first: the lower a category’s starting level, the larger its gain in the run-up to the stay date. For Thursday, August 13, estimated OCC (based on OTA-listed inventory) moved from T-45 to the latest observation as follows — ryokan 67.7% → 79.1% (+11.4pt), business hotels 71.7% → 81.0% (+9.3pt), city hotels 78.8% → 85.5% (+6.7pt). The three categories did not rise in parallel while preserving their ranking; rather, the categories that started lower closed the gap through a steeper slope. At the same time, the sold-out property rate already differed by an order of magnitude at T-45 — ryokan 33.1% versus city hotels 1.8% — showing that “still available” means something entirely different depending on the category.
Coverage: Kyoto Prefecture (city hotels N=56 properties / 10,369 rooms; business hotels N=293 properties / 31,712 rooms; ryokan N=181 properties / 3,347 rooms). This article uses only estimated occupancy based on OTA-listed inventory (estimated OCC), the sold-out property rate, and listed-inventory absorption; no price metrics are covered. All definitions appear at the end of the article. Data as of August 1, 2026.
- — The ranking by level and the ranking by slope are inverted — For Thursday, August 13, estimated OCC (based on OTA-listed inventory) from T-45 to the latest observation was ryokan 67.7% → 79.1% (+11.4pt), business hotels 71.7% → 81.0% (+9.3pt), city hotels 78.8% → 85.5% (+6.7pt). The lower the starting point, the larger the gain (Kyoto Prefecture, as of August 1, 2026).
- — The center of gravity of the gain sits in the second half — Splitting August 13 into a first half (T-45 → T-30) and a second half (T-30 → latest observation) gives ryokan +4.4pt / +7.0pt, business hotels +3.9pt / +5.4pt, city hotels +3.0pt / +3.7pt. For ryokan, just over 60% of the 11.4pt gain came after T-30.
- — The sold-out property rate differs by an order of magnitude from T-45 onward — At T-45 the sold-out property rate was 33.1% for ryokan versus 1.8% for city hotels. Ryokan stayed almost flat through 33.7% at the latest observation, meaning that at the property level the outcome was already settled before T-45.
- — Obon is not a single block — At the latest observation, city hotels stood at 85.5% for Aug 13 and 81.8% for Aug 15, a 3.7pt spread. On the adjacent Sunday, August 16 (Gozan no Okuribi), city hotels reached 85.8% — above August 13 — while ryokan stopped at 71.0%.
- — Ryokan also show the largest gap versus an ordinary Thursday — At the same T-30 checkpoint, August 13 exceeded the control date of August 27 by +5.0pt for city hotels, +7.7pt for business hotels, and +11.7pt for ryokan (N = 56 city, 293 business, 181 ryokan properties).
From T-45 to the latest observation — the three categories converged as they climbed
First, we overlay how estimated OCC for the three categories moved from T-45 to the latest observation (July 31, 2026). The horizontal axis is days remaining until the stay date: T-45 on the left, moving closer to the stay date toward the right. The target is a single night on Thursday, August 13.
Source: Compiled by the HotelBank Editorial Team from MetroEngines Research
All three lines slope upward, but the spacing between them tightens toward the right. At T-45 the gap between city hotels and ryokan was 11.1pt (78.8% versus 67.7%); by the latest observation it had narrowed to 6.4pt (85.5% versus 79.1%). Business hotels traced the middle path: 7.1pt behind city hotels at T-45, and 4.5pt behind at the latest observation. The relationship “the higher a category stands at T-45, the less room it has left to add close in” is not unique to Kyoto — Tochigi Booking Curves by Type: Resort 81.1% at T-45, Only +2.6pt Left tests the same question across four categories.
Where the gain accumulates also differs by category. Decomposing August 13 into a first half (T-45 → T-30) and a second half (T-30 → latest observation), city hotels split roughly evenly at +3.0pt / +3.7pt, while business hotels came in at +3.9pt / +5.4pt and ryokan at +4.4pt / +7.0pt — the lower the level, the more the center of gravity shifts to the second half. For ryokan, just over 60% of the 11.4pt gain up to the latest observation occurred after T-30.
Listed-inventory absorption points the same way. Converted to a per-1,000-room basis, absorption from T-45 to the latest observation was 114.1 rooms for ryokan, 92.9 rooms for business hotels, and 67.0 rooms for city hotels — the same order as the size of the gain. Note here that the ryokan total of 3,347 rooms is less than one third of the city hotel total (10,369 rooms); only by normalizing on supply scale rather than absolute volume does “ryokan inventory is depleting faster close in” become readable.
| Category | Stay date | T-45 Est. OCC | T-30 Est. OCC | Latest obs. Est. OCC | Gain (T-45 → latest) | Sold-out property rate T-45 → latest | Listed-inventory absorption (per 1,000 rooms) | Observed properties range |
|---|---|---|---|---|---|---|---|---|
| City hotels 56 properties, 10,369 rooms | Aug 13 (Thu) | 78.8% | 81.8% | 85.5% (T-13) | +6.7 pt | 1.8% → 1.8% | 67.0 rooms | 55–56 |
| Aug 14 (Fri) | 78.5% | 81.5% | 83.8% (T-14) | +5.3 pt | 1.8% → 1.8% | 52.6 rooms | 55–56 | |
| Aug 15 (Sat) | 77.5% | 79.5% | 81.8% (T-15) | +4.3 pt | 3.6% → 3.6% | 42.6 rooms | 54–56 | |
| Business hotels 293 properties, 31,712 rooms | Aug 13 (Thu) | 71.7% | 75.6% | 81.0% (T-13) | +9.3 pt | 7.2% → 9.6% | 92.9 rooms | 271–288 |
| Aug 14 (Fri) | 71.5% | 75.4% | 80.6% (T-14) | +9.1 pt | 8.5% → 8.9% | 90.7 rooms | 271–288 | |
| Aug 15 (Sat) | 70.3% | 73.2% | 78.4% (T-15) | +8.1 pt | 9.2% → 10.2% | 81.3 rooms | 269–288 | |
| Ryokan 181 properties, 3,347 rooms | Aug 13 (Thu) | 67.7% | 72.1% | 79.1% (T-13) | +11.4 pt | 33.1% → 33.7% | 114.1 rooms | 129–179 |
| Aug 14 (Fri) | 67.0% | 71.2% | 76.8% (T-14) | +9.8 pt | 30.9% → 30.9% | 97.7 rooms | 135–179 | |
| Aug 15 (Sat) | 66.6% | 68.9% | 74.1% (T-15) | +7.5 pt | 29.3% → 26.0% | 75.4 rooms | 138–179 |
Source: Compiled by the HotelBank Editorial Team from MetroEngines Research
The rightmost column of the table shows the range of observed properties. City hotels are stable at 54–56 properties and business hotels at 269–288, but ryokan span a wide 129–179. Ryokan have few rooms per property (3,347 rooms across 181 properties, a simple average of 18.5 rooms), so whether a property is listed or not moves the observation count easily. The ryokan figures should be read with this variation in observation depth in mind.
The gain runs inverse to the level — ryokan +11.4pt, business +9.3pt, city +6.7pt
Next we line up the gain (T-45 → latest observation) for each of the three days by category. Although all three are “Obon,” they fall on a Thursday, Friday, and Saturday, and the later the date, the shorter the observation window (32 days for August 13, 30 days for August 15) — worth keeping in mind while reading.
Source: Compiled by the HotelBank Editorial Team from MetroEngines Research
In all nine bars the category order is the same (ryokan ≧ business hotels > city hotels), but the whole set shrinks as the date moves later. On Saturday, August 15, the figures were city hotels +4.3pt, business hotels +8.1pt, and ryokan +7.5pt — the one place where ryokan and business hotels swap order. Ryokan on August 15 were the lowest of the three days both at T-45 (66.6%) and at the latest observation (74.1%). The softest day within Obon is Saturday, August 15 — a pattern shared across all three categories.
Ranked by absolute level at the latest observation, Thursday, August 13 stands at city 85.5% / business 81.0% / ryokan 79.1%; Friday, August 14 at 83.8% / 80.6% / 76.8%; and Saturday, August 15 at 81.8% / 78.4% / 74.1%. One might expect Saturday to be the strongest by day of week, but for Obon in Kyoto Thursday, August 13 is the furthest along of the three days. Demand is concentrated at the entrance to the week where homecoming and sightseeing overlap, so building inventory and conditions on weekend instincts alone will miss.
For reference, in July 2026 — the most recent completed month, tallied only for days with sufficient observations — average estimated OCC was 86.2% for city hotels (30 days), 83.5% for business hotels (29 days), and 83.9% for ryokan (27 days). By day of week in July, city hotels peaked on Saturday at 90.9% against 83.4% on Monday, business hotels on Thursday at 89.3% against 75.2% on Monday, and ryokan on Saturday at 90.3% against 81.6% on Thursday — the peak sits in a different place for each category. The latest observations for the three Obon days are still mid-sale snapshots and cannot be compared directly with July’s completed actuals, but it is worth noting that ryokan on August 15 (74.1%) sit well below the July average.
The sold-out property rate differs by an order of magnitude from T-45 — ryokan 33.1%, city 1.8%
Where estimated OCC measures “what percentage of inventory across the area has been absorbed,” the sold-out property rate measures “what percentage of properties no longer show listed inventory.” Even within the same Obon, these two moved in completely different ways by category.
Source: Compiled by the HotelBank Editorial Team from MetroEngines Research
Ryokan already stood at 33.1% at T-45 and traced a near-flat plateau to 33.7% at the latest observation across the full 45 days. There is up-and-down noise, but virtually no upward trend. In other words, which ryokan fill up was settled before T-45, and what increases within the final 45 days is inventory absorption inside the properties that remain. That is the structure behind estimated OCC rising +11.4pt while the sold-out property rate stays put.
Business hotels moved from 7.2% to 9.6%, a range of a few points over the 45 days. City hotels went from 1.8% to 1.8%, peaking at just 5.4% during the period. At an average of 185 rooms per property (10,369 rooms ÷ 56 properties), listed inventory does not disappear across an entire property. The same phrase — “filling up for Obon” — points to two different phenomena: ryokan drop out property by property, while city hotels thin out within each property.
This difference feeds directly into how inventory release is designed. For ryokan, which drop out property by property early, how bookings are handled before T-45 determines most of the outcome, so what can be done within 45 days is limited to allocating across the properties that remain. City hotels and business hotels, by contrast, still have room for inventory to move within the property inside the 45-day window.
How many points above an ordinary Thursday did the three Obon days sit?
To gauge how special the three Obon days are, we lined them up against August 20 and August 27 — also Thursdays — as control dates, at the identical T-45 and T-30 checkpoints. Matching the day of week brings us closer to the contribution of “being Obon” with the day-of-week effect removed.
| Category | Estimated OCC at T-45 | Estimated OCC at T-30 | Gap at T-30 Aug 13 − Aug 27 | ||||
|---|---|---|---|---|---|---|---|
| Aug 13 (Thu) | Aug 20 (Thu) | Aug 27 (Thu) | Aug 13 (Thu) | Aug 20 (Thu) | Aug 27 (Thu) | ||
| City hotels | 78.8% | 74.9% | 74.7% | 81.8% | 76.6% | 76.8% | +5.0 pt |
| Business hotels | 71.7% | 66.7% | 64.2% | 75.6% | 69.8% | 67.9% | +7.7 pt |
| Ryokan | 67.7% | 57.4% | 60.1% | 72.1% | 61.2% | 60.4% | +11.7 pt |
Source: Compiled by the HotelBank Editorial Team from MetroEngines Research
At the T-30 cross-section, August 13 exceeded August 27 by +5.0pt for city hotels, +7.7pt for business hotels, and +11.7pt for ryokan. Here too, the largest Obon uplift belongs to ryokan. Ryokan sat at 60.4% at T-30 for August 27 and 61.2% for August 20 — stuck in the low 60s — while August 13 reached 72.1%. For ryokan in Kyoto, Obon is one of the few dates where the gap versus an ordinary Thursday reaches double digits. On where the day-by-day ranking within an Obon period gets decided, Osaka Obon 2026 Booking Curve: Aug 14 at 74.9%, Aug 16 Stuck at 64.1% tracks four days in Osaka at the same three checkpoints (T-45, T-30, and close-in), where Saturday was observed to fall below the Saturdays of the surrounding weeks.
One more date deserves the same treatment: the adjacent Sunday, August 16. In 2026 the Kyoto Gozan no Okuribi bonfires are lit in sequence from 20:00 on August 16 (Kyoto City Official Travel Guide, Kyoto Travel Navi). No T-45 observation is available for this date, so taking T-44 as the starting point, city hotels ran 81.6% → 83.0% (T-30) → 85.8% (latest observation, T-16) for +4.2pt, business hotels 71.3% → 74.0% → 77.7% for +6.4pt, and ryokan 63.1% → 66.9% → 71.0% for +7.9pt.
What stands out is the reversal in level: city hotels on Sunday, August 16 reached 85.8%, above the 85.5% of August 13, the strongest of the three Obon days. Ryokan on August 16, meanwhile, stopped at 71.0% — lower than any of the three Obon days. Demand on the same date is being valued in opposite directions by category, a cross-section suggesting that the movement to spend the night of the bonfires inside the city skews toward city hotels. The sold-out property rate for August 16 was likewise higher for city hotels at 7.1%, versus 1.8–3.6% across the three Obon days.
For revenue managers running city hotels, business hotels, and ryokan in Kyoto — implications and an action plan
(1) Manage “level” and “slope” separately. A low estimated OCC at T-45 is not the same as a weak date. Across the three Obon days in Kyoto, ryokan — the lowest at T-45 (67.7% for August 13) — produced the largest gain (+11.4pt). When benchmarking your own T-45 progress against the market, hold both the level and “how many points this category typically adds from there.” The market gains (city +6.7pt / business +9.3pt / ryokan +11.4pt) serve as a yardstick for judging whether your remaining allotment is too large or too small.
(2) The more a category’s gain is weighted to the second half, the less effective early selling at T-30 becomes. Decomposing August 13 gives ryokan +4.4pt first half / +7.0pt second half, business hotels +3.9pt / +5.4pt, and city hotels +3.0pt / +3.7pt. In a category weighted to the second half, selling out your allotment by T-30 leaves nothing to sell during the stretch when the market adds most heavily. Conversely, for city hotels, where the two halves are evenly matched, a design that simply carries a first-half shortfall into the second half is hard to justify.
(3) The gap in sold-out property rates changes how you draw rate fences. Ryokan stood at 33.1% at T-45, city hotels at 1.8%. In a market where properties drop out early, the moves available within 45 days are limited to allocation across the properties that remain, and how bookings are handled before T-45 decides the outcome. In a market that thins out within each property, room type and stay conditions can still be reconfigured inside the 45-day window. Which type your property belongs to can be diagnosed the same way, by looking at how each room type fills.
(4) Do not treat Obon as a single block. At the latest observation, city hotels spread 3.7pt between August 13 (85.5%) and August 15 (81.8%), with gains of +6.7pt versus +4.3pt. And the adjacent August 16 came in at 85.8% for city hotels, above August 13. Since the day-by-day shape differs by category, setting conditions in bulk for “the Obon period” produces both problems at once: leaving money on the table on strong days and sitting on inventory on soft ones.
| Time horizon | Move | Decision trigger (tied to figures in this article) | Objective |
|---|---|---|---|
| Today through Obon (within 2 weeks) | Revisit the allocation of remaining listed allotment | If your own estimated occupancy for Aug 13–15 remains below the market’s latest observation (city 85.5% / business 81.0% / ryokan 79.1%) | Keep allotment available for the phase when the market adds heavily close in |
| Today through Obon (within 2 weeks) | Inspect Saturday, Aug 15 — the softest of the three days — on its own | Given that Aug 15 shows the smallest gain of the three days (city +4.3 pt / business +8.1 pt / ryokan +7.5 pt), if your Aug 15 alone is lagging | Break down the assumption that “Obon is uniformly strong” date by date |
| Today through Obon (within 2 weeks) | Decide whether to relax consecutive-night and minimum-stay conditions | Given that the latest observation for Sunday, Aug 16 puts city hotels at 85.8% — above Aug 13 — while ryokan stop at 71.0%, if you are sitting on allotment behind an Aug 15–16 consecutive-night requirement | Unlock stay conditions to match the day-by-day shape of demand |
| After Obon through September (the next 45-day cycle) | Manage the next peak date from its T-45 starting point | Take the ordinary-Thursday T-45 levels of city 74.7% / business 64.2% / ryokan 60.1% (Aug 27) as your normal-day benchmark, and check whether the next peak date clears it at T-45 | Identify peak dates by fixed checkpoints rather than intuition |
| After Obon through September (the next 45-day cycle) | Decide in advance how much inventory to hold back for the second half (after T-30) | If the Aug 13 structure — a thicker second half (T-30 → latest) than first half (T-45 → T-30), e.g. ryokan +4.4 pt → +7.0 pt — reproduces at your property | Avoid both selling out too early and missing close-in demand |
| Toward next year’s Obon | Build the handling of small inventory that fills property-wide into your design | Given the gap in sold-out property rates at T-45 — ryokan already 33.1% versus city 1.8% — if the same skew appears across your own room types | Redraw rate fences starting from the types that drop out first |
Source: Compiled by the HotelBank Editorial Team from MetroEngines Research
None of these guarantee results; how well they apply depends on your own booking and channel mix. A good starting point is to re-plot your own progress for August 13, 15, and 16 in the same form as the three checkpoints above (T-45, T-30, and the latest observation).
Summary — hold all three checkpoints: T-45, T-30, and the latest observation
Viewing the three Obon days in Kyoto through booking curves by category, three points stand out.
First, the ranking by level and the ranking by slope are inverted. City hotels, the highest at T-45 (78.8%), posted the smallest gain (+6.7pt), while ryokan, the lowest (67.7%), posted the largest (+11.4pt). Judging a date “weak” from the T-45 cross-section alone misses the difference in slope between categories.
Second, the lower the category’s level, the more the gain is weighted to the second half. For August 13, 7.0pt of the ryokan gain of 11.4pt came after T-30. The answer to “how full should you be by T-30” differs by category.
Third, the sold-out property rate and estimated OCC tell different stories. Ryokan held a sold-out property rate of around 33% for the full 45 days while only estimated OCC climbed. Whether properties drop out, or thin out from within — being able to make that distinction by room type at your own property determines the range of moves available inside 45 days.
Hold three things by category and by date: the level at T-45, the first-half gain through T-30, and the second-half gain after T-30. That is the minimum yardstick for running future Obon periods on fixed checkpoints rather than intuition.
About the Data
■ Data source
Daily observations of OTA-listed inventory collected by MetroEngines Research (rooms remaining on listings, by stay date and by property). Coverage: Kyoto Prefecture — city hotels 56 properties / 10,369 rooms (observed property range 54–56); business hotels 293 properties / 31,712 rooms (269–288); ryokan 181 properties / 3,347 rooms (129–179). Data as of August 1, 2026; latest observation as of July 31, 2026.
■ Calculation assumptions
• Definition of estimated OCC (based on OTA-listed inventory): OTA-listed-inventory occupancy rate = 100 − 100 × rooms remaining on OTA listings ÷ total rooms. The target month for this article is August 2026 (stay dates August 13, 14, 15, and 16; control dates August 20 and August 27), plus July 2026 as the most recent completed month.
• Booking curves: based on observations from 45 days before the stay date up to the most recent. The latest observation is as of July 31, 2026 (T-13 for August 13, T-14 for August 14, T-15 for August 15, and T-16 for August 16). Days on which the number of observed properties fell below half of the maximum observation count for the same stay date were excluded from the tally as thin cross-sections.
• Sold-out property rate: the (estimated) share of properties for which no listed inventory can be confirmed on OTAs and similar channels for the target date.
• Listed-inventory absorption (per 1,000 rooms): the difference in rooms remaining on listings between T-45 and the latest observation, converted to a per-1,000-room basis using the total rooms of the target category.
• The July 2026 tally covers only days with sufficient observations: 30 days for city hotels, 29 days for business hotels, and 27 days for ryokan.
■ Limitations and caveats
• Estimated OCC is an estimate based on the absorption of inventory sold on OTAs, and differs in definition from actual room occupancy (it runs higher). The sold-out property rate likewise does not directly measure genuine full occupancy.
• The latest observations for the three Obon days are still mid-sale snapshots and cannot be compared directly with the completed actuals for July 2026. Note also that the later the stay date, the shorter the observation window.
• Sales conditions and inventory fluctuate daily, so the figures in this article are a snapshot as of the retrieval date (August 1, 2026).
References and Sources
Kyoto Gozan no Okuribi: “What kind of event is it?” | Kyoto City Official Travel Guide, Kyoto Travel Navi (lit in sequence from 20:00 on August 16, 2026)
Kyoto Gozan no Okuribi | Kyoto City Official Travel Guide, Kyoto Travel Navi, event information