

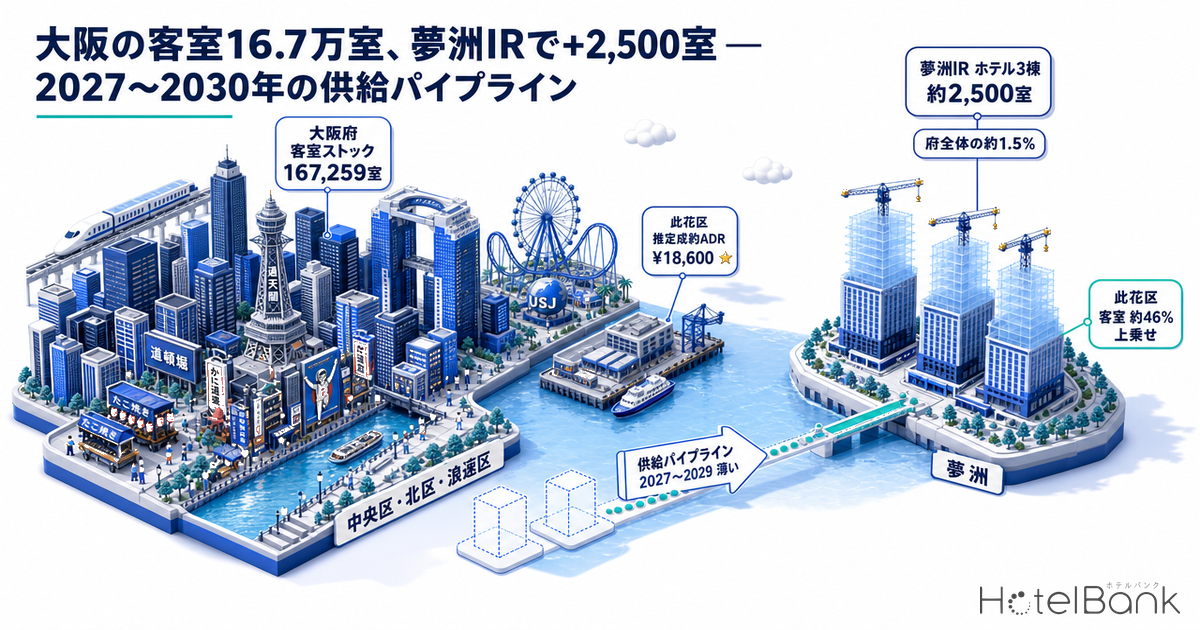
Within the coverage of MetroEngines Research, Osaka Prefecture has 2,523 lodging facilities with 167,259 rooms (as of September 2026). On top of this stock, the Yumeshima integrated resort (IR), scheduled to open around autumn 2030, will add three hotels with approximately 2,500 rooms — equivalent to about 1.5% of the prefecture’s total and about 1.8% of the stock within Osaka City. Meanwhile, on May 29, 2026, Osaka City stopped accepting new applications for Special Zone minpaku (特区民泊) certification. Capacity that is growing and capacity that is shifting overlap in the same four-year window. This article cross-checks where room stock stands today, the pipeline visible from construction starts and building permit applications, and demand-side estimated settled ADR, to identify where gaps will open up across price tiers heading into 2030.
Metric Definitions Used in This Article
- ADR (Average Daily Rate): An estimated settled rate (tax-exclusive equivalent), calculated by applying segment-specific adjustment factors to the lowest-priced plan each property publishes on OTAs (per-room rate for two guests, tax included). Benchmarked against property-level actuals disclosed by listed hotel REITs (91 properties, most recent 3 months), the median error is approximately 7%. These are estimates and differ from each property’s actual transaction prices and accounting figures. Area-level ADR is the median of the target properties (the level of a typical property in the area).
- OCC (Occupancy Rate): The share of rooms sold relative to total rooms in the area (an estimate based on OTA sales inventory; consistency checks against REIT monthly disclosures confirm accuracy within roughly a few points).
- Listed price: The published price averaged across all plans, per room for two guests (tax included). This is on a different basis from ADR.
- Data sources: MetroEngines Research & Consulting / Ministry of Land, Infrastructure, Transport and Tourism (MLIT) “Building Dynamics Statistics” and “Building Construction Starts Statistics” / Osaka City published materials
- — Osaka Prefecture’s room stock totals 2,523 facilities and 167,259 rooms. 84.9% is inside Osaka City, and 56.3% is concentrated in just three wards: Chuo, Kita and Naniwa.
- — The Yumeshima IR, scheduled to open around autumn 2030, brings three hotels and about 2,500 rooms. That is only 1.5% of the prefecture, but about +46% for Konohana Ward alone.
- — Confirmed supply for 2027–2028 based on building permit applications is 337 rooms. That is far below the recent three-year pace of 5,019 rooms per year, but it is a floor, not a final figure.
- — Estimated OCC held at 85.9% in August 2026. Estimated settled ADR is down 32.7% YoY, but only −4.0% versus pre-Expo 2024, essentially flat.
- — The gap is in the upper-midscale tier at listed prices of ¥25,000–40,000. The deluxe tier holds just 7.5% of rooms yet runs the tightest, at 91.6% estimated OCC (as of August 2026).
Where Things Stand — 167,000 Rooms in Osaka, 56% Concentrated in Chuo, Kita and Naniwa Wards
First, let’s establish the total inventory as the starting point. Within the coverage of MetroEngines Research, Osaka Prefecture has 2,523 lodging facilities and 167,259 rooms (as of September 2026, registration basis). Of these, 113 are large properties with 300+ rooms, and 28 have 500+ rooms. Limiting the scope to Osaka City’s 24 wards gives 1,973 facilities and 141,948 rooms, meaning 84.9% of the prefecture’s rooms are located within Osaka City.
Narrowing further makes the concentration even clearer. Chuo Ward (51,246 rooms), Kita Ward (26,686) and Naniwa Ward (16,254) together hold 94,186 rooms — 56.3% of the prefecture and 66.4% of Osaka City’s stock. More than half of the prefecture’s rooms are stacked on two cores: Minami (Chuo and Naniwa wards) and Kita (Kita Ward).
Circle size = number of rooms. Source: MetroEngines Research & Consulting
Source: MetroEngines Research & Consulting (Osaka City 24 wards, N=1,973 facilities)
Notably, the ranking by room count does not match the ranking by facility count. Naniwa Ward has 268 facilities, second only to Chuo Ward, but ranks third in rooms at 16,254, with an average of just 61 rooms per property — mostly small properties. By contrast, Yodogawa Ward has 102 facilities and 11,073 rooms, averaging 109 rooms per property and skewing large. Home to Shin-Osaka Station, Yodogawa Ward has 10 properties with 300+ rooms, giving it large room counts relative to its number of facilities.
Turning to the bay area, Konohana Ward has 78 facilities and 5,439 rooms, with 9 properties of 300+ rooms. Because it sits next to Universal Studios Japan (USJ), its share of large properties is high even though its total room count is mid-ranked. Neighboring Suminoe Ward is thin at 22 facilities and 2,626 rooms, so the bay area as a whole — including Sakishima and Yumeshima — totals only 8,065 rooms. This figure becomes the denominator for measuring the impact of the Yumeshima IR discussed below.
| Ward | Rooms | Facilities | 300+ rooms | Avg. per facility | Est. settled ADR |
|---|---|---|---|---|---|
| Chuo | 51,246 | 537 | 37 | 95 rooms | ¥9,800 |
| Kita | 26,686 | 210 | 25 | 127 rooms | ¥9,500 |
| Naniwa | 16,254 | 268 | 10 | 61 rooms | ¥9,600 |
| Yodogawa | 11,073 | 102 | 10 | 109 rooms | ¥7,800 |
| Nishi | 6,397 | 89 | 5 | 72 rooms | ¥8,600 |
| Nishinari | 6,380 | 225 | 2 | 28 rooms | ¥4,600 |
| Konohana | 5,439 | 78 | 9 | 70 rooms | ¥18,600 |
| Tennoji | 5,084 | 105 | 2 | 48 rooms | ¥8,200 |
| Suminoe | 2,626 | 22 | 3 | 119 rooms | ¥10,600 |
Estimated settled ADR is the average of monthly medians for June–August 2026. Chuo Ward N=194 facilities, Kita Ward N=74, Naniwa Ward N=56, Konohana Ward N=13, Suminoe Ward N=7. Source: MetroEngines Research & Consulting
What stands out here is Konohana Ward’s estimated settled ADR. Its June–August 2026 average of about ¥18,600 is the highest of any ward in the prefecture and 1.9 times that of Chuo Ward (about ¥9,800). Backed by USJ demand, a price range distinct from central Osaka has already formed. The 2,500 rooms of the Yumeshima IR will land in an area where this price tier is already established.
The Supply Cycle on Record — Construction Starts Fell From 133 Buildings in 2017 to 14 in 2023
How today’s 167,000 rooms were built up can be traced in MLIT’s “Building Construction Starts Statistics” for accommodation buildings. Construction starts for accommodation use in Osaka Prefecture jumped from 29 buildings in 2015 to 100 in 2016, peaking in 2017 at 133 buildings and 472,530㎡ of floor area. In just the four years from 2016 to 2019, a cumulative 417 buildings and 1.32 million ㎡ broke ground. A substantial portion of the current stock was set in motion during those four years.
Construction then slowed sharply: 54 buildings in 2020, 27 in 2021, 24 in 2022 and 14 in 2023 — roughly one-ninth of the 2017 peak. The four years from 2021 to 2024 totaled 83 buildings and 420,000㎡, one-fifth of the previous four years by building count and one-third by floor area. That said, 2024 saw 18 buildings with 143,401㎡ of floor area and a planned construction cost of about ¥13.89 billion, meaning the size per building rebounded significantly. The count is small, but this reads as a phase in which large projects are starting to move.
Source: Compiled by MetroEngines Research & Consulting from MLIT “Building Construction Starts Statistics” (Osaka Prefecture, accommodation use)
This trough in the supply cycle shows up directly in openings as well. Within the coverage of MetroEngines Research, new openings in Osaka Prefecture were 51 facilities and 6,524 rooms in 2024, 56 facilities and 5,503 rooms in 2025, and 42 facilities and 3,029 rooms in 2026 (still being observed). In December 2024, the 2,055-room APA Hotel & Resort Osaka Namba Ekimae Tower (アパホテル&リゾート〈大阪なんば駅前タワー〉) opened, and this single property accounts for 30% of 2024’s new rooms. A tower-type property with one of the largest room counts in western Japan pushed up that single year’s figure; put the other way, excluding it, normal opening volume has settled at the same level as 2025 and 2026.
Note that because opening data is based on confirmed OTA listings, the most recent months and years are structurally undercounted. Listings only appear a few months before opening, so the 2026 figure of 3,029 rooms is expected to rise as more listings are added. It should be read as a current observation, not a final number.
Small-Scale Inventory Shifting on a Regulatory Change — New Certification Applications Closed May 29, 2026
Another moving part on the supply side is the National Strategic Special Zone Foreign Guest Accommodation Business program, known as Special Zone minpaku (特区民泊). Following approval at the zone council meeting on November 28, 2025, Osaka City stopped accepting new certification applications, as well as change-of-certification applications such as adding rooms, as of May 29, 2026. Certification-related work at public health centers ended on June 30, 2026. However, facilities certified before that date can continue operating as before, and applications filed by May 29 that had not yet been decided are treated as certified before that date if they are subsequently approved. Inventory therefore will not disappear all at once; the decline will proceed gradually in line with the renewal and discontinuation of individual certifications. Tallying Osaka City’s published list of certified facilities gives 8,887 certified facilities as of May 31, 2026. The city’s operating-status survey counted 7,312 facilities as of the end of October 2025, which means 1,575 facilities were added in seven months, including a rush ahead of the application cutoff. When and by how much the decline will proceed depends on certification periods and each operator’s decisions, so it cannot yet be quantified with confidence. This point should be viewed with a wide margin. For where small-scale inventory is likely to flow among license types as the regulations converge, Simple Lodging × Vacant Home Reuse 2026: Kyoto, Osaka & Naha Whole-House IRR provides a three-city comparison.
In this article, “minpaku” is not limited to private lodging under the Private Lodging Business Act; it refers to listing-based short-stay inventory, including properties under the Inns and Hotels Act and Special Zone minpaku. Listing counts do not match administrative notification counts.
The Special Zone minpaku certified facility counts cited in this article are administrative certification-based figures tallied from Osaka City’s published “List of Special Zone Minpaku Facilities (as of May 31, 2026)”, not booking-site listing counts. Certification is per facility, and the list does not include a breakdown of room counts.
| Ward | Hotel etc. rooms | Special Zone minpaku certified facilities | Certified facilities per 100 rooms |
|---|---|---|---|
| Nishinari | 6,380 | 2,435 | 38.2 |
| Ikuno | 576 | 623 | 108.2 |
| Higashinari | 350 | 360 | 102.9 |
| Naniwa | 16,254 | 1,355 | 8.3 |
| Konohana | 5,439 | 396 | 7.3 |
| Chuo | 51,246 | 1,378 | 2.7 |
| Kita | 26,686 | 326 | 1.2 |
| Yodogawa | 11,073 | 170 | 1.5 |
Room counts: MetroEngines Research & Consulting (as of September 2026, registration basis). Certified facility counts tallied from Osaka City’s “List of Special Zone Minpaku Facilities (as of May 31, 2026)” (city total N=8,887 facilities). Certification is per facility, a different unit from room counts, so the ratio is shown as a normalized indicator
Normalizing the figures shows that the regulatory change affects each area by a completely different magnitude. Certified facilities per 100 hotel rooms stand at 108.2 in Ikuno Ward, 102.9 in Higashinari Ward and 38.2 in Nishinari Ward, versus just 1.2 in Kita Ward and 2.7 in Chuo Ward. In the central Kita and Minami districts, small-scale inventory has a limited presence; the impact concentrates in eastern and southern areas where existing hotel stock is thin. Conversely, these areas may see room for new hotel supply over the medium to long term. As noted above, however, the timing and scale of the decline carry a wide range, and no firm conclusion can be drawn yet.
Yumeshima IR — Three Hotels, ~2,500 Rooms: 1.5% of Prefectural Stock, +46% for Konohana Ward
The largest project on the growth side is the Yumeshima integrated resort. According to Osaka City’s published materials, it is scheduled to open around autumn 2030. It will consist of three hotels — an entertainment hotel, a multi-generational aqua resort hotel and an ultra-luxury hotel for VIPs — with a total of approximately 2,500 rooms. The initial investment is approximately ¥1.513 trillion (excluding tax), comprising approximately ¥1.195 trillion in construction-related investment and approximately ¥318 billion in other costs. The international conference center’s largest hall will seat 6,000+ people with a total capacity of about 12,000+, and the exhibition facilities will offer about 20,000㎡ of exhibition space.
Different room counts are also circulating in media reports. Some materials cite a breakdown of “MGM Osaka” with 1,830 rooms, “MGM Osaka Villa” with 10 rooms and “MUSUBI Hotel” with 660 rooms for a total of 2,500, while others report a range of 2,375 to 2,760 rooms depending on how the facility configuration is interpreted. This article uses the “approximately 2,500 rooms” figure from Osaka City’s published materials as its baseline, while allowing for upside. On the financing side, the initial investment (approximately ¥1.513 trillion) and the amount of funds raised (approximately ¥740 billion in equity plus approximately ¥530 billion in bank loans, for approximately ¥1.27 trillion) are separate concepts; the “approximately ¥1.27 trillion” cited in media reports refers to the latter.
| Denominator | Existing rooms | ~2,500 rooms as a share | Implication |
|---|---|---|---|
| Osaka Prefecture (total) | 167,259 rooms | ~1.5% | Limited impact on prefecture-wide supply and demand |
| Osaka City (24 wards) | 141,948 rooms | ~1.8% | Equivalent to about one year of openings even citywide |
| Bay area (Konohana + Suminoe wards) | 8,065 rooms | ~31% | Large enough to change the structure at the area level |
| Konohana Ward alone | 5,439 rooms | ~46% | The ward’s room stock grows 1.5x |
Room counts: MetroEngines Research & Consulting (as of September 2026, registration basis). IR room count: Osaka City, “Integrated Resort: Osaka IR” published materials
A defining feature of this project is how much the implication changes depending on the denominator. Prefecture-wide it is about 1.5% — a volume that four years of ordinary openings could absorb. For Konohana Ward alone, however, it adds about 46% on top of the existing 5,439 rooms, expanding the ward’s room stock roughly 1.5 times. As noted above, Konohana Ward’s estimated settled ADR is already the highest in the prefecture (about ¥18,600 in summer 2026), and large-scale, high-priced inventory will be added on top of that. Pricing in the bay area is likely to form along a different axis from central Osaka. Ahead of the IR, the western bay area is also seeing other large upscale projects, such as IHG’s 817-room Osaka Sakurajima Resort next to USJ, which target a similar high-end price range.
The MICE function also cannot be overlooked. An international conference center that seats 6,000+ in its largest hall could generate lodging demand of several thousand rooms in a single day. There will likely be times when the IR’s 2,500 rooms alone cannot absorb demand during events, and the overflow will spill into hotels in central Osaka and surrounding areas. The fact that this project expands the demand base at the same time as it adds supply sets it apart from other new openings.
The Pipeline in Between — 2027–2029 Looks Thin for Now
How many rooms will be added outside the IR over the four years from 2026 to 2030? Taking inventory of accommodation-use plans in Osaka Prefecture using building-permit-application data based on MLIT’s “Building Dynamics Statistics”, the following is confirmed as of now.
| Completion / scheduled opening | Project | Rooms | Data basis |
|---|---|---|---|
| 2024 (actual) | 51 new openings | 6,524 rooms | Confirmed OTA listings |
| 2025 (actual) | 56 new openings | 5,503 rooms | Confirmed OTA listings |
| 2026 (in progress) | 42 new openings | 3,029 rooms | Confirmed OTA listings; expected to rise |
| February 2027 | Dojimahama, Kita Ward, Osaka City (high-rise mixed-use, 40 floors) | 220 rooms | Building permit application |
| August 2028 | Honmachi, Chuo Ward, Osaka City (13 floors) | 117 rooms | Building permit application |
| 2029 | None registered as of now | — | Will rise as applications are added |
| Around autumn 2030 | Yumeshima IR, three hotels | ~2,500 rooms | Operator and government published plans |
Source: MetroEngines Research & Consulting (confirmed OTA listings) / MLIT “Building Dynamics Statistics” / Osaka City published materials
What must be emphasized here is how to read the 2027–2029 figures. Confirmed on a building-permit-application basis are 220 rooms in 2027, 117 rooms in 2028 and zero in 2029. This does not mean “supply disappears in 2029.” Building permit applications are normally filed one to two years before opening, so slots for 2029 onward simply have not been applied for yet. The future-year figures in this table should be read as the floor of the currently confirmed pipeline. Both project counts and room counts are expected to rise as more applications are filed.
2027 onward is a floor based on building permit applications. Source: MetroEngines Research & Consulting (confirmed OTA listings) / MLIT “Building Dynamics Statistics” / Osaka City published materials
With that caveat, the implication relative to recent actuals is clear. Against a pace of 6,524 rooms opened in 2024 and 5,503 in 2025, confirmed supply for 2027 and 2028 totals just 337 rooms. The 2016–2019 construction boom was digested as openings in 2019–2024, and the subsequent slowdown in construction starts is now surfacing as thinner openings from 2027 — the time lag of the construction cycle showing up directly. Even if additional applications bring annual supply to 2,000–3,000 rooms, it may not reach the recent three-year average (around 5,000 rooms per year). It is reasonable to expect a phase of slower supply growth in the years leading up to the IR’s 2030 opening. Whether new supply actually affects rates, however, depends on market size. Our analysis Does New Hotel Supply Cut ADR? Only Below 13,000 Rooms, 47 Prefectures tests this across the country and finds that in large markets like Osaka, the impact of added supply on rates is limited.
Where Demand Stands — Estimated OCC Holds at 85.9% as Rates Return to Pre-Expo Levels
Before discussing supply, let’s confirm where demand stands. Osaka Prefecture’s estimated OCC in August 2026 was 85.9% (covering 723 facilities and 111,012 rooms). July was 86.5% (698 facilities and 110,295 rooms). This is a high occupancy level for the summer season. By category, capsule hotels ran at 98.0%, deluxe hotels at 91.6%, city hotels at 89.4% and business hotels at 83.9% — the higher the price tier, the tighter the inventory.
What about rates? Osaka Prefecture’s estimated settled ADR in August 2026 was ¥9,100 (N=653 facilities), down 32.7% from ¥13,500 in the same month a year earlier. July was −30.7% and June −32.3%, so declines of around 30% persisted throughout the summer. However, April–October 2025, the denominator for these YoY comparisons, was the period of Expo 2025 Osaka, Kansai, when rates were at extremely high levels.
Compared with pre-Expo 2024, the picture changes. August 2026’s ¥9,100 is −4.0% versus ¥9,400 in August 2024; July is −1.3% and June −4.1%. Over the summer, rates are essentially flat versus 2024. Looking at spring, April 2026 was +5.1% versus April 2024 and May +7.6%, while January was as much as +13.7% — so quite a few months actually exceeded pre-Expo levels. In other words, the current YoY declines are an adjustment as the one-off Expo effect falls away, not a sign that underlying demand has weakened below 2024.
Estimated settled ADR (tax-exclusive equivalent). N=607–653 facilities per month, Osaka Prefecture. September 2026 onward is estimated from listing levels at the time of the survey. Source: MetroEngines Research & Consulting
Macro demand indicators are also solid. Total guest nights in Osaka Prefecture reached a record 57.6 million in 2025, and according to the Osaka Convention & Tourism Bureau, inbound visitors hit a record 17.6 million in 2025, with a target of more than 18 million for 2026. A structure in which occupancy holds in the 85% range while only rates converge back to pre-Expo levels suggests prices have adjusted ahead of demand. If this coincides with the slower supply growth of 2027–2029, rates are more likely to have room to recover. The ~2,500 rooms the IR adds in 2030 are a volume that lands within this absorption capacity.
⚠ Note on ADR for future dates: ADR for September 2026 onward in this article is estimated from selling prices published on booking sites at the time of the survey and will change as check-in dates approach. Please note that prices currently set high may be lowered through last-minute adjustments, and conversely may rise as inventory sells through.
Supply Scenarios and Absorption Capacity — Three Ranges, and ADR × OCC Sensitivity
Connecting supply and demand into a single line requires reading the numbers with a range. Confirmed building-permit-based supply is just 220 rooms in 2027 and 117 rooms in 2028, but these are floors that will rise as applications are added. We therefore set three scenarios for annual non-IR supply over the four years from 2027 to 2030, and calculated the cumulative total with the Yumeshima IR’s ~2,500 rooms booked entirely in 2030.
| Scenario | Annual non-IR supply | 4-year total (excl. IR) | Total incl. IR | vs. current stock | Annualized |
|---|---|---|---|---|---|
| Low | 500 rooms/yr | 2,000 rooms | 4,500 rooms | 2.7% | 0.67% |
| Mid | 2,000 rooms/yr | 8,000 rooms | 10,500 rooms | 6.3% | 1.57% |
| High | 3,000 rooms/yr | 12,000 rooms | 14,500 rooms | 8.7% | 2.17% |
| (Reference) Recent 3-year pace continues | 5,019 rooms/yr | 20,075 rooms | 22,575 rooms | 13.5% | 3.37% |
Current stock = 167,259 rooms (as of September 2026, registration basis). The low scenario is close to the confirmed building-permit-based figures; the mid and high scenarios reflect the 2,000–3,000 rooms per year discussed in the text; the reference row assumes the 2024–2026 average (5,019 rooms per year) continues. Source: HotelBank Editorial Team estimates based on MetroEngines Research & Consulting and Osaka City published materials
In all three scenarios, annualized supply growth stays below the recent three-year actual pace (equivalent to 3.37% per year). At the mid scenario’s 1.57% per year, room stock would be around 178,000 in 2030. Even including the IR, that does not amount to the kind of supply pressure created by the 2016–2019 construction boom. Put the other way, these four years of slower supply growth are a window existing stock can use to rebuild rates.
That said, the IR’s 2,500 rooms will not have an even effect. Narrow the denominator to the area level, and the same 2,500 rooms become a very different quantity. The following table mechanically calculates how far occupancy would be diluted assuming flat demand.
| Denominator | Current rooms | After adding IR | Demand growth needed to hold occupancy | Occupancy level under flat demand |
|---|---|---|---|---|
| Konohana Ward | 5,439 rooms | 7,939 rooms | +46.0% | 68.5% |
| Bay area (Konohana + Suminoe wards) | 8,065 rooms | 10,565 rooms | +31.0% | 76.3% |
| Osaka City (24 wards) | 141,948 rooms | 144,448 rooms | +1.8% | 98.3% |
| Osaka Prefecture (total) | 167,259 rooms | 169,759 rooms | +1.5% | 98.5% |
“Occupancy level under flat demand” is a mechanical calculation (current rooms ÷ rooms after addition) of what percentage of the current level occupancy would fall to if lodging demand stayed as it is. In reality the IR itself generates demand, so this figure is a floor scenario. Source: HotelBank Editorial Team estimates based on MetroEngines Research & Consulting and Osaka City published materials
Prefecture-wide the figure is 98.5%, and 98.3% for Osaka City — essentially within the margin of error. For Konohana Ward alone, however, it falls to 68.5%, and to 76.3% even for the two bay-area wards combined. Holding Konohana Ward’s current occupancy would require demand to grow by 46.0%. But the Yumeshima IR includes an international conference center seating 6,000+ in its largest hall, so the demand base expands at the same time. The table above assumes “not a single additional guest,” which is a floor; the reality will land somewhere in between.
Finally, let’s look at how the combination of rate and occupancy affects revenue on two axes, using RevPAR estimated as the product of estimated settled ADR and estimated OCC. Osaka Prefecture’s actual level in August 2026 was an estimated settled ADR of ¥9,058 and estimated OCC of 85.9%, for an estimated RevPAR of about ¥7,781. The center of the table (¥9,000 × 86%) corresponds to this actual level.
| Est. settled ADR \ Est. OCC | 78% | 82% | 86% | 90% | 94% |
|---|---|---|---|---|---|
| ¥8,000 | ¥6,240 | ¥6,560 | ¥6,880 | ¥7,200 | ¥7,520 |
| ¥9,000 | ¥7,020 | ¥7,380 | ¥7,740 | ¥8,100 | ¥8,460 |
| ¥10,000 | ¥7,800 | ¥8,200 | ¥8,600 | ¥9,000 | ¥9,400 |
| ¥11,000 | ¥8,580 | ¥9,020 | ¥9,460 | ¥9,900 | ¥10,340 |
| ¥12,000 | ¥9,360 | ¥9,840 | ¥10,320 | ¥10,800 | ¥11,280 |
Estimated RevPAR = simple product of estimated settled ADR × estimated OCC, and differs from accounting RevPAR. The ADR range reflects Osaka Prefecture’s monthly actual range from January 2024 to August 2026 (¥8,070–¥13,452); the OCC range reflects the daily actual range for August 2026 (78.2–92.1%). Source: HotelBank Editorial Team estimates based on MetroEngines Research & Consulting
The takeaway is that rate has a bigger effect than occupancy. Raising OCC by 8 points from 86% to 94% lifts estimated RevPAR only from ¥7,740 to ¥8,460 (+9.3%), whereas raising ADR from ¥9,000 to ¥11,000 reaches ¥9,460 (+22.2%) at the same 86% occupancy. With occupancy plateauing in the 85% range, the remaining upside lies on the rate side. As noted above, 2026 estimated settled ADR has returned to pre-Expo 2024 levels, and 2027–2029, with slower supply growth, is a period in which conditions line up for rebuilding those rates.
White Space Toward 2030 — Where Gaps Will Open Across Price Tiers
Putting supply and demand side by side reveals the price tiers where gaps will open up heading into 2030. The key evidence is the gap between each category’s share of room stock and its estimated occupancy.
| Category | Facilities | Rooms | Share | Est. OCC | Listed price (all-plan average) |
|---|---|---|---|---|---|
| Business hotels | 453 | 73,447 | 66.2% | 83.9% | ¥11,400 |
| City hotels | 91 | 24,219 | 21.8% | 89.4% | ¥20,900 |
| Deluxe hotels | 23 | 8,318 | 7.5% | 91.6% | ¥41,600 |
| Resort hotels | 5 | 977 | 0.9% | 90.4% | ¥23,400 |
| Capsule hotels | 5 | 911 | 0.8% | 98.0% | ¥11,800 |
| Ryokan | 30 | 612 | 0.6% | 81.9% | ¥20,200 |
August 2026, Osaka Prefecture. Estimated OCC is an estimate based on OTA sales inventory. All categories total 723 facilities and 111,012 rooms. Source: MetroEngines Research & Consulting
August 2026, Osaka Prefecture (N=723 facilities, 111,012 rooms). Source: MetroEngines Research & Consulting
The relationship between share and occupancy is clear. Business hotels account for 66.2% of rooms, yet their estimated OCC of 83.9% is the second-lowest of all categories. Deluxe hotels, meanwhile, hold only 7.5% of rooms but run an estimated OCC of 91.6%, 5.7 points above the overall average of 85.9%. The higher the tier, the thinner and tighter the inventory. What the 2016–2019 construction boom mainly built was limited-service hotels, and the result is today’s 66% versus 7.5% mix.
By listed price, there is exactly a twofold gap between the city hotel tier (about ¥20,900) and the deluxe hotel tier (about ¥41,600). This ¥25,000–¥40,000 range — the so-called upper-midscale tier — is the thinnest part of Osaka’s room mix. Of the three hotels the Yumeshima IR will add in 2030, the ultra-luxury VIP hotel is expected to land at the top end of the deluxe tier, with the multi-generational aqua resort hotel in its vicinity. The IR itself is not a project that thickens this upper-midscale tier.
In summary, the white space toward 2030 comes down to three areas.
| Area | Description | Supporting figures |
|---|---|---|
| 1. Upper-midscale tier Listed price ¥25,000–40,000 | There is a twofold gap between the city and deluxe tiers, leaving few options in between. The IR also lands in the upper tier, so this tier will not be filled. | The deluxe tier is 7.5% of rooms with estimated OCC of 91.6% (as of August 2026, Osaka Prefecture, N=723 facilities), 5.7 points above the overall average |
| 2. Mid tier in the bay area Konohana, Suminoe and Minato wards | The IR’s 2,500 rooms and USJ demand will thicken the upper tier, but a mid tier to absorb event-period demand will be needed at the same time. Existing stock across the three wards is thin at 9,503 rooms. | Konohana Ward’s estimated settled ADR is about ¥18,600, the highest in the prefecture and 1.9x that of Chuo Ward |
| 3. Room supply in eastern and southern areas Ikuno, Higashinari, Nishinari wards and others | Areas where small-scale inventory carries significant weight. The regulatory change may open room for supply over the medium to long term, but timing and volume should be viewed with a wide range. | Certified facilities per 100 rooms: Ikuno Ward 108.2, Higashinari Ward 102.9 (Kita Ward 1.2) |
Source: Compiled by HotelBank Editorial Team from MetroEngines Research & Consulting and Osaka City published materials
A note on construction cost assumptions as well. According to MLIT’s “Building Construction Starts Statistics”, accommodation construction in Osaka Prefecture in 2024 totaled 18 buildings and 143,401㎡ of floor area with a planned construction cost of about ¥13.89 billion — about ¥97,000 per ㎡ (about ¥320,000 per tsubo). Hotel construction costs nationwide rose sharply from 2022 to 2024, so this level rests on different assumptions than the 2016–2019 boom. Rising construction costs raise the bar for new entrants while also increasing the scarcity value of existing stock. Combined with the outlook for slower supply in 2027–2029, this reads as a phase in which existing properties have more room to raise rates.
Summary
Osaka’s room stock stands at 167,000 rooms, with 84.9% inside Osaka City and 56.3% concentrated in Chuo, Kita and Naniwa wards. The 2016–2019 construction boom (417 buildings and 1.32 million ㎡ in four years) created this structure, and the subsequent slowdown in construction starts (14 buildings in 2023) is beginning to surface as thinner openings from 2027. Confirmed building-permit-based supply is just 220 rooms in 2027 and 117 rooms in 2028, far below the recent three-year pace of around 5,000 rooms per year. These are floors, however, and will rise as applications are added.
Beyond that lies the Yumeshima IR, due around autumn 2030. Its three hotels and ~2,500 rooms are just 1.5% of the prefecture and 1.8% of Osaka City, but add about 46% for Konohana Ward alone. At the same time, an international conference center seating 6,000+ in its largest hall will expand the demand base, making this a project where supply and demand grow together.
On the demand side, estimated OCC is holding at 85.9% (August 2026), and estimated settled ADR has returned to 2024 levels as the one-off Expo effect falls away. Rates having adjusted while occupancy stays high means absorption capacity remains heading into the slower supply growth of 2027–2029.
The open price tiers are the upper-midscale tier at listed prices of ¥25,000–40,000, and the mid tier in the bay area. The IR lands in the upper tier, and the middle layer that will absorb event and tourism demand around it has ample room to thicken toward 2030. From an investment and development perspective, this is a phase in which designs targeting the trough in the room mix are more effective than chasing room count.
Related Articles
- Osaka Settled ADR June 2026: City -26.3%, Business -32.8% Post-Expo
- Osaka City vs Business Hotels: 1.49x ADR Gap Explained by Meals
- Simple Lodging × Vacant Home Reuse 2026: Kyoto, Osaka & Naha Whole-House IRR
- Does New Hotel Supply Cut ADR? Only Below 13,000 Rooms, 47 Prefectures
- Tokyo 23 Wards Supply Pressure 2026: Arakawa 16.0%, Minato Just 4.5%
References and Sources
■ Data Sources
Room stock, estimated settled ADR, estimated OCC and new openings are from MetroEngines Research & Consulting OTA published price and inventory data (Osaka Prefecture room stock N=2,523 facilities; estimated settled ADR N=607–653 facilities per month; estimated OCC for August 2026 N=723 facilities and 111,012 rooms; new openings based on confirmed OTA listings). Supply history and plans are from MLIT’s “Building Construction Starts Statistics” (2011–2024) and “Building Dynamics Statistics” (building permit application basis). Yumeshima IR and Special Zone minpaku data are from Osaka City published materials.
■ Estimation Assumptions
The supply scenarios set annual non-IR supply at 500 rooms (low), 2,000 rooms (mid) and 3,000 rooms (high), and book the Yumeshima IR’s ~2,500 rooms entirely in 2030 on top of four years of supply. The reference row assumes the 2024–2026 average (5,019 rooms per year) continues. The absorption table is a mechanical calculation assuming flat demand (current rooms ÷ rooms after addition) and does not factor in demand generated by the IR itself. Estimated RevPAR is the simple product of estimated settled ADR × estimated OCC. The ADR axis reflects the monthly actual range from January 2024 to August 2026, and the OCC axis reflects the daily actual range for August 2026.
■ Limitations and Caveats
Estimated settled ADR and estimated OCC are both estimates based on public OTA information and differ from each property’s actual results and accounting figures. New opening data is not a complete census, and more recent years are structurally undercounted. The pipeline for 2027 onward will increase as building permit applications are added, so the figures in this article are floors. Special Zone minpaku certified facility counts are per facility, do not include room breakdowns, and are in a different unit from hotel room counts. When and by how much certifications decline depends on certification periods and each operator’s decisions, and cannot yet be quantified with confidence.
■ Market Data
- MetroEngines Research & Consulting — room stock (as of September 2026, registration basis, Osaka Prefecture N=2,523 facilities), estimated settled ADR (N=607–653 facilities per month), estimated OCC (August 2026 N=723 facilities, 111,012 rooms), new openings (confirmed OTA listings)
■ Government Statistics and Public Data
- e-Stat, “Building Construction Starts Statistics” (Statistics ID: 0003114490, Osaka Prefecture, accommodation use, 2011–2024)
- MLIT, “Building Dynamics Statistics” (plan data based on building permit applications)
- Osaka City, “Integrated Resort: Osaka IR” (統合型リゾート 大阪IR) (three hotels, ~2,500 rooms, initial investment ~¥1.513 trillion, international conference center scale, scheduled to open around autumn 2030)
- Osaka City, “End of New Applications for the Osaka City National Strategic Special Zone Foreign Guest Accommodation Business” (Japanese) (applications closed May 29, 2026; treatment of existing certified facilities)
- Osaka City, “About Lodging Facilities Such as Minpaku” — List of Special Zone Minpaku Facilities (as of May 31, 2026) (Japanese) (tallied for this article, N=8,887 facilities)
- Osaka City, “Results of the Operating-Status Survey of Special Zone Minpaku Facilities” (Japanese) (7,312 facilities as of end-October 2025; response rate 79.6%)
- Osaka City, “Osaka City National Strategic Special Zone Foreign Guest Accommodation Business (Special Zone Minpaku)” (Japanese)
- Osaka City, “Citizens’ Voices” — On the policy to end new Special Zone minpaku applications (Japanese)
■ News and Press Releases
- “Osaka Prefecture’s 2025 guest count hits record 57.6 million as Expo boosts domestic travelers” (Nikkei, Japanese)
- “One of western Japan’s largest: 2,055-room APA Hotel & Resort Osaka Namba Ekimae Tower opens today” (APA Hotel Co., Ltd., December 2, 2024, Japanese)
- “Mitsui Garden Hotel Osaka Dojimahama Premier (三井ガーデンホテル大阪堂島浜プレミア) to open February 26, 2027 in Osaka City — a 220-room high-rise hotel” (AMP, August 26, 2026, Japanese)
- “Osaka IR breaks ground on Yumeshima — full-scale start toward autumn 2030 opening” (MICE TIMES ONLINE, Japanese)
- “Osaka IR plan certified: MICE facilities and hotels with 2,500 total rooms” (Kanko Keizai Shimbun, Japanese)