


According to MetroEngines Research, 24 lodging properties with 1,033 rooms opened in Okayama Prefecture in 2026 (including openings scheduled for December). A single building accounts for 600 of those rooms (58.1%): APA Hotel & Resort Okayama Ekimae Shinkansenguchi (アパホテル&リゾート〈岡山駅新幹線口〉), which opened on August 6 on the Shinkansen-exit side of Okayama Station. This article breaks the 24 properties down by opening type, then tests how this large block of supply, which lifted room stock within 1km of the station by more than 10%, was absorbed over the three months after opening, using existing hotels’ ADR, booking curves and occupancy based on OTA-listed inventory. It closes with an assessment of the remaining development opportunity.
• ADR (average daily rate) = an estimated settled rate (tax-excluded equivalent), calculated by applying a segment-specific adjustment factor to the lowest-plan rate each property publishes on OTAs (per room, two guests per room, tax included). Checked against property-level results disclosed by listed hotel REITs (91 properties, most recent 3 months), the median error is about 7%. These are estimates and differ from each property’s actual settled prices and accounting figures.
• Area-level ADR (prefecture / municipality) is the median of the estimated settled rates of the properties covered (the level of a typical property in the area).
• Where listed prices are mentioned, they are per-room rates for two guests per room (tax included).
• OCC (occupancy) = rooms sold as a share of total rooms in the area (an estimate based on OTA sales inventory).
• Source: MetroEngines Research (continuous tracking of OTA published rates for approx. 168,000 properties in Japan, of which approx. 27,000 are confirmed active)
Room stock in this article covers lodging properties with 10 or more rooms within a 1,000m radius of Okayama Station (excluding leisure/love hotels). “Active” means a property whose selling prices were confirmed on major booking sites in the most recent three months (September–November 2026) (as of November 14, 2026; compiled by MetroEngines Research).
Booking curve = the trend in remaining OTA rooms leading up to the check-in date. LT (lead time) = days until check-in. Occupancy in this article is “occupancy (OTA-listed inventory basis, estimated)” — an estimate based on how inventory sold on OTAs is absorbed, and it differs from a property’s actual overall occupancy. Counts of new openings and rooms are based on confirmed OTA listings. MetroEngines Research tracks approx. 168,000 properties in Japan and analyzes approx. 27,000 properties (approx. 1.26 million rooms) confirmed as active on OTAs.
The bottom line: Okayama Prefecture’s 2026 supply is polarized between “one large station-front building” and “small properties scattered across the prefecture.” Excluding two properties confirmed as reopenings or renewals, net new supply is 22 properties and 877 rooms. Meanwhile, the estimated settled ADR of the 33 existing properties (5,073 rooms) within 1km of Okayama Station was roughly flat in August, the opening month (−1.8% YoY), but then ran ahead of the prior year at +9.1% in September and +5.9% in October. In other words, existing hotels held their rates even after supply that added 11.4% to the zone’s room stock — a phase in which demand absorbed the new supply.
- — 24 properties / 1,033 rooms: new openings in Okayama Prefecture in 2026 (incl. December scheduled openings; confirmed OTA listings). Net of two reopenings etc., new supply is 22 properties / 877 rooms, 68.4% of it in a single 600-room building in front of Okayama Station.
- — +11.4%: rooms within 1km of Okayama Station went from 5,271 in 2025 to 5,871 in 2026 (properties with known opening year). Nearly the same volume as the 654 rooms added over the previous eight years arrived in a single year.
- — +9.1% in September, +5.9% in October: estimated settled ADR of the 33 existing properties (5,073 rooms) within 1km of the station, median same-property YoY change. August, the opening month, was −1.8%.
- — Over 95% the day before: Kita Ward business hotels (23 properties / 3,565 rooms) had absorbed 95%+ of listed inventory one day before check-in on both October weekdays and Saturdays (OTA-listed inventory basis, estimated).
- — Break-even ADR approx. ¥11,000: the ADR a new 150-room build needs for a 6% GOP yield after building in construction inflation (assuming 80% annual occupancy) — about 15% above the zone’s October median of ¥9,500.
2026 openings: 24 properties, 1,033 rooms — 684 rooms concentrated in August, 70% of properties have 9 rooms or fewer
Let us start with the overall picture of supply. Arranging the 24 properties that opened (or are scheduled to open) in Okayama Prefecture in 2026 by month, rooms are concentrated in August with 684, followed by October (161), May (117) and December (57). In August, besides the 600-room large hotel, properties with 50 and 32 rooms opened in Kurashiki City, so this single month accounted for 66.2% of the year. The other months consisted mainly of 1–4 room vacation rentals and guesthouses, with monthly room openings in the single digits.
By size, the polarization is even clearer. Properties with 100+ rooms: 2 properties, 757 rooms; 50–99 rooms: 3 properties, 206 rooms; 10–49 rooms: 2 properties, 46 rooms; 9 rooms or fewer: 17 properties, 24 rooms. Properties with 9 rooms or fewer make up 70.8% by count, while the two 100+ room properties make up 73.3% of rooms. The same pattern appears by segment: business hotels account for 888 rooms across 4 properties (86.0% of rooms), while vacation rentals total just 10 rooms across 9 properties and guesthouses 10 rooms across 5.
| Segment | Properties | Rooms | Share of rooms |
|---|---|---|---|
| Business hotel | 4 | 888 | 86.0% |
| Ryokan | 2 | 71 | 6.9% |
| Cottage | 2 | 51 | 4.9% |
| Vacation rental | 9 | 10 | 1.0% |
| Guesthouse | 5 | 10 | 1.0% |
| Machiya / glamping | 2 | 3 | 0.3% |
| Total | 24 | 1,033 | 100.0% |
Comparing with past years puts 2026’s scale in perspective. On the same basis, new openings were 21 properties / 157 rooms in 2023, 20 / 198 in 2024 and 19 / 650 in 2025 — the number of properties has stayed around 20 a year. What changed is the size per property: in 2025 three business hotels in the 150–190 room class opened, and in 2026 the 600-room station-front building pushed the total above 1,000 rooms. For business hotels alone, the 888 new rooms in 2026 equal 9.3% of the existing 9,577 rooms across 89 properties.
The demand backdrop is also worth noting. Foreign guest nights in Okayama Prefecture for 2025 (preliminary), compiled by the prefecture from the Japan Tourism Agency’s Overnight Travel Statistics Survey, were 676,730 — up 31.7% YoY and 39.1% versus 2019, a record since the survey began. By nationality, Taiwan accounted for 285,500 guest nights (properties with 10+ employees; 45.3% share), up 65.0% from the previous year. The large station-front supply thus entered the market during an expansion in inbound demand.
Opening types of the top 6 — mostly new builds and new outlets; net new supply excluding reopenings is 877 rooms
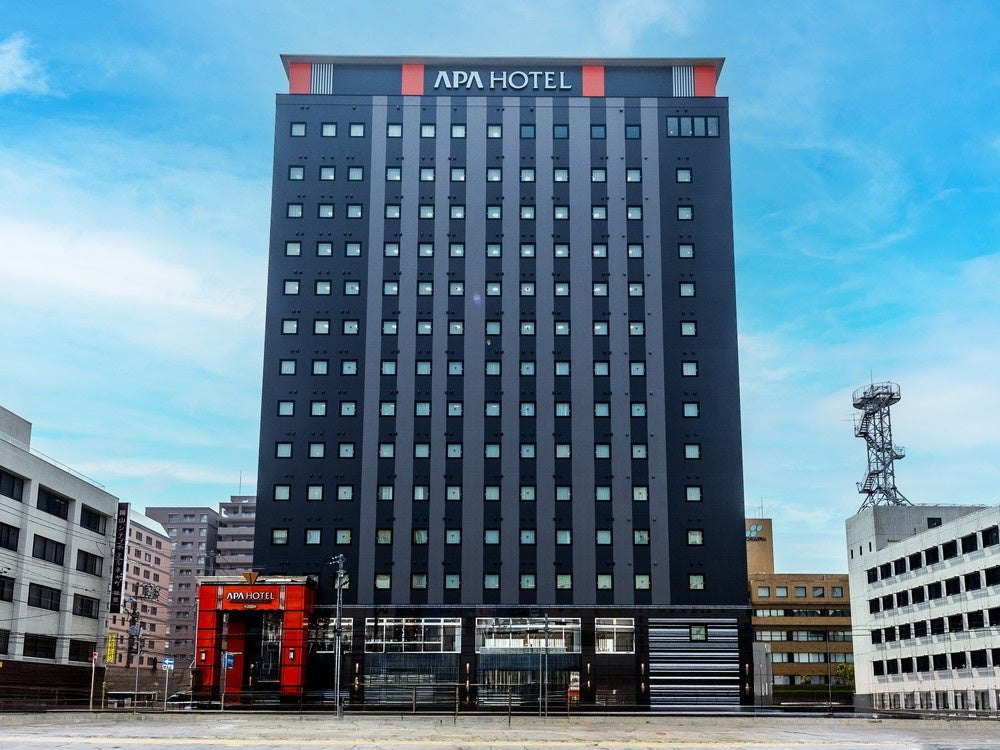
However, “new openings” based on confirmed listings also include reopenings and renewals of existing properties. We therefore checked the opening type of the six largest properties by room count against operator announcements and news reports. As the table below shows, the 600-room APA Hotel & Resort Okayama Ekimae Shinkansenguchi is a new 14-story steel-frame build, the 157-room HOTEL AZ Okayama Bizen (HOTEL AZ 岡山備前店) is a new outlet (the chain’s second in the prefecture), and the 50-room Pier Hotel Kurashiki Mizushima (ピアホテル倉敷水島) opened in August as a stand-alone container hotel.
| Property | Rooms | Opening date | Location | Segment | Opening type (as confirmed) |
|---|---|---|---|---|---|
| APA Hotel & Resort Okayama Ekimae Shinkansenguchi (アパホテル&リゾート〈岡山駅新幹線口〉) | 600 | August 6, 2026 | Kita Ward, Okayama City | Business hotel | New build (steel frame, 14 floors above ground, total floor area 12,342.71㎡) |
| HOTEL AZ Okayama Bizen (HOTEL AZ 岡山備前店) | 157 | October 15, 2026 | Bizen City | Business hotel | New outlet (second in the prefecture; 132 parking spaces) |
| Livemax Seto Ohashi Beach Resort (リブマックス瀬戸大橋ビーチリゾート) | 99 | May 1, 2026 | Kurashiki City | Business hotel | Reopening (operator announced 82 rooms in total; renewal completed July 17) |
| Oedo Onsen Monogatari Wanwan Resort Okayama Yubara (大江戸温泉物語わんわんリゾート 岡山湯原) | 57 | December 5, 2026 (scheduled) | Maniwa City | Ryokan | Renewal reopening of an existing onsen inn |
| Pier Hotel Kurashiki Mizushima (ピアホテル倉敷水島) | 50 | August 3, 2026 | Kurashiki City | Cottage | New opening (stand-alone container hotel) |
| Garden Kurashiki (ガーデン倉敷) | 32 | August 11, 2026 | Kurashiki City | Business hotel | — (no published materials confirmed) |
On the other hand, Livemax Seto Ohashi Beach Resort is a reopening — its operator announced it would “REOPEN on May 1, 2026” — and Oedo Onsen Monogatari Wanwan Resort Okayama Yubara is likewise a renewal reopening that converts an existing onsen inn into a dog-friendly-only property (for Maniwa City’s rates and demand trends, see our opening analysis of Wanwan Resort Okayama Yubara). Excluding these two properties (156 rooms in total on a listing basis), 2026 net new supply is 22 properties and 877 rooms, of which 600 rooms (68.4%) are in the single station-front building. Net new business-hotel supply is 3 properties and 789 rooms, or 8.2% of the existing 9,577 rooms — about 1pt lower than the 9.3% that includes reopenings. For gauging the supply impact on the prefecture as a whole, this net-new figure is likely closer to reality.
Of the top six, one is in Kita Ward, Okayama City, three are in Kurashiki City, and one each is in Bizen City and Maniwa City; only the 600-room building is located in front of Okayama Station. Thus, about 60% of the prefecture’s 2026 room supply is within 1km of Okayama Station, with the rest dispersed across Kurashiki’s waterfront, roadside locations and onsen towns. Below, we focus on the 1km zone around Okayama Station, where supply was concentrated, to examine absorption.
Within 1km of Okayama Station — 36 active properties / 5,698 rooms; room stock grew 11.4% in 2026
Room stock within a 1,000m radius of Okayama Station totals 58 properties and 7,102 rooms on a listing basis, of which 36 properties and 5,698 rooms are active. The active stock breaks down into 30 business hotels (4,878 rooms), 5 city hotels (810 rooms) and 1 hostel (10 rooms); 12 large properties with 201+ rooms hold 3,393 rooms, or 59.5% of the total. Over time, rooms in the zone rose only 654 over eight years, from 4,617 in 2017 to 5,271 in 2025, but in 2026 they jumped by 600 in a single year to 5,871 (6 properties / 457 rooms with unknown opening years are excluded from the annual series).
| Commercial zone, FAR 400% | 15 properties / 2,527 rooms |
| Commercial zone, FAR 500% | 8 properties / 1,008 rooms |
| Commercial zone, FAR 600% | 12 properties / 1,979 rooms |
| Commercial zone, FAR 700% | 1 property / 184 rooms |
In terms of site conditions, all 36 active properties are in commercial zones, with designated floor-area ratios (FAR) of 400% for 15 properties (2,527 rooms), 500% for 8 (1,008 rooms), 600% for 12 (1,979 rooms) and 700% for 1 (184 rooms). The area directly in front of the station’s East Exit is mainly designated 600%, while the Shinkansen-exit side and the Kuwadacho / Shimoishii areas are mainly 400% — the site of the 600-room hotel that opened in August is also in a 400% area. That hotel has a total floor area of 12,342.71㎡ on a 2,603.98㎡ site, or about 20.6㎡ of floor area per room — a high-density design built mainly around 11㎡ single and double rooms combined with 72 pairs (144 rooms) of connecting rooms.
Land prices also continue to rise. In the 2026 official land price publication, Honmachi 2-101 directly in front of the East Exit was ¥2.02 million per ㎡ (+6.3% YoY), Ekimotomachi 469-2 on the west side of the station ¥401,000 (+6.6%), Nishikimachi 8-113 ¥528,000 (+7.5%) and Shimoishii 2-chome 3-103 ¥335,000 (+8.4%). There is roughly a sixfold gap in price per ㎡ between the station front and the southwest side where the 600-room hotel stands, suggesting that the southwest side — where rooms can be stacked with a lighter land burden even at 400% FAR — became the home for large-scale development.
| Standard site | 2026 official land price (¥/㎡) | YoY | Zoning / FAR |
|---|---|---|---|
| Honmachi 2-101 | 2,020,000 | +6.3% | Commercial / 600% |
| Nishikimachi 8-113 | 528,000 | +7.5% | Commercial / 500% |
| Ekimotomachi 469-2 | 401,000 | +6.6% | Commercial / 500% |
| Shimoishii 2-chome 3-103 | 335,000 | +8.4% | Commercial / 400% |
On disaster risk, overlaying the 36 active properties on the flood inundation hazard zones (maximum assumed scale) shows 31 properties (4,591 rooms) in areas with an inundation depth of 0.5m to under 3m, and 5 properties (1,107 rooms) in areas of 3m to under 5m. Because all 36 active properties are located inside flood hazard zones, new developments should build the floor placement of electrical and mechanical equipment and the use of the ground floor into the design conditions from the outset.
Absorption test 1: rates — ADR of 33 existing properties +9.1% in September and +5.9% in October; −1.8% in the opening month of August
So how did the 600 rooms of new supply show up in surrounding rates? First, looking at the area-wide level — the estimated settled ADR (median of covered properties) for Kita Ward, Okayama City — August 2026 was ¥9,200, up 5.8% from ¥8,700 a year earlier; September was ¥8,600, up 12.9%; and October was ¥9,300, up 19.1% from ¥7,800 (46–50 properties covered). All three months after the opening were above the prior year, with growth accelerating month by month.
However, the ward-wide median is also influenced by the level of newly added properties. Since June 2026, the number of listed properties has grown from 58 to 86–93, so the population itself has shifted, and the ward median alone cannot establish that “existing properties raised their rates.” We therefore narrowed the sample to the 33 existing active properties (5,073 rooms) within 1km of Okayama Station for which estimated settled ADR could be calculated in both 2025 and 2026, and aggregated same-property YoY changes.
On a same-property basis, too, existing properties held their rates. The median change was −1.8% in August, +9.1% in September and +5.9% in October, and the number of properties above the prior year rose from 13 in August to 25 in September and 24 in October. The October median for the 33 properties was ¥9,400, above ¥9,100 a year earlier. Note that September 2026 included a five-day holiday period, which tends to inflate growth, but even in October, with no long holiday, more than 70% of properties were above the prior year. There is no sign that existing properties gave up rate to fill rooms after the 600-room opening.
Let us also check rates at the new opening itself. APA Hotel & Resort Okayama Ekimae Shinkansenguchi’s estimated settled ADR was ¥9,500 in its opening month of August, ¥10,000 in September and ¥11,300 in October — about 20% above the ¥9,400 median of the zone’s 33 existing properties in October. The company announced that its pre-opening trial stay drew 12,219 applications for 400 available rooms, and the drawing power of a large property with an observation pool and large public bath is reflected in rates above the zone’s norm by the third month of operation. That the large supply entered above the median rather than at the low end of the market is likely one reason existing properties were able to hold their rates.
Absorption test 2: booking pace — Kita Ward business hotels exceeded 95% one day before on both October weekdays and Saturdays
After rates, we use booking curves to check how quickly rooms filled. The sample is 23 business hotels / 3,565 rooms in Kita Ward, Okayama City (25 properties / 3,616 rooms for November 7 and December 5; all based on major booking-site listings), and we tracked occupancy (OTA-listed inventory basis, estimated) from 45 days to 1 day before check-in.
For all three October dates, occupancy was in the 40–50% range at 45 days out and built up sharply over the final two weeks. Wednesday, October 14 went from 42.8% at 45 days out to 68.1% at 14 days, 81.8% at 7 days and 97.3% one day before (98 of 3,565 rooms remaining). Saturday, October 17 was 54.1% at 45 days, 80.8% at 14 days and 95.1% one day before (173 rooms remaining), and Wednesday, October 28 was 51.2%, 73.4% and 98.8% respectively (44 rooms remaining). In other words, even on ordinary weekdays and Saturdays after the 600 rooms were added, 95%+ of listed inventory was absorbed by the day before.
Saturday, November 7 — the night before the Okayama Marathon — had a different shape. It was already 79.5% full at 45 days out, reached 88.1% at 14 days, and then stayed flat to 87.9% one day before (439 of 3,616 rooms remaining). We also observed additional inventory being listed in the final week, suggesting that on event dates that fill early, the revenue opportunity lies in the price at which inventory returning close to arrival is resold. Saturday, December 5 had progressed to 23 days out at the time of the survey: 62.7% at 45 days, 71.2% at 30 days (1,042 of 3,616 rooms remaining) and 76.5% at 23 days — running ahead of October 17 at the same points (54.1%, 68.5%). Our framework for reading the curve at three checkpoints — 45 days, 30 days and close-in — is set out in Three Points Are Enough for a Booking Curve — An Operating Framework from Okayama Prefecture Data.
| Month (2026) | All categories occupancy (est.) | Properties / rooms covered | Business hotel occupancy (est.) | Properties / rooms covered |
|---|---|---|---|---|
| August | 86.3% | 23 properties / 2,698 rooms | 86.5% | 18 properties / 2,275 rooms |
| September | 87.3% | 26 properties / 3,230 rooms | 87.4% | 20 properties / 2,780 rooms |
| October | 90.7% | 30 properties / 4,018 rooms | 91.1% | 24 properties / 3,580 rooms |
On a monthly basis as well, Kita Ward occupancy (OTA-listed inventory basis, estimated) was 86.3% in August (23 properties / 2,698 rooms), 87.3% in September (26 / 3,230) and 90.7% in October (30 / 4,018). Because the number of covered properties grows each month, a simple month-to-month comparison is not possible, but occupancy held at 90% even in October, when coverage expanded to around 4,000 rooms. Since our estimated occupancy has only been accumulated from spring 2026 onward and cannot yet be compared YoY, we limit ourselves here to confirming the level — “occupancy stayed high after the opening.”
Positioning — only one property at ¥12,000+ with 100 rooms or fewer; just one 600-room-class building in the zone
To consider where the next development opportunity lies, we plotted the zone’s active properties by room count and rate. For the 35 properties whose October 2026 estimated settled ADR could be calculated, the bottom quartile was ¥8,000, the median ¥9,500 and the top quartile ¥12,200. Nine properties are at ¥12,000 or more, but eight of them are mid-to-large properties with 108–329 rooms; only one property with 100 rooms or fewer sits at ¥12,000+, a small 15-room property.
Crowded Occupied territory
¥4,500–11,000 × 30–220 rooms
19 of the 35 properties cluster here, mainly limited-service hotels within walking distance of the station. New entrants would need to differentiate on location and facilities.
WS1 Small/mid-size upper tier
¥12,000–17,000 × 50–100 rooms
Zero properties. The eight properties at ¥12,000+ all have 108+ rooms, leaving little supply of small-to-mid-size properties with more generous room sizes.
WS2 Large, group-friendly
¥10,000+ × 350+ rooms
Only the 600-room building opened in 2026. A design that captures 3–4 guest stays through connecting rooms is rare in the zone.
What this distribution shows is that supply in the zone is thick in “100–300 room limited-service hotels,” with gaps outside that band. The 600-room new build filled one of those gaps with an unprecedented scale for the zone and group capacity through 72 pairs of connecting rooms. The other gap — the 50–100 room, ¥12,000+ band — is a size that can work even on a small site with 400% FAR, and merits consideration as the next development theme.
Next supply — 177 rooms in March 2027, and a further 300 rooms planned in a redevelopment
Supply does not end with 2026. In the OKAYAMA GATE PLACE redevelopment near the station’s East Exit, HOTEL NEMUS OKAYAMA by CLEMENT (177 rooms), the first property of a new JR Shikoku Group brand, is scheduled to open on March 20, 2027 (we cover that hotel’s planned figures and supply-demand within 1km of the station in our analysis of the HOTEL NEMUS OKAYAMA opening). In addition, building-plan data list a 300-room hotel, scheduled for completion at the end of 2028, in an urban redevelopment project in Nodayacho 1-chome, Kita Ward, Okayama City (residential, hotel and retail; 12 floors above ground). Together, these two projects’ 477 rooms equal 8.4% of the current active stock of 5,698 rooms.
If 477 rooms are added within just over two years after 2026’s 600, room count in the zone will be about 20% above the end-2025 level. So far, our tests show that existing properties’ rates and listed-inventory absorption held up after the 600-room opening. However, we could only test the three months of August–October, which fall in the peak demand season; whether the same pattern holds on winter weekdays, when demand softens, needs to be confirmed with future finalized data.
Simple development scenario estimate — a new 150-room build yields 4.8–5.4%; break-even ADR is about ¥11,000
Finally, we run a simple estimate of the economics of a new build in the zone under three scenarios. ADR is set from the zone’s actual rate bands: A uses ¥8,700, the median of active properties’ trailing 12-month averages; B uses ¥12,000, the lower bound of WS1; and C uses ¥15,000, assuming group-friendly rooms. Occupancy is assumed at 80% annually in all three cases. Construction cost is ¥2.405 million per tsubo for steel-frame (S) hotels/ryokan in 2025, based on MLIT’s Building Construction Starts Statistics, and land is valued at the Shimoishii 2-chome official land price of ¥335,000/㎡, assuming full use of 400% FAR. The GOP ratio is set at 35–40%, bracketing the 38.9% GOP ratio (fiscal period ended December 2024) disclosed by Invincible Investment Corporation for its 91 domestic properties operated by MHM.
| Item | A. Limited-service, 150 rooms Base | B. Upper tier, 100 rooms | C. Group-friendly, 120 rooms |
|---|---|---|---|
| Rooms | 150 | 100 | 120 |
| Room size / total floor area | 15㎡ / 3,462㎡ | 22㎡ / 3,548㎡ | 28㎡ / 5,600㎡ |
| Assumed ADR | ¥8,700 | ¥12,000 | ¥15,000 |
| Occupancy (annual assumption) | 80% | 80% | 80% |
| Annual rooms revenue | ¥380 million | ¥350 million | ¥530 million |
| GOP ratio / GOP | 40% / ¥150 million | 38% / ¥130 million | 35% / ¥180 million |
| Construction cost (2025 actual, ¥2.405M/tsubo) | ¥2.52 billion | ¥2.58 billion | ¥4.07 billion |
| Land (official land price basis) | ¥290 million | ¥300 million | ¥470 million |
| Total investment / GOP yield | ¥2.81 billion / 5.4% | ¥2.88 billion / 4.6% | ¥4.54 billion / 4.0% |
| Construction cost after inflation (¥2.779M/tsubo) | ¥2.91 billion | ¥2.98 billion | ¥4.71 billion |
| Total investment / GOP yield after inflation | ¥3.20 billion / 4.8% | ¥3.28 billion / 4.1% | ¥5.18 billion / 3.6% |
At 2025 actual construction costs, the estimates give A a total investment of ¥2.81 billion and a GOP yield of 5.4%, B ¥2.88 billion and 4.6%, and C ¥4.54 billion and 4.0%. Building in cost increases during construction lowers yields further. Turner & Townsend forecasts Japanese construction cost inflation of +5.3% in 2026 and +5.0% in 2027; assuming +4.5% for 2028 (our assumption) and compounding three years of increases gives ¥2.779 million per tsubo. In that case, yields are 4.8% for A, 4.1% for B and 3.6% for C.
Working backwards, securing a 6% yield for A after inflation requires an ADR of about ¥11,000 at 80% annual occupancy. That is above the zone median of ¥9,500 and close to the ¥11,300 the 600-room 2026 opening recorded in October. Put differently, at current construction costs a new build works most readily for “a product that can command a rate roughly 15% above the zone’s norm,” and new entry by standard limited-service hotels is unlikely. Because rising construction costs work to restrain new supply, they can also be seen as an upside factor for existing properties, keeping the competitive environment relatively benign.
| Scenario A sensitivity (2025 actual basis) | Base case | ADR −10% | Occupancy −5pt | Both |
|---|---|---|---|---|
| Annual rooms revenue | ¥380 million | ¥340 million | ¥360 million | ¥320 million |
| GOP | ¥150 million | ¥140 million | ¥140 million | ¥130 million |
| GOP yield | 5.4% | 4.9% | 5.1% | 4.6% |
On sensitivity, Scenario A’s yield falls to 4.9% if ADR drops 10%, to 5.1% if occupancy drops 5pt, and to 4.6% if both occur. Yield swings more with rate, so deciding at the development stage “which price tier the product targets” matters more to the economics than aiming for upside in occupancy. Note also that official land prices differ from actual transaction prices, and sites closer to the station front will carry a heavier land burden than assumed here.
In addition to the single-variable sensitivity, we also show a two-variable table moving ADR and occupancy together (Scenario A, 2025 actual construction cost basis, with total investment fixed at ¥2.81 billion and GOP ratio at 40%). Of the 25 combinations, 8 reach a yield of 6% or more (in blue); at the base ADR of ¥8,700, occupancy must rise to 90% to reach just 6.1%. Holding occupancy at 80% requires an ADR of about ¥9,600 (+11%), so raising occupancy by 10pt and raising ADR by just over 10% have roughly the same effect. As noted above, building in construction-period inflation raises the ADR needed for the same 6% to about ¥11,000.
| ADR \ Occupancy (annual) | Occupancy 70% | Occupancy 75% | Occupancy 80% | Occupancy 85% | Occupancy 90% |
|---|---|---|---|---|---|
| ADR ¥7,830 (-10%) | 4.3% | 4.6% | 4.9% | 5.2% | 5.5% |
| ADR ¥8,265 (-5%) | 4.5% | 4.8% | 5.2% | 5.5% | 5.8% |
| ADR ¥8,700 (base) | 4.7% | 5.1% | 5.4% | 5.8% | 6.1% |
| ADR ¥9,570 (+10%) | 5.2% | 5.6% | 6.0% | 6.3% | 6.7% |
| ADR ¥10,440 (+20%) | 5.7% | 6.1% | 6.5% | 6.9% | 7.3% |
Summary — supply is “one large building + many small ones”; next focus is finalized winter data and the 177 rooms in March 2027
To sum up: Okayama Prefecture had 24 new openings with 1,033 rooms in 2026; net of the two properties confirmed as reopenings or renewals, net new supply was 22 properties and 877 rooms, 68.4% of which was the 600-room building in front of Okayama Station. Room stock within 1km of Okayama Station rose 11.4% in a year, yet the estimated settled ADR of the 33 existing properties, compared on a same-property basis, was above the prior year at +9.1% in September and +5.9% in October, and Kita Ward business hotels had absorbed 95%+ of listed inventory by the day before on both October weekdays and Saturdays.
There are three implications for operators. First, even right after a large supply addition, typical properties in the zone have been able to hold their rates. Rather than discounting to fill rooms early, it is effective to revise prices step by step from 14 days out, based on a curve in which weekday occupancy builds by 25–29pt over the final two weeks. Second, on dates like the night before an event, when 80% is filled by 45 days out, there is a revenue opportunity in reselling inventory that returns close to arrival. Third, with supply continuing — 177 rooms in March 2027 and 300 more after that — operators should verify the persistence of absorption with finalized winter data and regularly check where their own property sits in the zone’s price and size bands.
From an investment and development perspective, the ADR at which a new build works at current construction costs is about ¥11,000, roughly 15% above the zone median. How to design “products that can command above-standard rates” — such as the vacant 50–100 room, ¥12,000+ band or group-friendly room configurations — is likely to be the next development theme in front of Okayama Station.
⚠ Note on ADR for future dates: ADR in this article is the average of selling prices published on OTAs at the time of the survey and will change as check-in dates approach. Prices currently set high may fall with last-minute discounting. The December 5 booking curve reflects progress as of the survey date (November 13, 2026) and will change with future bookings and inventory additions.
Related Articles
References and Sources
■ Data sources
OTA published rates and listed inventory continuously tracked by MetroEngines Research & Consulting (new openings based on confirmed OTA listings; estimated settled ADR is an estimate obtained by applying a segment-specific adjustment factor to the lowest plan; occupancy is an estimate based on absorption of OTA-listed inventory); MLIT Real Estate Information Library (zoning, official land prices 2026, flood inundation hazard zones); Building Construction Starts Statistics (2025 steel-frame cost per tsubo); Building Dynamics Statistics Survey (plans on a building-permit application basis); Okayama Prefecture / Japan Tourism Agency Overnight Travel Statistics Survey; company announcements and news reports.
■ Estimate assumptions
ADR for the three new-build scenarios was set from the zone’s actual rate bands (A ¥8,700 = median of active properties’ trailing 12-month averages; B ¥12,000; C ¥15,000). Occupancy is assumed at 80% annually for all three; GOP ratio 35–40%. Construction cost is ¥2.405 million per tsubo for 2025 steel frame; after inflation, ¥2.779 million per tsubo, compounding +5.3% for 2026, +5.0% for 2027 and +4.5% for 2028. Land uses the Shimoishii 2-chome official land price of ¥335,000/㎡, assuming full use of 400% FAR. GOP yield = GOP ÷ (construction cost + land), excluding FF&E, pre-opening costs, interest and taxes.
■ Limitations and caveats
The absorption test is limited to the three months of August–October 2026, which fall in the peak demand season, and September includes a five-day holiday period. Because occupancy data have only been accumulated since spring 2026, YoY comparisons are not possible. The Kita Ward, Okayama City median includes a population change, as the number of listed properties grew from 58 to 86–93 from June 2026. Room counts for new openings are based on confirmed listings and may differ from operator announcements (Livemax Seto Ohashi Beach Resort: 82 rooms announced, 99 listed). Official land prices differ from actual transaction prices.
■ Market data
- MetroEngines Research & Consulting — new opening data (confirmed OTA listings, Okayama Prefecture 2026 N=24 properties), estimated settled ADR (Kita Ward, Okayama City N=46–50 properties; within 1km of Okayama Station N=35 properties), booking curves and occupancy (OTA-listed inventory basis, estimated), room stock (within 1km of Okayama Station: 58 listed, 36 active), building-plan data (MLIT Building Dynamics Statistics Survey, building-permit application basis)
■ Government statistics and public data
- MLIT Real Estate Information Library — zoning, official land prices (2026), flood inundation hazard zones (maximum assumed scale)
- Japan Tourism Agency, Overnight Travel Statistics Survey
- Okayama Prefecture Tourism Division, “Overnight Travel Statistics Survey: Foreign Guest Nights in Okayama Prefecture (2025 annual and October–December, preliminary)” (March 6, 2026)
- MLIT, Building Construction Starts Statistics Survey
■ REITs and industry reports
- Invincible Investment Corporation, hotel portfolio (domestic hotel GOP results)
- archi-book, “Cost per tsubo by structure and use based on Building Construction Starts Statistics, 2025 edition”
- Turner & Townsend, “Trends shaping Japan’s construction market in 2026” (March 12, 2026)
■ News and press releases
- APA Group, “600-room APA Hotel & Resort Okayama Ekimae Shinkansenguchi opens today” (PR TIMES, August 6, 2026)
- KSB Setonaikai Broadcasting, “APA Hotel opens its second building in central Okayama City” (August 6, 2026)
- AMEIZ, “HOTEL AZ Okayama Bizen opens October 15, 2026” (PR TIMES)
- Live Max, “Livemax Seto Ohashi Beach Resort renewal completed and open” (PR TIMES)
- GENSEN HOLDINGS, “Oedo Onsen Monogatari Wanwan Resort Okayama Yubara opens December 5, 2026” (press release)
- Tetsudo Channel, “HOTEL NEMUS OKAYAMA by CLEMENT grand opening on March 20, 2027”
Further Reading
- Wanwan Resort Okayama Yubara opens December 5 — Maniwa City January ADR ¥14,800 and 84.6% occupancy; sixth dog-friendly property in a prefecture with 19 pet-friendly inns
- Three Points Are Enough for a Booking Curve — An Operating Framework at 45 Days, 30 Days and Close-in from Okayama Prefecture Data
- Okayama business hotels in September excluding holidays: Wednesday 94.2%, Sunday 79.4% — day-of-week tactics that also fill the Friday 88.0% dip
- Kagawa hotel openings 2026: of 686 rooms, net new supply is 316 rooms in Kanonji and Miki — two Takamatsu buildings are conversions
- Okinawa hotel openings 2026: 104 properties, 2,950 rooms — 1,850 net new; 4 of 8 properties with 200+ rooms (1,100 rooms) are rebrands
- Why are Okayama hotels expensive? 13 of 83 days are peak-rate days — a four-tier structure of municipal rates