

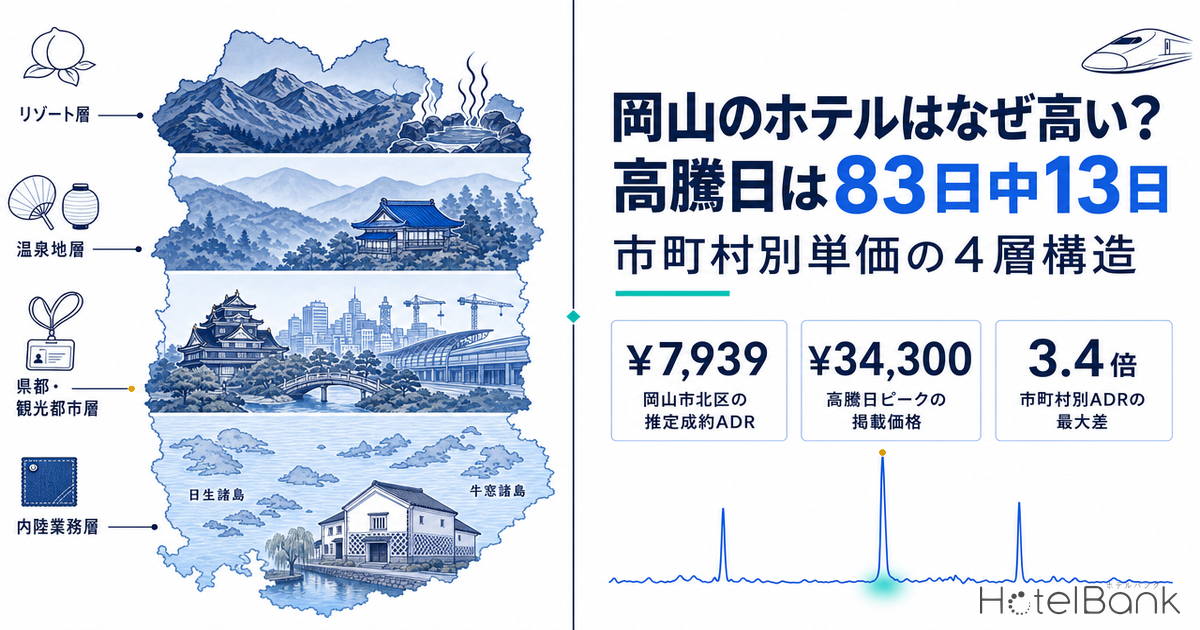
Two things are true at once about Okayama’s hotel rates: the perception that they are expensive, and data saying they are cheap. MetroEngines Research puts the estimated settled ADR for Okayama Prefecture as a whole in the ¥8,300 range on a trailing 12-month average — mid-pack among the five Chugoku prefectures. Yet in Kita Ward of Okayama City, the prefectural capital, listed prices jump to more than 2.5 times their normal level on a handful of specific dates. This article breaks Okayama’s municipal rates into four tiers, uses daily data to pinpoint where “the days Okayama hotels get expensive” are concentrated, and tests how far the redevelopment underway around Okayama Station could lift the capital’s price hierarchy.
Metric Definitions Used in This Article
- ADR (average daily rate): An estimated settled rate (tax-exclusive equivalent), calculated by applying a property-type correction factor to the cheapest plan level each property publishes on OTAs and similar channels (two guests per room, per-room rate, tax included). Cross-checked against property-level results disclosed by listed hotel REITs (91 properties, trailing three months), the median error is about 7%. These are estimates and differ from each property’s actual transacted rates and accounting figures. Area-level ADR is the median of the properties covered (the level of a typical property in that area).
- Listed price: The average of all plans published on OTAs and similar channels (two guests per room, per-room rate, tax included). Because it spans room-only through meal-inclusive plans, it sits above the estimated settled ADR. Wherever this article says “listed price,” it refers to this figure.
- OCC (occupancy rate): The share of sold rooms against total rooms in the area (an estimate based on OTA sales inventory). Because it is derived from how inventory listed on OTAs is absorbed, it differs from a property’s actual overall occupancy.
- LT (lead time): Days remaining until check-in. LT0 = same day.Early sell-out LT = the lead time at which remaining rooms first hit zero (a larger value means it sold out earlier).
- Data source: MetroEngines Research
- — Okayama Prefecture’s estimated settled ADR is ¥8,300 (12-month average, September 2025–August 2026, N=190 properties). That is fourth of the five Chugoku prefectures — mid-pack — and August 2026 came in +1.2% year on year.
- — Municipal rates differ by up to 3.4x. From Bizen City at ¥20,900 down to Ibara City at ¥6,100, they separate into four tiers: resort, hot-spring, capital/tourist city, and inland business.
- — The capital is flat; Kurashiki swings. The monthly coefficient of variation is 7.4% in Okayama City Kita Ward and 10.4% in Kurashiki City. Kurashiki follows a tourist-destination curve, peaking in May and August with a trough in June.
- — The “expensive days” number 13 out of 83 (June 10–August 31, 2026). Listed prices in Okayama City Kita Ward reached as much as 2.66x the median, with academic conferences, festivals and long weekends explaining about half of them.
- — Supply within 3 km of the station grows roughly +10% by 2031. Ekimaecho adds 177 rooms, Nodayacho about 250–300, and the Shinkansen-side site 600. The upside lies in capturing peak days rather than raising normal-day rates.
Mid-Pack for Chugoku — Okayama’s Estimated Settled ADR Is ¥8,300
Start with the prefecture-level picture. MetroEngines Research puts Okayama Prefecture’s estimated settled ADR at ¥8,300 on a 12-month average from September 2025 through August 2026 (N=190 properties). Among the five Chugoku prefectures that ranks fourth, behind Shimane at ¥10,400, Hiroshima at ¥8,700 and Tottori at ¥8,600, and ahead of Yamaguchi at ¥7,500. Across the Seto Inland Sea, Kagawa sits at ¥8,000, and Hyogo to the east at ¥13,700 — leaving Okayama at what reads as the average level for the Sanyo belt. Lined up as a single catchment, the Sanyo cities do not rank by size: Onomichi’s hotel rates run about 21% above those in Hiroshima’s Naka Ward.
Comparing the most recent confirmed month, August 2026, with the same month a year earlier, Okayama was +1.2%. Across Chugoku that month, Hiroshima grew +4.4% while Tottori (−0.4%), Yamaguchi (−2.2%) and Shimane (−4.1%) all fell below the prior year. Okayama did not grow much, but it held its level while neighbouring prefectures softened. Judged on the prefectural average alone, Okayama is not an unusually expensive market.
| Prefecture | Trailing 12-mo avg ADR | Aug 2026 ADR | YoY | Properties |
|---|---|---|---|---|
| Okayama | ¥8,328 | ¥9,736 | +1.2% | 190 |
| Shimane | ¥10,381 | ¥10,942 | −4.1% | 180 |
| Hiroshima | ¥8,692 | ¥10,431 | +4.4% | 300 |
| Tottori | ¥8,619 | ¥10,078 | −0.4% | 150 |
| Yamaguchi | ¥7,543 | ¥8,573 | −2.2% | 198 |
Source: MetroEngines Research; compiled by the HotelBank Editorial Team (the trailing 12-month average is based on confirmed months from September 2025 through August 2026)
A 3.4x Municipal Gap — Okayama’s Room Rates Split Into Four Tiers
The ¥8,300 prefectural average is really just the flattened result of markets with completely different characters. Aggregating estimated settled ADR by municipality and lining up the 13 cities and towns with at least three properties covered, the range runs from Bizen City at the top with ¥20,900 down to Ibara City at the bottom with ¥6,100 — a 3.4x spread. And that distribution is not a continuous gradient: it forms four distinct tiers.
Source: MetroEngines Research; compiled by the HotelBank Editorial Team (average estimated settled ADR over confirmed months, September 2025–August 2026; the 13 cities and towns with at least three properties covered)
Tier 1 is the “seaside and mountain resort” tier, above ¥16,000. It covers Bizen City, home to the Hinase Islands, at ¥20,900 (N=3); Kagamino Town, home to Okutsu Onsen, at ¥20,100 (N=3); and Setouchi City, home to Ushimado, at ¥16,700 (N=7). All three rest on small samples, so one or two high-rate properties can move the average substantially — a caveat worth applying. Even so, the fact that the prefecture’s highest price band is concentrated in this tier does not change.
Tier 2 is the “hot-spring and near-resort” tier, between ¥11,000 and ¥13,000. It comprises Mimasaka City, home to Yunogo Onsen, at ¥12,300 (N=14); Maniwa City, home to Yubara Onsen and the Hiruzen Highlands, at ¥12,000 (N=20); and Tamano City, with Shibukawa Beach and Uno Port, at ¥11,700 (N=4). The Mimasaka Sanyu hot-spring trio (Yunogo, Yubara and Okutsu) straddles Tiers 1 and 2, which means the prefecture’s real “high-rate areas” are neither Okayama City nor Kurashiki City but the northern hot-spring cluster and the islands of the Seto Inland Sea.
Tier 3 is the “capital and tourist city” tier. It holds Kurashiki City at ¥8,500 (N=43), Soja City at ¥8,300 (N=4), Okayama City Kita Ward at ¥7,900 (N=50) and Kasaoka City at ¥7,600 (N=5). That the prefectural capital and the Bikan Historical Quarter sit in the same band may run against intuition. Kurashiki’s estimated settled ADR exceeds Kita Ward’s by only about 6%; as a tier, they are the same. What distinguishes Tier 3 is depth of supply. Kurashiki and Kita Ward alone account for 93 of the covered properties, roughly half the prefecture’s estimated-settled-ADR sample. The prefectural average converges on ¥8,300 precisely because this thick Tier 3 is its centre of gravity.
Tier 4 is the “inland business” tier, between ¥6,000 and ¥6,500. It takes in Niimi City at ¥6,400 (N=3), Tsuyama City at ¥6,300 (N=13) and Ibara City at ¥6,100 (N=4). Tsuyama is the largest city in northern Okayama and carries a sample of 13 properties, yet its rate level stays at about 80% of the capital’s. Demand is dominated by business travel — corporate trips, construction work and movement within the region — leaving little room for leisure-driven upside.
The Four-Tier Map — High Rates in the North and on the Islands, Low Rates Inland
Plotting the four tiers on a map brings out the geography of Okayama’s lodging market. The high-rate tiers split between the Chugoku Mountains in the north (Okutsu, Yubara, Yunogo) and the islands and coastline of the Seto Inland Sea (Hinase, Ushimado, Shibukawa), while the low-rate tier clusters in the inland cities along the Takahashi and Oda rivers. Tier 3, which includes the capital and the Bikan Historical Quarter, lies as a band between them.
Source: MetroEngines Research; compiled by the HotelBank Editorial Team. Note: circle size indicates the estimated settled ADR level and colour the four-tier classification. Markers are placed schematically near each municipality’s city or town hall.
| Tier | Municipality | Estimated settled ADR (12-mo average) |
Monthly CV | Properties | Main demand sources |
|---|---|---|---|---|---|
| Tier 1 Resort | Bizen City | ¥20,871 | 30.1% | 3 | Hinase and Kashirajima resorts |
| Kagamino Town | ¥20,064 | 12.8% | 3 | Okutsu Onsen | |
| Setouchi City | ¥16,726 | 13.1% | 7 | Ushimado and the Olive Garden | |
| Tier 2 Hot spring | Mimasaka City | ¥12,270 | 15.4% | 14 | Yunogo Onsen |
| Maniwa City | ¥11,968 | 13.0% | 20 | Yubara Onsen, Hiruzen Highlands | |
| Tamano City | ¥11,655 | 14.4% | 4 | Shibukawa Beach, Uno Port | |
| Tier 3 Capital / tourist city | Kurashiki City | ¥8,450 | 10.4% | 43 | Bikan Quarter, Mizushima industrial zone |
| Soja City | ¥8,326 | 16.0% | 4 | Kibiji tourism, industrial parks | |
| Okayama City Kita Ward | ¥7,939 | 7.4% | 50 | Business, conferences, events | |
| Kasaoka City | ¥7,621 | 8.9% | 5 | Kasaoka Islands, business | |
| Tier 4 Inland business | Niimi City | ¥6,422 | 6.4% | 3 | Business, regional travel |
| Tsuyama City | ¥6,320 | 7.4% | 13 | Business hub of northern Okayama | |
| Ibara City | ¥6,098 | 14.7% | 4 | Business, denim industry |
Source: MetroEngines Research; compiled by the HotelBank Editorial Team. Note: monthly CV = standard deviation of the 12 monthly estimated settled ADR values divided by their mean. A larger value means wider month-to-month swings.
The Capital Is Flat, the Bikan Quarter Swings — Monthly Curves for Kita Ward and Kurashiki
Although they share Tier 3, Okayama City Kita Ward and Kurashiki City move in entirely different ways. The monthly coefficients of variation in the table above are 7.4% for Kita Ward and 10.4% for Kurashiki — 1.4 times wider for Kurashiki. Compared in absolute ranges the gap is starker still: across the 20 months from January 2025 to August 2026, Kita Ward’s estimated settled ADR stayed within ¥7,100–¥9,200 (a 1.30x range ratio) while Kurashiki’s stretched from ¥7,000 to ¥10,700 (1.53x).
Source: MetroEngines Research; compiled by the HotelBank Editorial Team (estimated settled ADR for confirmed months; 2026 through August. Okayama City Kita Ward N=46–50 properties, Kurashiki City N=42–43 properties)
Following the shape of the curves makes the difference in character clearer still. Kita Ward runs flat through the year between the high ¥7,000s and low ¥8,000s, doing little more than forming a slight peak in August. In 2026 it moved from ¥7,500 in January to ¥9,200 in August — a range of at most ¥1,700. Where business demand forms the base, weekday occupancy holds steady all year and seasonality does not translate readily into price.
Kurashiki, by contrast, traces a textbook tourist-destination curve, with clear peaks in May and August and a trough in June. In 2026 it moved from ¥7,000 in June to ¥10,500 in August — about +50% in two months. The pattern repeated in 2025: a summer peak of ¥9,400 in June and ¥10,700 in August, falling to ¥7,900 by September. Leisure demand around the Bikan Historical Quarter and Ivy Square lifts prices, while in the off-season business demand from the Mizushima coastal industrial zone puts a floor under them — and that two-layered structure shows up as the width of the swing. For how estimated settled ADR within Okayama City moves once split by property type, see our analysis of Okayama’s city hotels and business hotels in the first half of 2026.
Year on year, August 2026 was +5.8% for Kita Ward and −2.1% for Kurashiki: Kurashiki, strong a year earlier, turned flat while Okayama City grew. Elsewhere in the prefecture, Bizen City was up +77.7%, Ibara City +27.5% and Kasaoka City +13.0%, while Tamano City (−23.3%), Mimasaka City (−21.4%) and Soja City (−14.5%) posted double-digit declines — supply and demand vary considerably from one municipality to the next. In municipalities where the covered sample is in single digits, however, a rate revision or temporary closure at one or two properties can move the average substantially.
“The Days Okayama Hotels Get Expensive” Number 13 in 83 — Conferences, Festivals, Long Weekends
Here is the heart of the matter. The fact that the capital’s estimated settled ADR sits flat in the ¥7,900 range all year contradicts the lived impression that Okayama hotels are expensive. The key to resolving that contradiction lies not in monthly averages but in the daily distribution.
For the 83 days from June 10 to August 31, 2026, we aggregated listed prices in Okayama City Kita Ward day by day (the average of all plans for that date, two guests per room, tax included). The median for the period was ¥12,900. Against that, 13 days exceeded the median by 30% or more (16% of the period) and only seven exceeded it by 50% or more (8%). In other words, the days that feel expensive in Kita Ward arrive roughly once every six days. Read the other way round, on those 13 days rates jump to between 1.3 and 2.7 times their normal level.
Source: MetroEngines Research; compiled by the HotelBank Editorial Team (June 10–August 31, 2026; daily average listed prices for Okayama City Kita Ward, N=23–24 properties and about 2,700 rooms, and Kurashiki City, N=33–37 properties and about 2,600 rooms)
The biggest spike was ¥34,300 on Thursday, June 25, 2026 — 2.66 times the period median. Occupancy that day (estimated, based on OTA-listed inventory) hit 99.9%, all but erasing Kita Ward’s inventory. The following day, Friday the 26th, stayed elevated at ¥23,600 and 98.6%. Those two dates correspond to the eve and opening of the 52nd Annual Meeting of the Japanese Orthopaedic Trauma Association (日本整形外傷学会), held at the Okayama Convention Center on Friday, June 26 and Saturday, June 27. Pre-conference night demand concentrated on the Thursday before the opening day, forming the price peak.
The next-largest spike was ¥32,300 and 98.0% on Saturday, August 22. That was the opening day of the 31st Uraja (the Okayama Momotaro Festival), staged in central Okayama City. Third came ¥31,100 and 97.4% on Saturday, July 18, the first day of the three-day weekend that included Marine Day (Monday, July 20). Beyond those, the ¥19,200 recorded on Saturday, July 11 coincided with the opening day of the 20th Annual Conference of the Japanese Society of Chronic Nursing (日本慢性看護学会), which began that day at the Okayama Convention Center.
| Date | Listed price | vs. median | Est. occupancy | Overlapping demand |
|---|---|---|---|---|
| Jun 25 (Thu) | ¥34,300 | 2.66x | 99.9% | Pre-night, Japanese Orthopaedic Trauma Association (Jun 26–27) |
| Aug 22 (Sat) | ¥32,300 | 2.51x | 98.0% | 31st Uraja (Aug 22–23), opening day |
| Jul 18 (Sat) | ¥31,100 | 2.41x | 97.4% | Marine Day long weekend (Jul 18–20), day one |
| Jun 26 (Fri) | ¥23,600 | 1.83x | 98.6% | Japanese Orthopaedic Trauma Association, opening day |
| Aug 19 (Wed) | ¥22,200 | 1.72x | 96.8% | Post-Obon return of business demand (no specific event identified) |
| Aug 20 (Thu) | ¥21,700 | 1.68x | 97.0% | Same as above |
| Aug 5 (Wed) | ¥20,800 | 1.61x | 98.1% | Midweek business demand (no specific event identified) |
| Jul 11 (Sat) | ¥19,200 | 1.49x | 89.7% | Japanese Society of Chronic Nursing (Jul 11–12), opening day |
| Aug 8 (Sat) | ¥18,600 | 1.44x | 94.5% | Weekend before Obon |
| Jun 18 (Thu) | ¥18,200 | 1.41x | 98.7% | Thursday weekday business demand (no specific event identified) |
Source: MetroEngines Research; compiled by the HotelBank Editorial Team (top 10 days by ratio to the median, drawn from the 83 days from June 10 to August 31, 2026, in Okayama City Kita Ward. Listed prices are rounded to the nearest ¥100.)
Broken down by type, those 13 days comprise three driven by academic conferences and conventions, three by festivals and long weekends, three by seasonal factors around Obon, and four weekday business peaks for which no specific event could be identified.Close to half of “the days Okayama hotels are expensive” are explained by MICE — academic conferences and conventions — and events. That is the answer the daily data yields.
Thursday Fills the Most — The Capital’s Character as a Business Location
The other axis of demand peaks is the day of the week. Averaging the same 83 days by weekday, estimated occupancy in Okayama City Kita Ward is highest on Thursday at 93.7%, followed by Wednesday at 92.0% and Tuesday at 89.7%. Saturday ranks fourth at 89.4% and Sunday is lowest at 75.5%. In tourist destinations Saturday normally stands out, but in Kita Ward midweek Wednesday and Thursday outrank Saturday. That is the signature shape of a city built on business demand.
Source: MetroEngines Research; compiled by the HotelBank Editorial Team (June 10–August 31, 2026; n=11–12 days per weekday)
Kurashiki also peaks on Thursday, at 86.2%, but Wednesday (85.0%) and Saturday (84.8%) sit almost level with it, so the spread between weekdays is narrower than in Kita Ward. Turn to listed prices, however, and Kurashiki runs ¥22,300 on Saturday against ¥14,200 on Monday — a +57% Saturday premium. Kita Ward runs ¥18,400 on Saturday against ¥11,500 on Monday, or +60% — a higher rate of premium than Kurashiki, though Kurashiki’s absolute level is higher.
To summarise: Kita Ward is a market that fills to high occupancy midweek and goes after rate on Saturdays, while Kurashiki is one that holds steady occupancy regardless of weekday and sees rates jump on Saturdays and in summer. From an operator’s standpoint, the main revenue battleground is weekday rate design in Kita Ward and weekend and summer-peak rate design in Kurashiki.
Note that on Saturday, August 22, it was not only Kita Ward, where Uraja is held, that rose (¥32,300 and 98.0%): Kurashiki climbed to ¥33,000 and 97.8% as well. Kurashiki is just under 20 minutes from Okayama Station on the conventional line, and most likely served as the catchment for demand the capital could not absorb.During region-wide events, price increases spill over into areas beyond the immediate station catchment of the venue — and whether a neighbouring city designs its inventory and pricing around that spillover determines whether it captures the opportunity.
A Live Reading — September’s Conference Week Sold Out More Than a Month Ahead
How far in advance does a demand peak lock in? A live case gives the answer. From Friday, September 18 through Sunday, September 20, 2026, the 57th Japanese Nursing Association Academic Conference (日本看護学会) is being held at the Okayama Convention Center and three other venues. We aggregated the remaining-room trajectory for September 18, the opening day, property by property.
Of 800 properties in Okayama Prefecture, 182 had an observable remaining-room trajectory. We then narrowed the comparison to the 112 whose OTA-listed allocation is at least 30% of total rooms. (Properties whose OTA allocation is extremely small relative to total rooms are excluded, because remaining-room counts cannot be read as demand: the cause may be channel strategy centred on direct sales or a call centre, a practice of releasing inventory in small increments, a small contractual allotment, or several of these at once.)
| Property | Total rooms | Rooms left at T-30 | Rooms left at T-14 | Early sell-out LT |
|---|---|---|---|---|
| Okayama Universal Hotel Dai-ni Bekkan (岡山ユニバーサルホテル 第二別館), Kita Ward | 333 rooms | 16 | 0 | LT27 (sold out on 23 observed days) |
| Toyoko Inn Okayama Station West Exit Migi (東横INN岡山駅西口右), Kita Ward | 216 rooms | 1 | 0 | Sold out from more than 45 days before the stay date (58 observed days sold out) |
| Kuretake Inn Okayama (くれたけイン岡山), Kita Ward | 111 rooms | 17 | 0 | LT21 (sold out on 14 observed days) |
| Hotel Abest Grande Okayama (ホテルアベストグランデ岡山), Kita Ward | 184 rooms | 44 | — | LT11 (sold out on 4 observed days) |
Source: MetroEngines Research; compiled by the HotelBank Editorial Team (September 18, 2026 check-in, as observed on September 16, 2026. Of 800 properties in Okayama Prefecture, 182 had an observable remaining-room trajectory; the 112 of those whose OTA-listed allocation is at least 30% of total rooms form the aggregation set.)
The 216-room property by the station’s west exit hit zero remaining rooms more than 45 days before the stay date and stayed sold out across 58 observed days in total. Even the 333-room property was down to 16 rooms (4.8% remaining) at T-30 and reached zero by T-14.A conference weekend in the prefectural capital is effectively settled more than a month out.
The picture changes for the next day, Saturday, September 19. Ranked by lowest share of rooms remaining, the top places all go to Kurashiki properties: Kurashiki Setouchi Kojima Hotel (倉敷せとうち児島ホテル, 91 rooms) sold out more than 45 days before the stay date; Dormy Inn Kurashiki with the Achi-no-Yu natural hot spring (天然温泉 阿智の湯 ドーミーイン倉敷, 164 rooms) recorded an early sell-out LT of 34 and had zero rooms left at T-30; Kurashiki Royal Art Hotel (倉敷ロイヤルアートホテル, 71 rooms) an early sell-out LT of 34; and Green Rich Hotel Kurashiki Ekimae (グリーンリッチホテル倉敷駅前, 120 rooms) an early sell-out LT of 30. The same pattern seen in the August 22 price spillover in the previous section shows up on the inventory side too. When a conference in the capital runs across a Saturday and Sunday, its MICE demand eats through Kurashiki’s inventory first.
The Supply Side — How Far 177 Rooms at Okayama Station and a 300-Room Nodayacho Project Can Lift the Hierarchy
As the analysis so far shows, the price structure of Okayama City Kita Ward is one where estimated settled ADR sits flat in the ¥7,900 range in normal conditions, while on the handful of MICE and event days each year listed prices jump to 1.3–2.7 times the period median. How does that structure change when supply increases?
Within MetroEngines Research’s coverage, 121 properties with 9,851 rooms are operating within a 3 km radius of Okayama Station (of which 38 properties with 7,402 rooms are large-scale, at 100 rooms or more). Two major redevelopments will add rooms to that base over the next five years.
| Project | Programme mix | Hotel rooms | Schedule |
|---|---|---|---|
| Ekimaecho 1-chome, Blocks 2, 3 and 4 District Category I Urban Redevelopment Project (OKAYAMA GATE PLACE) | Hotel tower, 16 storeys above ground (hotel, retail, office, convention); residential tower, 31 storeys above ground with 422 units; parking structure. Total floor area about 84,300 m² | 177 rooms (83 double, 94 twin) | Residential tower completed late April 2026; hotel tower scheduled for completion in November 2026 and opening around spring 2027 (operated by JR Shikoku Hotels) |
| Nodayacho 1-chome, Blocks 2 and 3 District Category I Urban Redevelopment Project | Mixed residential, hotel and retail. Floor area about 40,400 m², site about 5,600 m². Hotel tower of 12 storeys; residential tower of 19 storeys with 264 units | About 250–300 rooms | Building-plan filings show scheduled completion in December 2028. In October 2025 the developer announced a revision: demolition from September 2026 to March 2028, main construction starting April 2028 or later, and a completion target of June 2031 |
Source: compiled by MetroEngines Research & Consulting from the Ministry of Land, Infrastructure, Transport and Tourism’s Statistical Survey on Building Construction Starts, plus developer and press announcements. Note: building-plan data is based on building-confirmation applications, so project and room counts are expected to rise as further applications are filed. Treat these figures as the lower bound of the confirmed pipeline as of today.
Together the two add 427–477 rooms, equivalent to +4.3–4.8% against the 9,851 rooms within 3 km of Okayama Station. On top of that, a 600-room hotel — APA Hotel & Resort Okayama-eki Shinkansen-guchi (アパホテル&リゾート〈岡山駅新幹線口〉) — opened on the Shinkansen side of the station on August 6, 2026, thickening the capital’s supply layer further. Cumulatively from 2026 through 2031 that comes to roughly 1,030–1,080 rooms (1,027–1,077), or an increase of +10.4–10.9% against the existing stock within 3 km of the station. (If part of the August 2026 opening is already counted in the existing-stock tally, the growth rate will be lower than this.)
An increase of that size should work on the price hierarchy in two directions. The first is the normal-conditions price band. With a monthly coefficient of variation of 7.4%, Kita Ward is already extremely flat, and a base of business demand supports the rate. Add roughly 10% more rooms and weekday rates will most likely stay flat to marginally higher for some time. The 70 days outside the “16% spike days” identified in the daily data become, in effect, the main competitive battleground.
The second is closing the gap on peak days. As things stand, during a conference week in the capital the large properties’ inventory disappears more than a month ahead and demand is pushed out as far as Kurashiki. Adding 477 rooms creates room to retain that displaced demand within the capital.The upside for Okayama City’s room rates lies not in raising normal-day prices but in how much of the peak-day demand previously lost can be absorbed locally, and how appropriately rates are set on those dates. The Ekimaecho hotel tower in particular is planned with convention facilities attached, and a configuration that links MICE demand and guest rooms inside a single property works in favour of peak-day rate formation. For a landowner in a redevelopment, the choice between taking hotel floor space as rights-conversion space and cashing out turns on the rate the hotel can sustain: on a 20-year cash-flow basis the break-even sits at roughly ¥10,000 of estimated ADR.
Both Okayama City and Kurashiki City are, meanwhile, preparing an accommodation tax of ¥200 per person per night, targeted for introduction from around the middle of fiscal 2027. For two guests in one room that is an added ¥400 per night, about 2.6% of Kita Ward’s listed price (¥15,300 in August 2026). The details of the scheme are left to a separate article.
Land Prices and Zoning Reveal an Asymmetry Between the Capital and the Bikan Quarter
The difference in room for new supply shows up directly in land prices and land-use regulation. In the Ministry of Land, Infrastructure, Transport and Tourism’s Real Estate Information Library, the 2025 Official Land Price Survey and Prefectural Land Price Survey put Honmachi 2-1, in front of Okayama Station, at ¥1.90 million per m² (+6.7% year on year) and Nishikicho 6-1, on the station’s east-exit side, at ¥2.06 million (+5.6%). The Omotecho and Nakasange area that the Nodayacho redevelopment district fronts, by contrast, sits at just ¥310,000–¥360,000 (+6.2% to +8.4%).Within the same Kita Ward, land in front of the station costs five to six times what land in Omotecho does.
Source: compiled by MetroEngines Research & Consulting from the Ministry of Land, Infrastructure, Transport and Tourism’s Real Estate Information Library (2025 Official Land Price Survey and Prefectural Land Price Survey)
Measured by rate of increase, though, the Omotecho and Nakasange side is the stronger of the two. Nakasange 1-5-38 rose +8.4%, Omotecho 2-3-41 +8.2% and Heiwacho 6-5 +8.1%, all ahead of Honmachi 2-1 in front of the station (+6.7%) — a phase in which progress on redevelopment is being priced into expectations. Given that acquisition costs run at about a fifth of the station-front level, the Nodayacho hotel tower has room to work on rate assumptions different from those of a station-front location.
On zoning, both the area around Nodayacho and the Okayama Station frontage are commercial districts with 80% building coverage and 400–700% floor area ratios, leaving ample room for high-rise development. Around the Kurashiki Bikan Historical Quarter, by contrast, the dominant designations are Category I Residential (200% FAR, 60% coverage) and Neighbourhood Commercial (200–300% FAR, 80% coverage), and townscape preservation makes large-scale hotel development hard to envisage in any case. Indeed, the room count within 2 km of the Bikan Quarter comes to just 69 properties and 2,982 rooms — about 30% of the 9,851 rooms within 3 km of Okayama Station.
That asymmetry is what produces the difference in monthly curves seen earlier. Kurashiki’s 10.4% coefficient of variation is the combined result of demand that moves with the seasons and supply that regulation keeps from growing. Put the other way round, Kurashiki’s summer and weekend peaks are structurally hard to relieve, and remain a recurring revenue opportunity for incumbent properties. Kita Ward, meanwhile, can add supply by using its floor area ratios, so normal-conditions rates flatten more readily and the room for revenue growth shifts to precision in capturing peak days.
Implications for Operators and Investors
Pulling the analysis together, four points emerge from Okayama’s lodging market.
First, the impression that “Okayama is expensive” is produced by the daily distribution. The estimated settled ADR in Okayama City Kita Ward, the prefectural capital, is ¥7,900 on a 12-month average — no more than a Tier 3 level within the prefecture. Yet on 13 of 83 days listed prices reach at least 1.3 times the median, and on seven days at least 1.5 times. Searches along the lines of “Okayama hotel expensive” most likely reflect the experience of travellers who tried to book on those 13 days. Conversely, on the other 70 days this is a market where a guest can stay at a mid-range prefectural price point.
Second, peak days are highly predictable. Of the spike days identified here, three stem from academic conferences and conventions and three from festivals and long weekends. Conference dates are published more than a year ahead, and civic festivals such as Uraja fall at a fixed time of year. Lock in the annual calendar first, design inventory allocation and rates for those dates, and rate can be built up without waiting for inventory to run out at the last minute. As the September 18 case shows, a conference week in the capital is settled more than a month in advance, which means rate decisions are finished by roughly LT30.
Third, there is room to price in the fact that this is a city where Thursday fills the most. Estimated occupancy in Kita Ward runs 93.7% on Thursday and 92.0% on Wednesday, above Saturday’s 89.4%. Listed prices nonetheless run ¥16,800 on Thursday against ¥18,400 on Saturday, so the order of prices does not match the order of occupancy. That suggests rate design for midweek days still has headroom.
Fourth, Kurashiki’s peaks are structurally durable. Zoning and townscape constraints make large-scale supply hard to introduce around the Bikan Quarter, so the summer and weekend squeeze is unlikely to ease for some time. For incumbent properties in Kurashiki, annual revenue turns on how fully they capture the three-week high-rate band seen in August (16 days between August 3 and 22 ran at least 30% above the median). And on weekends when MICE lands in the capital, Kurashiki’s inventory is the next to go.Building Okayama City’s event calendar into Kurashiki’s own rate design is a practical revenue opportunity for the neighbouring city.
A closing note on the hot-spring and resort tiers: Yunogo (Mimasaka City, ¥12,300), Yubara (Maniwa City, ¥12,000) and Okutsu (Kagamino Town, ¥20,100), which together make up the Mimasaka Sanyu trio (美作三湯), all hold price points near the top of the prefecture. Year on year in August 2026, Kagamino rose +8.6% and Maniwa +5.2%, while Mimasaka fell sharply at −21.4%. That the three move in different directions despite belonging to the same trio is a reminder to read supply and demand at the property level rather than the area level.
⚠ A note on ADR for future dates:The analysis in this article is based on confirmed-month data through August 2026. Estimated settled ADR from September 2026 onward is a snapshot inferred from prices published on OTAs and similar channels as of the survey date, and it shifts as plans are added and rates adjusted closer to the check-in date. Figures compiled on different bases should not be compared directly year on year; every year-on-year comparison in this article is between confirmed months.
Related reading
- Okayama City Hotel ADR −23.3% in July, Business +2.8% in H1 2026
- Shimane July ADR: City Hotels −8.2%, Business +1.5%, Spread Halves
References and Sources
■ Data sources
Published rate and sales-inventory data from OTAs and similar channels collected by MetroEngines Research (estimated settled ADR by municipality, daily listed prices and estimated occupancy, property-level remaining-room trajectories, area room supply); the Ministry of Land, Infrastructure, Transport and Tourism’s Real Estate Information Library (Official Land Price Survey, Prefectural Land Price Survey, zoning); building-plan data (based on building-confirmation applications); and published materials from developers, municipalities and press reports.
■ Calculation assumptions
Estimated settled ADR is a tax-exclusive-equivalent estimate derived by applying a property-type correction factor to the cheapest plan level; municipal values are the monthly average of the median across covered properties (confirmed months only). A spike day is defined as a date on which the daily listed price in Okayama City Kita Ward (average of all plans, two guests per room, tax included) exceeded the 83-day period median by 30% or more. The supply growth rate is the simple ratio of 177 rooms at Ekimaecho plus about 250–300 at Nodayacho plus 600 on the Shinkansen side, divided by the 9,851 rooms within 3 km of Okayama Station.
■ Limitations and caveats
Estimated occupancy and remaining rooms are inferred from OTA-listed inventory and differ from a property’s actual occupancy. In municipalities where the covered sample is in single digits, a rate revision or temporary closure at one or two properties moves the average substantially. The drivers attributed to spike days are inferred by matching dates against events and conferences and do not demonstrate causation. Nodayacho’s room count and completion timing may change while the plan is under revision.
■ Market data
- MetroEngines Research — estimated settled ADR by municipality (confirmed months, January 2025–August 2026); daily listed prices and estimated occupancy (June 10–August 31, 2026); property-level remaining-room trajectories (September 18 and 19, 2026 check-in); area room-supply aggregation
- MetroEngines Research & Consulting — building-plan data (based on building-confirmation applications)
■ Government statistics and public data
- Ministry of Land, Infrastructure, Transport and Tourism, Real Estate Information Library — 2025 Official Land Price Survey and Prefectural Land Price Survey; city planning designations (zoning)
- Ministry of Land, Infrastructure, Transport and Tourism, Statistical Survey on Building Construction Starts
- Okayama City, “Nodayacho 1-chome Blocks 2 and 3 District Category I Urban Redevelopment Project”
■ Events and conferences
- 52nd Annual Meeting of the Japanese Orthopaedic Trauma Association (June 26–27, 2026; Okayama Convention Center and other venues)
- 57th Japanese Nursing Association Academic Conference (September 18–20, 2026; Okayama Convention Center and other venues)
- 20th Annual Conference of the Japanese Society of Chronic Nursing (July 11–12, 2026; Okayama Convention Center)
- 31st Uraja 2026 (August 22–23, 2026; central Okayama City)
■ Redevelopment and press coverage
- APA Hotel, “One of Okayama’s largest: the 600-room APA Hotel & Resort Okayama-eki Shinkansen-guchi opens today” (August 6, 2026)
- Nomura Real Estate Development and JR West Real Estate & Development, “A large-scale mixed-use redevelopment to become a new landmark in front of JR Okayama Station” (February 14, 2024)
- Kenbiya, “Large-scale redevelopment at the east exit of JR Okayama Station; a new JR Shikoku brand hotel is scheduled to open in spring 2027” (November 1, 2025)
- Kentsu Shimbun, “Nodayacho redevelopment association to revise its plan and amend the rights-conversion scheme” (October 10, 2025)
- Nodayacho 1-chome Blocks 2 and 3 District Redevelopment Association, “Project Overview”
■ Accommodation tax