

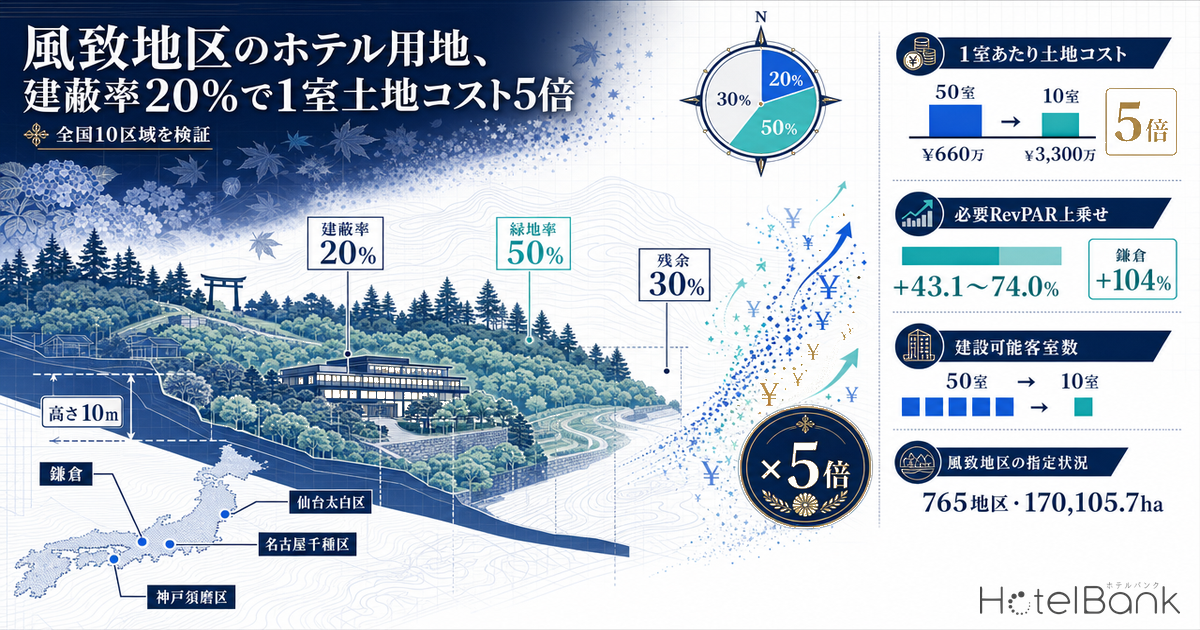
The first things anyone checks in a site screening are the use-zone designation and the floor area ratio (FAR). Yet there are sites where the FAR is nowhere near exhausted and the room count still refuses to grow. Often the reason is that the land sits inside a Scenic District (fuchi chiku). A Scenic District is one of the area classifications established under Article 8 of the City Planning Act, and it is a second layer laid on top of the use zone. It also constrains a different set of variables. Not FAR, not an absolute height cap, but building coverage ratio, green-space ratio, wall setbacks, and a permit requirement for felling trees and altering land form — it regulates how the site itself may be used. The Ministry of Land, Infrastructure, Transport and Tourism (MLIT) counts 765 designated districts covering 170,105.7 hectares nationwide (as of 31 March 2017).
This article fills the one gap left in our regulatory series. Kyoto-style height controls are a question of height districts, i.e. absolute height caps; the subject here is building coverage and green-space ratios instead, and the cities examined are Yokohama, Kamakura, Nagoya, Ashiya, Kobe, Sendai and Fukuoka rather than Kyoto. What separates this layer from use zoning and FAR is that a Scenic District overlays the use zone as a separate system. For how far you can read development capacity from use zoning and FAR alone, see Hotel Development Capacity 2026: Zoning, FAR & Land Price in 5 Markets. On the same site, under the same use zone, a second ceiling of 20% building coverage descends — that is what a Scenic District does.
Metric Definitions Used in This Article
- ADR (average daily rate): an estimated settled rate (tax-exclusive equivalent) derived by applying a segment-specific correction factor to each property’s lowest publicly listed plan rate (double occupancy, per-room, tax-inclusive). Cross-checked against per-property results disclosed by listed hotel REITs (91 properties, trailing three months), the median error is about 7%. These are estimates and differ from each property’s actual transacted rates or accounting figures. An area-level ADR is the median across the properties covered (the level of a typical property in that area).
- Building coverage ratio: building footprint (the building’s projected area viewed from directly above) divided by site area. Floor area ratio (FAR): total floor area divided by site area. Green-space ratio: green area divided by the area of land covered by the permit application.
- Land cost per room: land acquisition price divided by the number of rooms that can be built on the site. The figures here are simplified estimates on shared assumptions of a 1,000 sqm site and 40 sqm of gross floor area per room; an actual investment decision requires a detailed feasibility study.
- Data sources: MetroEngines Research & Consulting / materials published by each municipality
- — A Scenic District is a second layer laid over the use zone. What it constrains is not FAR or absolute height but building coverage, green-space ratio and wall setbacks, plus permit control over tree felling and land-form change.
- — The numerical standards are set by municipal ordinance. Even within the same “Type 1” label, coverage is 20% in Kobe and Ashiya but 30% in Nagoya; a screening that ignores the type misses the entire difference.
- — On a 1,000 sqm site at 200% FAR and 40 sqm per room, buildable capacity falls from 50 rooms to 10. Land cost per room rises from ¥6.6M to ¥33.0M — five times higher (at a land price of ¥330,000/sqm).
- — Holding the same yield requires a RevPAR premium of +43.1% to +74.0%. Kamakura (+104%) and Sendai’s Taihaku Ward (+90%) clear that bar; Nagoya’s Chikusa Ward (+8%) and Kobe’s Suma Ward (+23%) do not.
- — In our ownership master covering seven listed REITs, holdings across the five prefectures examined are overwhelmingly station-front or central-city. Scenic District land is screened out before it ever reaches an institutional pipeline.
A Scenic District constrains how a site may be used, not what may be built on it
What a use zone determines is, in principle, use (what may be built) and volume (FAR, coverage, setback-line rules). That is not what a Scenic District determines. Under the enforcement order of the City Planning Act, each municipality sets by ordinance a permit requirement covering the following seven acts.
| Act requiring permission | What it means for hotel development |
|---|---|
| Construction of buildings and other structures | Covers not only the building but signage, gates, walls, water tanks and condenser platforms (over 1.5 m high) |
| Change of colour of buildings and structures | Brand standard colours may be unusable; renovation and rebranding also require permission |
| Site formation, land reclamation and other changes to land form or quality | Levelling sloped land is not possible; cut and fill heights are capped |
| Reclamation or drainage of water surfaces | Integrated use of a site containing ponds or channels is restricted |
| Felling of trees and bamboo | On a wooded site the effective buildable envelope shrinks further |
| Extraction of earth and stone | Affects plans to reuse excavated soil on site |
| Outdoor stockpiling of earth, waste and recycled materials | Prior consultation is needed for the construction yard and material storage layout |
Source: compiled by MetroEngines Research & Consulting from the City of Nagoya, "Guide to Permit Applications for Building in Scenic Districts" (April 2026) and the City of Ashiya, "Outline of Scenic Districts"
Items three and five are the ones to watch. The fact that earthwork and tree felling are both permit-controlled is what separates a Scenic District from a plain coverage-ratio rule. The standard suburban-resort sequence — cut and fill a hillside site to create a level platform, then lay out guest-room wings on it — does not simply go through. We have covered the effect of Japan’s earthwork regulation on slope-resort construction cost and opening timing in Japan Earthwork Permits Cover 81.8% of Land: Slope Resort Costs 2026; Scenic Districts are a separate system that can apply to the same site on top of it.
Same "Type 1", different numbers — permit standards in five municipalities
The numerical standards are not uniform nationwide. The cabinet order sets only the envelope within which ordinances may be written — building height between 8 m and 15 m, coverage between 20% and 40%, wall setbacks between 1 m and 3 m — and the actual figures are fixed by municipal ordinance. As a result, the label “Type 1 Scenic District” tells you nothing about the coverage ratio. Type 1 means 20% coverage in Kobe and Ashiya, but 30% in Nagoya.
| Municipality | Type | Height | Coverage | Street-side setback | Neighbour-side setback | Green space |
|---|---|---|---|---|---|---|
| Kobe 10 districts, approx. 9,215 ha | Type 1 | 10 m or less | 20% or less | 3 m or more | 1.5 m or more | 50% or more |
| Type 2 | 10 m or less | 30% or less | 3 m or more | 1.5 m or more | 40% or more | |
| Type 3 | 15 m or less | 40% or less | 2 m or more | 1 m or more | 30% or more | |
| Ashiya 2 districts, approx. 1,088 ha | Type 1 | 10 m or less | 20% or less | 3 m or more | 1.5 m or more | 50% or more |
| Type 2 | 10 m or less | 30% or less | — | — | 40% or more | |
| Type 3 | 15 m or less | 40% or less | 2 m or more | 1 m or more | 30% or more | |
| Nagoya 18 districts, approx. 3,000 ha | Type 1 | 10 m or less | 30% or less | 2 m or more | 1.5 m or more | 30% or more |
| Type 2 | 10 m or less | 40% or less | 2 m or more | 1 m or more | 30% or more | |
| Kamakura approx. 2,194 ha (55.5% of the city) | Type 2 | 10m | 40% | 2m | — | 20% |
| Type 3 | 15m | 50% | 1m | — | 20% | |
| Yamatokoriyama Five-type scheme near the floor of the cabinet order | Type 1 | 8 m or less | 20% or less | 3 m or more | 1.5 m or more | 40% or more |
| Type 5 | 15 m or less | 40% or less | 2 m or more | 1 m or more | 20% or more |
Source: compiled by MetroEngines Research & Consulting from the City of Kobe, "Scenic District Permit Standards"; the City of Ashiya, "Outline of Scenic Districts" (December 2023); the City of Nagoya, "Guide to Permit Applications for Building in Scenic Districts"; the City of Kamakura, "Kamakura Scenic District Ordinance"; and the City of Yamatokoriyama, "Permit Standards under the Scenic District Ordinance"
Three things stand out in the table. First, 20% coverage arrives bundled with a 50% green-space requirement (Type 1 in Kobe and Ashiya). One-fifth of the site is building, half is planting, and only 30% is left. Second, the height cap runs from 8 m to 15 m, which in practice means two to four storeys. Even with 200% FAR available, 20% coverage across three floors uses only 60%. Third, Nagoya adds a separate provision aimed at sloped land — as a rule no more than two average ground planes per building, and an apparent height of 15 m or less — and on top of that the corner-lot coverage bonus cannot be applied. Ashiya imposes a limit of 6.0 m on the height difference between ground planes the building touches. Terraced layouts on hillside land are stopped head-on by provisions like these.
How many rooms fit on 1,000 sqm — 50 becomes 10
Now the economic meaning of a coverage constraint, in numbers. Fix the assumptions: a 1,000 sqm site; a Category 1 Residential use zone (60% coverage, 200% FAR); 40 sqm of gross floor area per room (a 25 sqm room plus common areas and back-of-house, so guest rooms are 62.5% of the total). Storeys are derived from the height cap: 8 m gives two floors, 10 m gives three (3.1 m floor-to-floor), 15 m gives four (3.5 m). Buildable floor area is set by whichever is smaller — site x FAR, or site x coverage x storeys.
Source: MetroEngines Research & Consulting estimates (assuming a 1,000 sqm site, 200% FAR and 40 sqm of floor area per room)
| Case | Coverage | Height / storeys | Footprint | Floor area (max) | Rooms | vs baseline |
|---|---|---|---|---|---|---|
| Outside a Scenic District (baseline) | 60% | No cap / 4 floors | 600㎡ | 2,000㎡ (FAR is the binding cap) | 50 rooms | 100% |
| Type 3 case (equivalent to Kamakura Type 3) | 50% | 15 m / 4 floors | 500㎡ | 2,000㎡ | 50 rooms | 100% |
| Type 3 case (Kobe and Ashiya Type 3) | 40% | 15 m / 4 floors | 400㎡ | 1,600㎡ | 40 rooms | 80% |
| Type 2 case (Nagoya Type 2) | 40% | 10 m / 3 floors | 400㎡ | 1,200㎡ | 30 rooms | 60% |
| Type 2 case (Kobe and Ashiya Type 2) | 30% | 10 m / 3 floors | 300㎡ | 900㎡ | 22 rooms | 44% |
| Type 1 case (Kobe and Ashiya Type 1) | 20% | 10 m / 3 floors | 200㎡ | 600㎡ | 15 rooms | 30% |
| Type 1 case (Yamatokoriyama Type 1) | 20% | 8 m / 2 floors | 200㎡ | 400㎡ | 10 rooms | 20% |
Source: MetroEngines Research & Consulting estimates
What bites here is the product of coverage and height. In a Type 3 case at 50% coverage, four storeys reach 2,000 sqm of floor area and FAR becomes the binding constraint first — meaning the Scenic District designation costs no rooms at all. At 40% coverage, however, floor area stops at 1,600 sqm and coverage starts binding first; at 30% it is 900 sqm, at 20% it is 600 sqm. Drop to two storeys under an 8 m cap and it is 400 sqm — 10 rooms. One-fifth of the 50-room baseline.
Put differently, what changes the economics is not whether a Scenic District applies but which type number it is. On adjacent hills inside the same city, Type 3 means zero impact and Type 1 means one-fifth the rooms. A site screening that checks only for the presence of a Scenic District and never reads the type misses that difference entirely.
Land cost per room up to 5x — a sensitivity test at three land-price levels
Land is bought by the site; revenue is earned by the room. Cut the room count to one-fifth and land cost per room multiplies by five. Apply real land values: the 2026 published land price averages for residential land are ¥248,939/sqm in Kamakura, ¥329,600/sqm in Nagoya’s Showa Ward and ¥395,000/sqm in Ashiya. Rounding those to three levels — ¥250,000, ¥330,000 and ¥400,000 — gives land costs of ¥250M, ¥330M and ¥400M for a 1,000 sqm site, from which we derive land cost per room.
Source: MetroEngines Research & Consulting estimates (land-price levels reference 2026 published land price municipal averages for residential land)
At ¥330,000/sqm, the 50-room case outside a Scenic District works out to ¥6.6M of land per room. That becomes ¥15.0M at 22 rooms in a Type 2 case (30% coverage), ¥22.0M at 15 rooms in a Type 1 case (20%, 10 m), and ¥33.0M at 10 rooms in the Type 1 8 m case. Land alone at ¥33M per room is a level you normally see only on prime central-city sites — here it appears in a hillside residential area. Whether a ground lease rather than an outright purchase can avoid that level is the question we took up in Leasehold Hotel Development: 1.38x Land Price Reach Across 9 Markets.
Add construction cost and it takes the shape of an investment decision. On 2025 actuals from MLIT’s construction starts statistics, hotel-use steel-frame construction runs ¥2.405M per tsubo and reinforced concrete ¥2.026M per tsubo. At 40 sqm (12.1 tsubo) of floor area per room, steel frame is roughly ¥29.1M per room. Total investment including that, and the RevPAR level needed to hold the same yield, come out as follows.
| Case | Rooms | Land / room | Construction / room | Total / room | RevPAR premium required |
|---|---|---|---|---|---|
| Outside a Scenic District (baseline) | 50 rooms | ¥6.6M | ¥29.1M | ¥35.7M | — |
| Type 3 case (40% coverage, 15 m) | 40 rooms | ¥8.3M | ¥29.1M | ¥37.4M | +4.6% |
| Type 2 case (40% coverage, 10 m) | 30 rooms | ¥11.0M | ¥29.1M | ¥40.1M | +12.3% |
| Type 2 case (30% coverage, 10 m) | 22 rooms | ¥15.0M | ¥29.1M | ¥44.1M | +23.5% |
| Type 1 case (20% coverage, 10 m) | 15 rooms | ¥22.0M | ¥29.1M | ¥51.1M | +43.1% |
| Type 1 case (20% coverage, 8 m) | 10 rooms | ¥33.0M | ¥29.1M | ¥62.1M | +74.0% |
Source: MetroEngines Research & Consulting estimates; construction unit costs reference MLIT "Statistics on Building Construction Starts" 2025 actuals (steel frame ¥2.405M per tsubo)
Two conservative biases sit in these figures. The first is that construction-cost inflation is not built in. For a 2026 start and a 2028 opening, compounding at +5% a year to the midpoint of the build period lifts the unit cost to about ¥2.72M per tsubo (roughly ¥32.9M per room). Total investment then becomes ¥39.5M in the baseline case and ¥65.9M in the Type 1 8 m case, and the required premium narrows to +67%. As construction takes a larger share, the land-cost gap matters relatively less. The second is that economies of scale are ignored. A 10-room hotel cannot spread front-desk, housekeeping and kitchen fixed costs as thinly as a 50-room hotel. Factor in the GOP-margin difference and the required premium is larger than the table shows.
A 50% green-space rule kills the car park first — the constraint that bites before coverage
Coverage alone does not tell the whole story. The other constraint is the green-space ratio. Type 1 in Kobe and Ashiya requires at least 50% green space. With 20% building footprint and 50% planting, only 30% of the site is left — 300 sqm on a 1,000 sqm plot. That 300 sqm has to absorb the porte-cochère, circulation, parking, the plant yard and the refuse store.
One parking space, including the aisle, needs roughly 25 to 30 sqm. In 300 sqm that caps out at 10 to 12 spaces, and after the porte-cochère and plant yard are deducted it falls to 8 to 10 in practice. Yet the Type 1 case builds 15 rooms. For a format on hillside or suburban land where guests are assumed to arrive by car, parking capacity does not reach the room count. Nagoya’s Type 1 (30% coverage, 30% green space) leaves 40%, or 400 sqm, which holds 13 to 16 spaces and roughly matches 15 rooms. A 20-point difference in the green-space ratio alone decides whether the parking works. Since minimum parking requirements themselves vary widely between municipalities, the practical task in a land decision is to set the required space count against the residual area a Scenic District leaves.
Area allocation on a 1,000 sqm site in a Type 1 Scenic District (20% coverage, 50% green space)
Building footprint 200 sqm (20%) + green space 500 sqm (50%) = 700 sqm. The residual 300 sqm must hold the porte-cochère, circulation, parking, plant yard and refuse store. Parking capacity is roughly 8-10 spaces; buildable capacity is 15 rooms. Parking spaces fall short of the room count.
There is one more practical wrinkle in the green-space rule. Nagoya states that woodland preserved in its current condition is counted within the area of the permitted works, so retained existing trees can be credited toward the green-space ratio. The converse is that if you clear existing woodland you must rebuild the green-space ratio with new planting — and felling trees is itself permit-controlled. The denser the existing woodland, the smaller the effective footprint available for a building relative to what the coverage ratio suggests on paper.
Wall setbacks do not much affect the footprint ceiling on a regular site. On a 1,000 sqm plot measuring 25 m by 40 m, deducting 3 m on the street side and 1.5 m on the neighbouring sides still leaves about 759 sqm of buildable envelope, comfortably accommodating the 200 sqm allowed at 20% coverage. Where they do bite is on irregular plots and narrow frontages, and in cases like Nagoya where the corner-lot bonus is unavailable. If a business plan assumed the 10-point corner-lot coverage bonus, that assumption disappears inside a Scenic District.
Field check — no hotel of scale exists where Scenic Districts spread
Everything so far is arithmetic on paper. Now we check what actual supply looks like, using the lodging data we track. We cut out areas where Scenic District designations are widely distributed, and station-front or central-city areas in the same metropolitan region, as radius circles, and compared room density and rooms per property.
Method: lodging properties located inside a circle centred on a representative point for each area were extracted, and room density was computed by dividing by the circle’s area. This does not identify Scenic District boundaries parcel by parcel; it approximates, with a circle, an area in which designations are widely distributed, so undesignated land also falls inside each circle. Room counts are as captured by MetroEngines Research.
| Area (radius) | Category | Properties | Rooms | Rooms/km² | Avg. per property | 30+ rooms |
|---|---|---|---|---|---|---|
| Yokohama Yamate (0.8 km) | Scenic Types 3 & 4 | 15 | 520 | 259 | 34.7 rooms | 7 |
| Yokohama Sta.-Minato Mirai (0.8 km) | Control (central) | 38 | 4,083 | 2,031 | 107.4 rooms | 25 |
| Central Kamakura (1.2 km) | Scenic Types 2 & 3 | 54 | 665 | 147 | 12.3 rooms | 6 |
| Fujisawa Sta. (1.2 km) | Control (station front) | 23 | 1,529 | 338 | 66.5 rooms | 14 |
| Nagoya Yagoto-Higashiyama (1.5 km) | Scenic Types 1 & 2 | 2 | 77 | 11 | 38.5 rooms | 1 |
| Nagoya Sta. (1.5 km) | Control (station front) | 179 | 21,052 | 2,978 | 117.6 rooms | 122 |
| Ashiya Rokurokuso-Yamatecho (1.5 km) | Scenic Types 2 & 3 | 1 | 67 | 10 | 67.0 rooms | 1 |
| Kobe Sannomiya (1.5 km) | Control (central) | 105 | 11,071 | 1,566 | 105.4 rooms | 71 |
| Sendai Dainohara (1.5 km) | Scenic (93.9 ha) | 0 | 0 | 0 | — | 0 |
| Sendai Sta. (1.5 km) | Control (station front) | 136 | 15,894 | 2,249 | 116.9 rooms | 101 |
Source: MetroEngines Research & Consulting (N=553 properties, 54,958 rooms; based on listings confirmed as of September 2026)
Source: MetroEngines Research & Consulting (N=553 properties)
Demand itself differs between the hillside and the station front, so the density gap cannot be attributed entirely to regulation. That caveat stands. Even so, the regulation leaves a fingerprint in the numbers — in rooms per property. Against 117.6 rooms at Nagoya Station, 116.9 at Sendai Station and 107.4 around Yokohama Station, central Kamakura sits at 12.3 rooms and Yokohama’s Yamate at 34.7. Of the 54 properties in central Kamakura only six have 30 rooms or more; the remaining 48 average fewer than 10. It is not the size of demand but the structural size of each building that is small — consistent with coverage and height biting as a product.
Within a 1.5 km radius of Nagoya’s Yagoto-Higashiyama there are just two lodging properties, and around Ashiya’s Rokurokuso-Yamatecho just one. In Sendai’s Dainohara (93.9 ha) the count is zero. Room density is one 271st of the level at Nagoya Station, and the Sendai Station versus Dainohara comparison does not even compute. These are all inside urbanization promotion areas and lie within a few kilometres of a railway station. They are not places you can dismiss with “there are no hotels because the location is poor.”
Source: MetroEngines Research & Consulting
Can rates absorb the land-cost increase? The premium required is +43% to +74%
This is where the investment decision turns. Land cost per room can rise and the yield can still hold, provided ADR in that location is high enough. The previous section put the required RevPAR premium at +43.1% for the Type 1 case (20% coverage, 10 m) and +74.0% for the 8 m case. Do actual rates clear that bar?
We compare median estimated settled ADR (the 12 months from September 2025 to August 2026) between hillside or natural-setting wards and station-front or central wards in the same metropolitan region. Because no ward is entirely within a Scenic District, this should be read not as the effect of the designation itself but as a proxy for what a hillside or natural setting does to rates.
| Hillside / natural setting | Est. settled ADR | Station-front / central | Est. settled ADR | Rate gap | Assessment |
|---|---|---|---|---|---|
| Kamakura (N=18) | ¥19,800 | Fujisawa (N=22) | ¥9,700 | +104% | Viable even in the Type 1 8 m case |
| Sendai, Taihaku Ward (N=21) | ¥18,100 | Sendai, Aoba Ward (N=71) | ¥9,500 | +90% | Viable even in the Type 1 8 m case |
| Fukuoka, Nishi Ward (N=4) | ¥24,100 | Fukuoka, Hakata Ward (N=146) | ¥14,700 | +64% | Viable up to the Type 1 10 m case |
| Kobe, Suma Ward (N=3) | ¥14,000 | Kobe, Chuo Ward (N=63) | ¥11,400 | +23% | Type 2 at 30% is the ceiling |
| Nagoya, Chikusa Ward (N=2) | ¥11,000 | Nagoya, Nakamura Ward (N=72) | ¥10,200 | +8% | Type 3 is the ceiling |
Source: MetroEngines Research & Consulting (monthly medians, September 2025-August 2026; N is the monthly median count of properties used to compute estimated settled ADR)
Source: MetroEngines Research & Consulting
The conclusion is clear. What sets the rate gap is not the Scenic District designation but whether the location works as a tourist destination. Kamakura (+104%) and Sendai’s Taihaku Ward (+90%) exceed the +74% premium required, measured against their station-front comparators. There, even the strictest Type 1 case can have its land-cost increase absorbed by rate. Nagoya’s Chikusa Ward (+8%) and Kobe’s Suma Ward (+23%), by contrast, sit almost level with their central comparators, and a 20%-coverage site is hard to make work. In suburban residential Scenic Districts, Type 3 (40-50% coverage) is the effective ceiling for entry.
The point to note is that the inference “scarce because it is a Scenic District, therefore it commands a premium” does not hold. Supply in Chikusa and Suma is extremely thin, yet rates sit at roughly the same level as their central comparators. Thin supply and high rates are separate things, and the likelier explanation is simply that demand itself is thin. Reading “no competitors, so we can price aggressively” into a site screening is dangerous. Note also that Chikusa, Suma and Fukuoka’s Nishi Ward are computed from only two to four properties, which makes them sensitive to the mix of individual properties.
No Scenic District property sits in a listed REIT portfolio
How does it look from the institutional side? Extracting J-REIT-held hotels located in the five prefectures covered here — Kanagawa, Aichi, Hyogo, Miyagi and Fukuoka — from our ownership master (302 domestic properties) yields more than 30 properties that can be confirmed. The breakdown is 11 held by Invincible Investment Corporation, 10 by Japan Hotel REIT Investment Corporation, seven by Ichigo Hotel REIT Investment Corporation, five by Hoshino Resorts REIT, two by Mori Trust Reit and one by Japan Hotel & Residential Investment Corporation. (The ownership master stores location by regional block, so a prefecture-level extract should be read as a lower bound matched on property name and municipality.)
Most of them are station-front or central-city: Kannai and Sakuragicho in Yokohama; Sakae, Nishiki and Marunouchi in Nagoya; Chuo Ward in Kobe; Hakata and Tenjin in Fukuoka. The exceptions are a handful of properties in established hot-spring resort areas such as Hakone and Odawara, where onsen demand came first. Among the suburban Scenic District areas examined here — Yokohama Yamate, central Kamakura, Nagoya Yagoto-Higashiyama, Ashiya Rokurokuso-Yamatecho and Sendai Dainohara — no such property could be confirmed.
That reads naturally as a consequence of the regulation. Listed REITs generally acquire at a scale of 100 rooms or more and ¥1bn or more in acquisition price. Building at that scale on a site capped at 20-30% coverage and 10 m in height requires assembling well over 5,000 sqm. Assembling a single parcel that large on hillside land, while carrying earthwork and felling permits through, is not easy. Scenic Districts are screened out before the institutional pipeline begins. The converse is that developing in this space likely limits the exit to operating companies, high-net-worth individuals and private funds, which makes the perspective in Hotel-to-Housing Conversion: Break-Even ADR ¥3,827-4,594 in 3 Cities — collateral value measured by the breadth of the exit — all the more important.
Site screening checklist — 10 items
Turning that into practice. A Scenic District is a layer separate from the use zone, and it must be confirmed at a different counter, on a different drawing. In Nagoya, use zones are handled at the City Planning Division’s zoning enquiry counter while Scenic Districts sit with the Green Space Maintenance Division of the Green Policy and Public Works Bureau. Online, each city’s city-planning information service or map portal carries a “scenic and green space” layer.
| # | What to check | Consequence of missing it |
|---|---|---|
| 1 | Confirm from city-planning information whether a Scenic District applies and which type it is | Without the type you cannot tell whether coverage is 20% or 50% |
| 2 | Check the numerical standards in the municipal ordinance itself (the cabinet order sets only the envelope) | The same Type 1 means 20% coverage in Kobe and Ashiya but 30% in Nagoya |
| 3 | Whether the site straddles the district boundary, and how coverage is treated if it does | Nagoya applies a weighted average of each portion’s coverage; you cannot simply take the looser figure |
| 4 | Whether the corner-lot coverage bonus is available | Nagoya does not allow the corner-lot bonus inside a Scenic District |
| 5 | The green-space ratio figure, how it is calculated, and whether existing woodland counts | At 50% green space, parking may not reach the room count |
| 6 | Whether a second height rule applies (apparent height, number of average ground planes) | Nagoya limits average ground planes to two as a rule, with apparent height of 15 m or less |
| 7 | The cap on ground-plane height difference on sloped land | Ashiya caps it at 6.0 m, so a terraced hillside layout does not work |
| 8 | The outlook for permits to fell trees and alter land form (whether the earthwork plan is feasible) | On a densely wooded site the effective buildable envelope is narrower than the drawing suggests |
| 9 | Reconstruction limits on a legally non-conforming building (can the current scale be reproduced?) | In Nagoya a rebuild may not exceed the previous height, so scale shrinks on reconstruction |
| 10 | Procedural time such as referral to a council when the works cover 1 ha or more | Kobe requires consultation with its parks and green space council, extending the schedule |
Source: compiled by MetroEngines Research & Consulting from each municipality’s Scenic District ordinance and permit application guidance
Item nine weighs especially heavily on lenders assessing collateral value and rebuild feasibility. Nagoya’s guidance states explicitly that on reconstruction the height limit is that the building may not exceed its pre-reconstruction height. A legally non-conforming hotel or ryokan built before the district was designated may therefore be unable to reproduce its current room count if rebuilt. The figure being carried as collateral is one that does not survive renewal. The same limit has to be built into both the capex plan and the rebuild scenario when acquiring an operating property.
Item two is no lighter. The cabinet order fixes only the ranges — height 8-15 m, coverage 20-40%, wall setback 1-3 m — and the actual values depend on the ordinance. Worse, an identically named type means different things in different municipalities. This is not a regulation a single nationwide checklist can dispose of, and that is the practical characteristic that most distinguishes Scenic Districts from use zoning.
Conclusion — "there is FAR left over" is not a reason to buy
A Scenic District is an area classification under Article 8 of the City Planning Act, a second layer laid over the use zone. Nationwide, 765 districts covering 170,105.7 hectares are designated (as of 31 March 2017): 16 districts and 3,698 ha in Yokohama, 10 districts and roughly 9,215 ha in Kobe, 18 districts and about 3,000 ha in Nagoya, 55.5% of the municipal area in Kamakura, and two districts totalling roughly 1,088 ha in Ashiya. They are spread as broad zones across the hillsides and coastlines of the major metropolitan regions.
The variables constrained are not FAR or absolute height but building coverage, green-space ratio and wall setbacks, plus permit control over tree felling and land-form change. On a 1,000 sqm site at 200% FAR with 40 sqm of floor area per room, the 50 rooms buildable outside a Scenic District fall to 40 at 40% coverage, 22 at 30%, 15 at 20% with a 10 m cap, and 10 rooms at 20% with an 8 m cap. Land cost per room rises from ¥6.6M to ¥33.0M — five times higher (at ¥330,000/sqm). The RevPAR premium needed to hold the same yield is +43.1% to +74.0% in the Type 1 cases.
Look at actual supply and central Kamakura averages 12.3 rooms per property, one-tenth of the level in front of Nagoya Station (117.6). Nagoya’s Yagoto-Higashiyama and Ashiya’s Rokurokuso-Yamatecho hold one to two properties within a 1.5 km radius, and Sendai’s Dainohara none. In our ownership master for seven listed REITs, the 30-plus properties across the five prefectures are overwhelmingly station-front or central; the exceptions are hot-spring resort properties in Hakone and Odawara, and no property could be confirmed in the suburban Scenic District areas examined here.
Then there is rate. Locations with genuine destination pull, such as Kamakura (+104%) and Sendai’s Taihaku Ward (+90%), clear the required premium; suburban residential settings such as Nagoya’s Chikusa Ward (+8%) and Kobe’s Suma Ward (+23%) do not. A hotel of any scale works inside a Scenic District only where the location is strong as a destination. “No competitors” does not translate into “we can command a price.”
In practice, that means placing the presence and type of a Scenic District as its own line item immediately after the use-zone and FAR checks. Unused 200% FAR is of no help on a site capped at 20% coverage. Type 3 means almost no impact; Type 1 means one-fifth of the rooms — a difference that moves project viability far more than a difference in land price does.
A note on the estimates: the room counts, land costs and required RevPAR premiums in this article are simplified figures resting on shared assumptions of a 1,000 sqm site, 200% FAR, 40 sqm of floor area per room and 3.1-3.5 m floor-to-floor heights. An actual scheme will vary with site shape, road frontage, shadow regulations, setback-line rules, minimum parking requirements, fire and evacuation codes, and case-by-case consultation within the Scenic District permit process. An investment decision requires a detailed feasibility study and prior consultation with the responsible municipality. Scenic District boundaries and types are also revised through changes to city plans, so always confirm against the city-planning information current at the time of your survey.
Related Reading
- Japan Earthwork Permits Cover 81.8% of Land: Slope Resort Costs 2026
- Japan FAR Bonus: 138 Districts, 10.96M sqm, Under 10% Becomes Rooms
- Hotel-to-Housing Conversion: Break-Even ADR ¥3,827-4,594 in 3 Cities
- Japan 1-Room Lodging License: Legal Since 2018, 51% of 2026 Openings
- Hotel Development Capacity 2026: Zoning, FAR & Land Price in 5 Markets
- 61% of 2026 Hotel Openings Fall Outside Urbanization Promotion Areas
- Leasehold Hotel Development: 1.38x Land Price Reach Across 9 Markets
References and Sources
■ Data sources
Scenic District designation figures are from MLIT’s City Planning Status Survey (as of 31 March 2017); the numerical standards by type are taken from the primary Scenic District ordinances and permit application guides of Yokohama, Kamakura, Nagoya, Kobe, Ashiya, Sendai, Fukuoka and Yamatokoriyama. Lodging locations and room counts (N=553 properties, 54,958 rooms; based on listings confirmed as of September 2026), municipal estimated settled ADR (monthly medians, September 2025-August 2026) and the J-REIT ownership master (302 domestic properties) are compiled by MetroEngines Research & Consulting. Construction unit costs are 2025 actuals from MLIT’s Statistics on Building Construction Starts; land prices are 2026 published land price municipal averages for residential land.
■ Estimation assumptions
The shared assumptions are a 1,000 sqm site, a Category 1 Residential use zone (60% coverage, 200% FAR) and 40 sqm of floor area per room (a 25 sqm room plus common areas, guest rooms being 62.5% of the total). Storey counts are derived from the height cap: 8 m gives two floors, 10 m three (3.1 m floor-to-floor), 15 m four (3.5 m). Buildable floor area is the smaller of site x FAR and site x coverage x storeys. Construction cost is fixed at ¥2.405M per tsubo for steel frame (12.1 tsubo per room, about ¥29.1M), and construction-cost inflation, economies of scale and differences in design efficiency are not built into the main estimates. The required RevPAR premium is computed against total investment in the baseline case.
■ Limitations and caveats
Room counts, land costs and required RevPAR premiums are simplified figures resting on shared assumptions; an actual scheme varies with site shape, road frontage, shadow regulations, setback-line rules, minimum parking requirements, fire and evacuation codes, and case-by-case consultation within the Scenic District permit process. The areas used in the field check do not identify Scenic District boundaries parcel by parcel; they approximate, with radius circles, areas in which designations are widely distributed, so undesignated land also falls inside each circle. Because demand itself differs between hillside and station-front settings, neither the density gap nor the rate gap can be attributed entirely to regulation. Estimated settled ADR is an estimate, and wards computed from only two to four properties (Nagoya’s Chikusa, Kobe’s Suma and Fukuoka’s Nishi) are sensitive to the mix of individual properties. The prefecture-level extract from the J-REIT ownership master is a lower bound matched on property name and municipality. Scenic District boundaries and types are revised through changes to city plans, so always confirm against the city-planning information current at the time of your survey.
■ Market data
- MetroEngines Research & Consulting — estimated settled ADR (monthly, by prefecture and municipality), lodging locations and room counts (listing-confirmed basis, N=553 properties, 54,958 rooms), and the J-REIT ownership master (302 domestic properties)
■ National legislation and systems
- MLIT, "Parks and Greenery: the Scenic District System"
- MLIT, "Scenic District Designation Status" (City Planning Status Survey, as of 31 March 2017: 765 districts, 170,105.7 ha)
- MLIT, "Statistics on Building Construction Starts" (reference for construction unit costs)
■ Municipal ordinances and permit standards
- City of Nagoya, "Guide to Permit Applications for Building in Scenic Districts" (April 2026)
- City of Nagoya Ordinance on Regulation of Building in Scenic Districts
- City of Kobe, "Scenic District Permit Standards"
- City of Ashiya, "Outline of Scenic Districts" (December 2023)
- City of Kamakura, "Kamakura Scenic District Ordinance"
- City of Yokohama, "List of Yokohama Scenic Districts"
- City of Sendai, "Acts within Scenic Districts"
- City of Yamatokoriyama, "Permit Standards under the Scenic District Ordinance (principal numerical standards)"
- City of Fukuoka Ordinance on Regulation of Building in Scenic Districts
■ Land prices