

The value of a hotel as an asset is set by the income it generates as a lodging business. So when that lodging demand does not hold up as underwritten, what is the building worth, and who will buy it? The “entry” debate — converting offices and retail into hotels — has accumulated a body of analysis. The reverse direction, the “exit” — whether a hotel can be turned back into apartment housing or a dormitory (company or student housing) — is rarely quantified, even though it governs collateral valuation and the breadth of the bidder pool at sale.
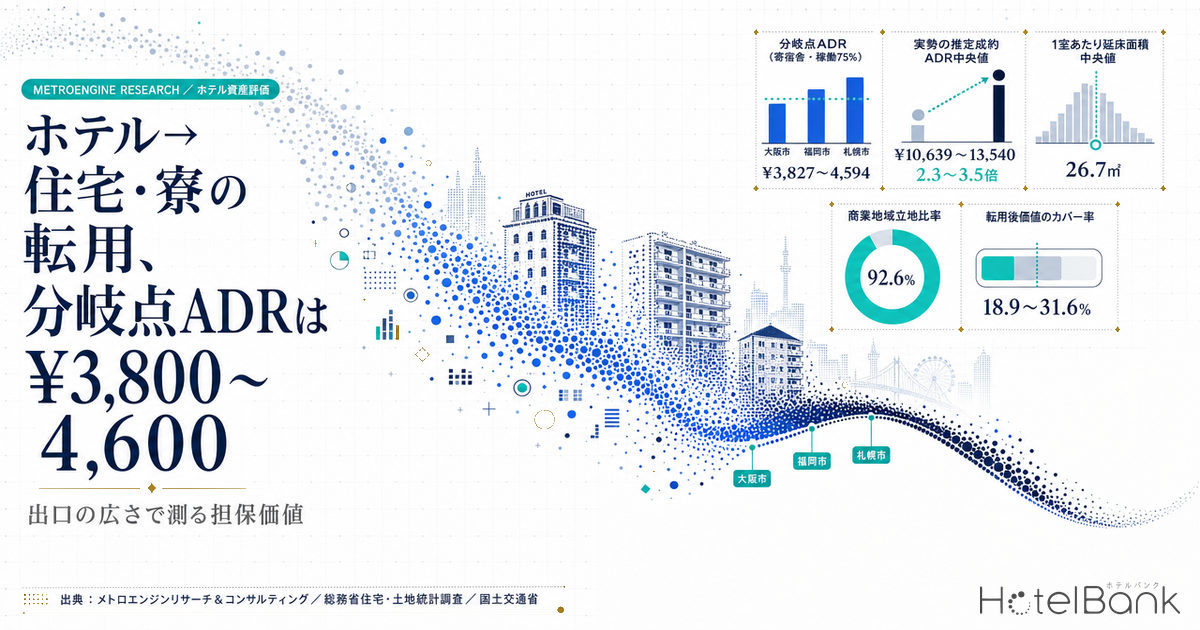
This article first walks through how far the Building Standards Act actually permits such a change of use, then calculates, for three markets — Osaka, Fukuoka and Sapporo — the break-even ADR at which rental income overtakes hotel income, at three occupancy levels, and estimates what share of the hotel valuation the post-conversion asset value covers. To state the conclusion up front: the break-even ADR is only ¥3,800–4,600 for conversion to a dormitory and ¥2,800–3,700 for conversion to apartment housing, while the prevailing estimated settled ADR sits 2.3–3.5x higher. Reverse conversion is not a story about winning on income; it is a story about how to price residual value in a downside scenario and the width of the buyer base.
How this differs from our earlier coverage
- Our earlier work on office-to-hotel site screening, hospital-site hotel conversion, and retail and logistics conversion into hotels all deals with the entry (other use to hotel). This article covers the exit (hotel to residential use), where a different set of code provisions bites because the destination is residential, and the income forming the denominator of the calculation is a different thing entirely.
- Our earlier piece on student-dormitory / hotel hybrid investment concerns operations — staying in the lodging business and switching guest segments by season. This article is about changing the building’s legal use category itself, which puts the approval process and the capex on a different order of magnitude.
Metric Definitions Used in This Article
- ADR (average daily rate): an estimated settled rate (tax-excluded equivalent) derived by applying a format-specific adjustment coefficient to the cheapest plan each property publishes on OTAs (two guests in one room, per-room rate, tax included). Cross-checked against property-level actuals disclosed by listed hotel REITs (91 properties, most recent three months), the median error is about 7%. These are estimates and differ from each property’s actual transacted rates and accounting figures. Area-level ADR is the median across the properties in scope (the level of a typical property in that area).
- OCC (occupancy): the share of rooms sold against total rooms in the area (an estimate based on OTA sales inventory; consistency checks against monthly REIT disclosures confirm accuracy within roughly a few percentage points). Used only at the prefecture and municipality level; occupancy for individual properties is not calculated.
- NOI: net operating income from real estate. In this article it is set as a ratio to revenue for hotels and as a ratio to fully-occupied rent for residential use, both as simplified estimates (assumptions given below).
- Break-even ADR: the ADR at which the NOI from operating as a hotel equals the NOI after conversion to a residential use. Below this level, conversion is the better outcome on income alone.
- Data sources: MetroEngines Research & Consulting (based on verified OTA listings) / Ministry of Internal Affairs and Communications “Housing and Land Survey” and “Retail Price Survey” / Ministry of Land, Infrastructure, Transport and Tourism “Real Estate Information Library,” “Building Construction Statistics” and “National Land Numerical Information” / Japan Real Estate Institute “Japanese Real Estate Investor Survey”
- — The break-even ADR is ¥3,827–4,594 for a dormitory and ¥2,758–3,667 for apartment housing (assuming 75% occupancy, a conservative setting below the estimated prevailing occupancy of June 2026). The prevailing estimated settled ADR sits 2.3–3.5x higher, so there is no market among the three cities where conversion wins on income.
- — The regulatory step is lower on the exit side. Under Article 137-19(1)(iii) of the Enforcement Order, hotels, apartment housing and dormitories sit in the same group, so retroactive application to existing non-conforming portions is, as a rule, not applied (Article 48 of the Act excepted).
- — Zoning is not the bottleneck. Across 726 properties in the three cities, 92.6% sit in Commercial Zones, and not one was in an Exclusive Industrial Zone, where housing cannot be built.
- — The median gross floor area per room is 26.7 m² (N=470 properties), which works as a single dormitory room as-is but presumes merging two rooms for apartment housing. Construction cost runs ¥1.5–2.0mn per room versus ¥2.25–3.25mn — a 1.3–1.9x gap.
- — Post-conversion value covers 18.9–31.6% in normal conditions, but rises to 47.3–79.0% once hotel NOI has fallen to 40% of normal. Convertibility should be priced not into the acquisition price but as a floor under the downside.
Entry and exit are not symmetrical under the code
Start with the procedure. Under Article 87(1) of the Building Standards Act, a change of use requires a change-of-use confirmation application when the post-change use is a special building listed in column (i) of Appended Table 1 of the Act and the floor area of that portion exceeds 200 m². Hotels and ryokan, and apartment housing and dormitories, are all listed side by side in item (2) of that table.
This is where many feasibility studies go wrong, on the question of “similar uses.” Article 137-18 of the Enforcement Order of the Building Standards Act lists the combinations of similar uses that do not require a confirmation application, placing “hotels, ryokan” in item (iv) and “boarding houses, dormitories” in item (v). They sit in separate items, so neither a change from hotel to dormitory nor one to apartment housing escapes the confirmation application as long as the area exceeds 200 m². The intuition that hotels and dormitories have similar floor plans and therefore a lighter procedure does not hold under the code.
Yet the classification changes for the same term “similar uses” once you move to Article 137-19(1) of the Enforcement Order. That provision defines the scope in which retroactive application to existing non-conforming buildings under Article 87(3) of the Act is not applied, and its item (iii) puts “hotels, ryokan, boarding houses, apartment housing, dormitories” into a single item. In other words, a change of use from hotel to a residential use does not, as a rule, trigger retroactive application of current evacuation and fire-prevention provisions to existing non-conforming portions. On the entry side — converting an office into a hotel — this exemption does not operate.
This is the core of the asymmetry between entry and exit. The procedure arises in the same way, but the heaviest risk for an existing building, retroactive application, is structurally smaller on the exit side. Note, however, that under the proviso to that paragraph, Article 48 of the Act (restrictions on buildings by use district) is outside the exemption, so whether residential use can be built in the site’s use district must always be confirmed separately. We test this point against actual data later in the article.
Next, set aside retroactivity and organise the provisions that newly apply because of the post-change use. This is where the difficulty gap between a dormitory and apartment housing appears.
| Issue | Hotel (current) | Change to dormitory | Change to apartment housing |
|---|---|---|---|
| Change-of-use confirmation application | — | Required above 200 m² (Act Art. 87(1) / a different item from hotels under Enforcement Order Art. 137-18) | |
| Retroactive application to existing non-conforming portions | — | As a rule not applied (grouped together in Enforcement Order Art. 137-19(1)(iii)). Article 48 of the Act excepted | |
| Daylighting of habitable rooms (Act Art. 28(1)) | Not applicable (guest rooms are not listed in the table of Enforcement Order Art. 19(3)) | At least 1/7 of floor area for bedrooms. Relaxable to 1/10 with lighting equipment | At least 1/7 of floor area for habitable rooms used for dwelling. Likewise relaxable to 1/10 |
| Party walls (Act Art. 30 / Enforcement Order Art. 22-3) | Not applicable | Not applicable (dormitories are out of scope) | Sound insulation performance required on the party wall of each unit (125 Hz 25 dB / 500 Hz 40 dB / 2000 Hz 50 dB) |
| Fire-critical partition walls (Enforcement Order Art. 114) | Quasi-fire-resistant construction up to the attic under paragraph 2 (already applied) | Paragraph 2 continues to apply (equivalent standard) | Switches to “party walls of each unit” under paragraph 1 (quasi-fire-resistant construction up to the attic) |
| Corridor width (Enforcement Order Art. 119) | 1.2 m / 1.6 m on floors where habitable room floor area totals over 200 m² | Same (the threshold does not change) | 1.2 m / 1.6 m on floors where dwelling unit floor area totals over 100 m² (the threshold drops) |
| Emergency lighting (Enforcement Order Art. 126-4) | Required (Appended Table 1, item (2)) | Bedrooms excluded (Art. 126-4(1)(ii)) | Dwelling units excluded (Art. 126-4(1)(i)) |
| Facilities per unit | — | A shared kitchen and bathroom suffice | In practice, rental market and financing terms require a kitchen, bathroom and toilet in each unit |
Read across Table 1 and the shape of the staircase emerges. For conversion to a dormitory, the only provision that materially bites anew is the daylighting rule. Fire-critical partition walls were already held to the same standard in the hotel era, and emergency lighting actually becomes unnecessary. Nor is there any need to fit plumbing in every unit.
For conversion to apartment housing, by contrast, the sound insulation performance of party walls is added — a physically expensive requirement. On top of that, though not a code requirement, making the building work as rental housing means a kitchen, bathroom and toilet in every unit. Water supply, drainage and electrical capacity have to be rebuilt, and the construction cost moves an order of magnitude.
On daylighting, the proviso to Enforcement Order Art. 19(3), in force from 1 April 2023, allows the required effective daylighting area to be reduced from 1/7 to 1/10 of floor area where lighting equipment securing at least 50 lux at floor level is installed. Hotel guest rooms often have small windows, so this relaxation genuinely decides whether a residential conversion is feasible. According to MLIT’s published materials, the confirmation application drawings must state the position of the lighting equipment and that at least 50 lux is secured.
One further practical precondition is whether a certificate of completion inspection exists. A change-of-use confirmation application presumes the legality of the existing building, so where no certificate exists, the project must go through a legal-compliance status survey using a designated confirmation and inspection body (MLIT guidelines). The time and cost this survey requires should be budgeted separately from the conversion capex discussed below.
Screening on physical conditions — what a median of 26.7 m² per room means
Clearing the code is meaningless if the floor plan cannot become housing. Within the coverage of MetroEngines Research, we aggregated gross floor area per room for business hotels nationwide where both gross floor area and room count are registered (15 rooms or more, N=470 properties).
The median is 26.7 m², with a quartile range of 21.3 m² to 34.0 m². Since gross floor area includes the lobby, corridors, plant rooms and staff areas, it is reasonable to read the guest room itself as about 60% of that — roughly 13–20 m². That works as a studio, but it is small for a single unit of apartment housing with its own kitchen, bathroom and toilet.
Conversion to apartment housing therefore almost necessarily becomes an exercise in merging two rooms into one dwelling unit. Gross floor area of 26.7 m² × 2 = 53.4 m², or roughly 33 m² of exclusive area. That falls in the “30–49 m²” band of the Ministry of Internal Affairs and Communications “Housing and Land Survey” area classification, which is the main battleground of the rental market for singles and dual-income couples. The three bands under 35 m² highlighted in blue in Figure 1 account for 77.5% of the total, and on a merged basis this cohort reaches a standard 1LDK or 1DK size. Conversion to a dormitory, by contrast, needs no merging at all, because one guest room can serve as one dormitory room.
Next we narrow the candidates among operating properties in the three markets by scale and building age. We limited the set to lodging-focused formats (business, city, resort, capsule and adults-only) and applied two conditions: 50 rooms or more, where economies of scale in construction and management apply, and compliance with the new seismic standard (opened in 1982 or later, where the June 1981 revision is presumed to apply).
| Market | All operating lodging properties | Lodging-focused formats | Of which 50+ rooms | Of which opened 1982 or later | Share of all rooms opened 1982 or later |
|---|---|---|---|---|---|
| Osaka City | 764 properties / 79,105 rooms | 486 properties / 66,670 rooms | 341 properties / 62,708 rooms | 299 properties / 53,987 rooms | 68.2% |
| Fukuoka City | 290 properties / 31,323 rooms | 199 properties / 29,163 rooms | 160 properties / 28,026 rooms | 139 properties / 23,297 rooms | 74.4% |
| Sapporo City | 217 properties / 28,694 rooms | 159 properties / 27,550 rooms | 140 properties / 27,056 rooms | 115 properties / 21,879 rooms | 76.2% |
Across the three cities, 553 properties and 99,163 rooms meet all three conditions — lodging-focused format, 50 rooms or more, opened 1982 or later. About 70% of all rooms fall into this cohort. On physical conditions alone, the population is amply deep.
Zoning is not a constraint — 92.6% of 726 properties in three cities are in Commercial Zones
As noted above, Article 48 of the Act (use-district restrictions) is the one provision where the existing non-conforming exemption does not operate on a change of use. Whether the post-conversion use can be built in the site’s use district must be confirmed on its own.
We therefore matched 730 lodging-focused properties with 30 rooms or more across the three cities against city planning decision data (use districts) from MLIT’s Real Estate Information Library, using property coordinates, and identified the use district each sits in (726 could be determined).
The result is unambiguous. 92.6% of the 726 properties across the three cities (672 properties) sit in Commercial Zones. Quasi-Industrial Zones account for 23 properties, residential-type use districts for 23, and Neighbourhood Commercial Zones for 8. And not a single property stands in an Exclusive Industrial Zone, where housing may not be built.
Both apartment housing and dormitories may be built in Commercial Zones, and the floor area ratios are comfortably above what residential use requires — 600% for 171 properties, 800% for 142 and 400% for 132. The risk of becoming existing non-conforming is also small. In short, as far as hotel locations are concerned, a change of use to residential carries no zoning bottleneck. The hypothesis often placed at the front of this topic — that lodging properties in residential use districts are the ones best suited to housing conversion — does not survive contact with the data, because urban hotels are barely sited in residential districts in the first place.
That said, this only establishes what may be built. A Commercial Zone is not necessarily where housing demand is thickest. Who would actually live there after conversion needs to be read by the character of the location.
Where the resident population is thick, conversion to apartment housing connects readily to the rental market. Where employment and the office share of workers are high, dormitory demand — company housing and accommodation for employees on single postings — provides the absorption. The two are not mutually exclusive, but the assumed rent level and the leasing channel differ.
| Metric | Namba, Osaka | Hakata Station, Fukuoka | Susukino, Sapporo |
|---|---|---|---|
| Resident population, 2025 estimate (1.5 km radius) | 138,025 | 96,612 | 84,542 |
| Change to 2040 | +7.5% | +1.3% | +3.7% |
| Share aged 65+ (2025) | 15.5% | 14.6% | 21.6% |
| Business establishments (1 km radius) | 9,695 | 9,758 | 9,839 |
| Workers (1 km radius) | 134,031 | 171,730 | 130,609 |
| Office-sector share of workers | 15.2% | 30.4% | 32.6% |
Namba in Osaka has the thickest resident population of the three, at 138,025 within a 1.5 km radius (2025 estimate), and is projected to grow a further +7.5% by 2040. Its office-sector share of workers is low at 15.2%, with employment concentrated in retail, food service and other services. As a location for apartment housing conversion, it offers the best conditions of the three cities.
Hakata Station in Fukuoka and Susukino in Sapporo, by contrast, have high office-sector shares of 30.4% and 32.6% respectively. The Hakata Station area has the largest worker count of the three at 171,730. These read as locations that connect more naturally to the dormitory model — company housing and accommodation for employees on single postings. Sapporo also has the highest share aged 65+ of the three at 21.6%, and the different age composition of its resident population affects the profile of the tenants one would assume. On how the ageing of a trade area itself constrains a hotel’s ownership exit, our earlier analysis of how ageing trade areas constrain hotel exits digs into the extreme cases of Atami at 49.1% and Takayama at 38.8%.
Break-even ADR is ¥2,758–4,594 — 2.3 to 3.5 times below prevailing rates
Now to the income comparison. First, the current level on the hotel side. We rebuilt MetroEngines Research’s estimated settled ADR monthly, as a median weighted by property count across each city’s administrative wards.
The trailing twelve-month average (August 2025 to July 2026) is ¥12,173 in Osaka, ¥14,273 in Fukuoka and ¥14,584 in Sapporo. Osaka’s path stands out: June 2026 was down 35.8% year on year and July down 32.4%, a marked step down in level. This is the clear payback from the special demand around the 2025 World Exposition. Fukuoka was up 4.8% year on year in July 2026 and Sapporo up 3.9%, both above the prior year. How that payback splits across formats such as city and business hotels is tracked month by month in our analysis of Osaka’s post-Expo estimated settled ADR.
This is exactly why owners in Osaka are testing their exit now. Once the numbers show that peak income will not simply persist, the next question is what the building is worth if the lodging business stops.
For income on the residential side, we use monthly rent for privately rented housing (apartment buildings, non-wooden, excluding zero-rent) from the Ministry of Internal Affairs and Communications “2023 Housing and Land Survey.” It is primary statistics published down to the municipal and ward level, and because it reflects rents actually being paid by resident households, it is more conservative than advertised asking rents.
| Item | Osaka City | Fukuoka City | Sapporo City | Source / rationale |
|---|---|---|---|---|
| Estimated settled ADR (trailing 12-month average) | ¥12,173 | ¥14,273 | ¥14,584 | MetroEngines Research |
| Hotel NOI margin (on revenue) | 30% | A conservative figure derived by deducting property tax, insurance and an FF&E reserve equivalent from the 38.9% GOP margin (up 1.6 points year on year) disclosed for 91 MHM-operated domestic properties in Invincible Investment Corporation’s “Fiscal Period Ended December 2024 Results Presentation” (published 26 February 2025) | ||
| Private rent, 29 m² or less (monthly) | ¥51,910 | ¥46,748 | ¥43,244 | 2023 Housing and Land Survey (apartment buildings, non-wooden) |
| Private rent, 30–49 m² (monthly) | ¥70,437 | ¥62,806 | ¥52,990 | Same as above |
| Residential occupancy / NOI margin | 95% / 75% of fully-occupied rent | A general level after deducting management fees, repairs, property tax and PM fees | ||
| Dormitory rent level | 85% of the 29 m²-or-less band | A conservative figure assuming shared facilities in place of a private kitchen and bathroom | ||
| Apartment housing unit composition | 2 guest rooms = 1 dwelling unit | 26.7 m² gross floor area per room × 2 = 53.4 m², roughly 33 m² of exclusive area (Figure 1) | ||
| Expected yield: limited-service hotel | 4.5% | 4.7% | 5.0% | Japan Real Estate Institute, 54th Japanese Real Estate Investor Survey (as of April 2026) |
| Expected yield: single-building studio rental housing | 4.3% | 4.5% | 5.0% | Same as above |
On these assumptions we computed annual NOI per room after conversion to a residential use, then back-solved the ADR at which a hotel would generate the same NOI — the break-even ADR — at three occupancy levels.
| Market and destination use | 65% occupancy | 75% occupancy | 85% occupancy | Median prevailing ADR | Properties below the 75% break-even |
|---|---|---|---|---|---|
| Osaka City → dormitory | ¥5,300 | ¥4,594 | ¥4,053 | ¥10,639 | 6.5% (N=261) |
| Osaka City → apartment housing | ¥4,231 | ¥3,667 | ¥3,235 | ¥10,639 | 5.4% (N=261) |
| Fukuoka City → dormitory | ¥4,773 | ¥4,137 | ¥3,650 | ¥13,445 | 0.7% (N=136) |
| Fukuoka City → apartment housing | ¥3,772 | ¥3,269 | ¥2,885 | ¥13,445 | 0.7% (N=136) |
| Sapporo City → dormitory | ¥4,416 | ¥3,827 | ¥3,377 | ¥13,540 | 0.0% (N=110) |
| Sapporo City → apartment housing | ¥3,183 | ¥2,758 | ¥2,434 | ¥13,540 | 0.0% (N=110) |
At 75% occupancy (the assumption used in the calculation; a conservative setting below the estimated prevailing occupancy of 83.9–90.5% in June 2026), the break-even ADR for conversion to a dormitory is ¥4,594 in Osaka, ¥4,137 in Fukuoka and ¥3,827 in Sapporo. For apartment housing it is lower still, at ¥2,758–3,667. The break-even is lower for apartment housing because merging two guest rooms into one dwelling unit thins the rental income when expressed per room.
Against that, the median property-level estimated settled ADR is ¥10,639 in Osaka, ¥13,445 in Fukuoka and ¥13,540 in Sapporo. Prevailing rates sit 2.3–3.5 times above the break-even. The share of properties below the break-even is 6.5% in Osaka, 0.7% in Fukuoka and 0.0% in Sapporo.
Dropping occupancy to 65% moves the break-even only into a ¥3,183–5,300 range, and the conclusion does not change. Under current market conditions, there is no market among the three cities where reverse conversion to residential use beats hotel operation on income. That does not negate the value of conversion as an option; it is the starting point for identifying where that value actually resides.
Conversion capex — ¥1.5–2.0mn per room for a dormitory, ¥4.5–6.5mn per unit for apartment housing
Now lay construction cost over the income comparison. According to MLIT’s “Building Construction Statistics,” planned construction cost for residential-only buildings in 2024 was ¥249,428 per m² nationwide (¥825,000 per tsubo). For lodging-industry buildings in the same year it was ¥591,279 per m² (¥1,955,000 per tsubo). Conversion work reuses the existing frame and centres on rebuilding interiors and services, so it typically lands at 50–70% of the cost of new residential construction.
| Work item | Dormitory (per room) | Apartment housing (per unit = 2 guest rooms) |
|---|---|---|
| Interior renewal (floors, walls, joinery, fit-out) | ¥700,000–900,000 | ¥1.0–1.4mn |
| Lighting and electrical work for the daylighting relaxation | ¥100,000–150,000 | ¥150,000–250,000 |
| Merging two rooms (partition removal, openings, making good) | — | ¥500,000–800,000 |
| New kitchen (water, drainage, extract, electrical capacity) | Apportioned as a shared kitchen, ¥250,000–400,000 | ¥1.1–1.6mn |
| Bathroom, washbasin, laundry space | Apportioned as shared, ¥200,000–300,000 | ¥1.0–1.5mn |
| Sound insulation works on party walls (Act Art. 30 / Enforcement Order Art. 22-3) | — | ¥500,000–800,000 |
| Review of fire services and automatic fire alarms | ¥150,000–200,000 | ¥150,000–250,000 |
| Design and change-of-use confirmation application (apportioned) | ¥100,000–150,000 | ¥150,000–250,000 |
| Total | ¥1.5–2.0mn per room | ¥4.5–6.5mn per unit (¥2.25–3.25mn per room) |
In the valuation that follows we use midpoints of ¥1.75mn per room for a dormitory and ¥5.5mn per unit for apartment housing (= ¥2.75mn per room). The ¥5.5mn per apartment unit is about 67% of the new-build cost for 33 m² of exclusive area (33 m² × ¥249,428 ≈ ¥8.23mn), a reasonable position for work that installs plumbing from scratch.
What matters here is that construction cost per room differs by 1.3–1.9x between a dormitory and apartment housing. The regulatory staircase seen in Table 1 — party wall sound insulation and plumbing in every unit — reappears directly as a staircase in cost.
A wide exit works as residual value in a downturn, not as price support
With income and construction cost in hand, we can compare asset values. Post-conversion value per room is calculated as “residential NOI ÷ expected yield for rental housing − construction cost,” and set against value as a hotel (hotel NOI ÷ expected yield for limited-service hotels). We treat 75% occupancy (the assumption used in the calculation; a conservative setting below the estimated prevailing occupancy of 83.9–90.5% in June 2026) as normal conditions.
| Market | Hotel NOI | Hotel value | Dormitory NOI | Dormitory value (net of capex) | Coverage | Apartment housing value (same) | Coverage |
|---|---|---|---|---|---|---|---|
| Osaka City | ¥999,708 | ¥22,215,725 | ¥377,256 | ¥7,023,394 | 31.6% | ¥4,252,748 | 19.1% |
| Fukuoka City | ¥1,172,170 | ¥24,939,790 | ¥339,741 | ¥5,799,802 | 23.3% | ¥3,216,570 | 12.9% |
| Sapporo City | ¥1,197,711 | ¥23,954,220 | ¥314,276 | ¥4,535,515 | 18.9% | ¥1,780,645 | 7.4% |
In normal conditions, coverage is 18.9–31.6% for a dormitory and 7.4–19.1% for apartment housing. Conversion to a residential use supports only 20–30% of the hotel valuation. And these are income-capitalisation values; in central commercial districts, the vacant-land price forms a separate floor that should be kept in mind.
Worth noting is how little the difference in expected yields matters. According to the 54th Japanese Real Estate Investor Survey (as of April 2026), the gap in expected yield between limited-service hotels and single-building studio rental housing is 0.2 points in Osaka, 0.2 points in Fukuoka and 0.0 points in Sapporo. Virtually the entire difference in value comes from the difference in NOI. There is little room for a skilful conversion to improve the capitalisation rate; the contest is over NOI itself.
| Private rent, 29 m² or less | 4.0% | 4.3% | 4.5% | 4.8% | 5.0% |
|---|---|---|---|---|---|
| −20% (¥41,528 monthly) | 26.1% | 23.7% | 22.3% | 20.4% | 19.3% |
| −10% (¥46,719 monthly) | 30.3% | 27.7% | 26.1% | 24.0% | 22.7% |
| Base (¥51,910 monthly) | 34.6% | 31.6% | 29.9% | 27.5% | 26.1% |
| +10% (¥57,101 monthly) | 38.8% | 35.6% | 33.6% | 31.0% | 29.5% |
| +20% (¥62,292 monthly) | 43.1% | 39.5% | 37.4% | 34.6% | 32.9% |
Flexed on both axes, coverage in normal conditions stays within a range of 19.3% to 43.1%. Even on the combination most favourable to the residential side — rent 20% higher and the expected yield pulled down to 4.0% — coverage reaches only 43.1%, less than half the hotel valuation. Changing the assumptions does not move the conclusion that normal-condition coverage is 20–40%. The variable that moves coverage materially is not on the residential side but the denominator: hotel NOI itself.
So how should that 20–30% be used? The shape becomes clear once you look at how coverage moves as hotel NOI declines from normal levels.
Once hotel NOI falls to 60% of normal, coverage for a dormitory conversion rises to 52.7% in Osaka, 38.8% in Fukuoka and 31.6% in Sapporo. At 40%, it reaches 79.0% in Osaka, 58.1% in Fukuoka and 47.3% in Sapporo. In Osaka, post-conversion value overtakes the hotel valuation once hotel NOI has fallen to 30% of normal (105.4%).
This is what “the width of the exit” really is. Convertibility does not push up the sale price in normal conditions. It works as a floor that halts the slide toward zero when lodging demand contracts structurally. An asset that only prices as a hotel loses half its value when demand halves. An asset that can be converted to residential use finds another buyer partway down.
And the change in the character of the buyer matters more than the price. A bid for a property only a lodging operator can buy draws hotel operators and hotel-specialist funds alone. A property where residential conversion is realistic adds rental housing developers, corporate housing operators, student dormitory businesses and residential private funds. From a collateral valuation standpoint, the disposal argument is spread from “the outlook for the lodging market” to “the outlook for the residential rental market,” lowering exposure to any single market.
Code The exit carries lighter retroactivity risk
Hotels, apartment housing and dormitories sit in the same group under Enforcement Order Art. 137-19(1)(iii), so retroactive application to existing non-conforming portions is as a rule not applied. A confirmation application above 200 m² is still required, but this exemption — absent on the entry side — underpins the feasibility of the exit. Article 48 (use districts) must still be checked separately.
Physical The dormitory is the practical answer
A median gross floor area of 26.7 m² per room can be used as-is, one room to one dormitory room, whereas apartment housing presumes merging two rooms. Add party wall sound insulation and plumbing in every unit, and capex per room runs 1.3–1.9x higher. On both code and cost, the dormitory staircase is lower.
Investment Price it as insurance
Coverage in normal conditions is 20–30%, so convertibility will not lift today’s price. What should be priced is the floor once hotel NOI has fallen to 40–60% of normal, where coverage reaches 52.7–79.0% in Osaka. Treating it as residual value in a downside scenario is the appropriate approach.
Five items for the investment committee to check
On that basis, here are the items to confirm in acquisition due diligence and in exit reviews of existing holdings. This is not a recommendation to convert any specific property, but a set of lenses for assessing the character of an asset.
| Item | What to look at | Where covered in this article |
|---|---|---|
| 1. Certificate of completion inspection | A precondition for the change-of-use confirmation application. Where absent, budget separately for the legal-compliance status survey route (MLIT guidelines) and its time and cost | Code section |
| 2. Use district | Article 48 is outside the retroactive exemption. Residential use can be built anywhere other than an Exclusive Industrial Zone. 92.6% of urban lodging properties sit in Commercial Zones, so this is not normally a bottleneck | Figure 2 |
| 3. Guest room opening area | Whether effective daylighting area reaches 1/7 of floor area, or 1/10 with lighting equipment installed. Hotel guest rooms often have small windows, and this decides feasibility | Table 1 |
| 4. Area per room and party wall construction | At 25 m² or more per room, a one-to-one apartment unit comes into view. Below that, merging two rooms is the premise. Party wall construction drives the volume of sound insulation work | Figure 1, Table 6 |
| 5. Post-conversion NOI and coverage | Set residential NOI from nearby rents by area band, and calculate what share of the hotel valuation the value net of capex represents. Use coverage in the downside scenario as investment committee decision material | Table 7, Figure 6 |
Conclusion
The answer to whether a hotel can be turned back into housing differs across three layers: code, physical fabric and income.
Under the code, a change of use from hotel to apartment housing or dormitory requires a confirmation application above 200 m², but retroactive application to existing non-conforming portions is as a rule not applied. This exemption, which does not operate on the entry side when converting an office into a hotel, is what underpins the feasibility of the exit. What newly bites is mainly the daylighting rule, and the 1/10 relaxation in force since April 2023 has lightened that burden. For a dormitory, daylighting is close to the only additional provision; for apartment housing, party wall sound insulation and plumbing in every unit are added.
On physical conditions, 553 properties and 99,163 rooms among lodging-focused formats in the three cities meet the tests of 50 rooms or more and opening in 1982 or later. The median gross floor area of 26.7 m² per room works as-is for a dormitory and works for apartment housing on a two-room merge. As for use districts, 92.6% sit in Commercial Zones, and not one property is in an Exclusive Industrial Zone, where housing may not be built.
On income, the break-even ADR is ¥3,827–4,594 for a dormitory and ¥2,758–3,667 for apartment housing. Prevailing estimated settled ADR sits 2.3–3.5 times higher, and the share of properties below the break-even is 6.5% in Osaka, 0.7% in Fukuoka and 0.0% in Sapporo. Post-conversion value covers 18.9–31.6% of the hotel valuation in normal conditions, but reaches 47.3–79.0% once hotel NOI has fallen to 40% of normal.
Convertibility is therefore not a factor that lifts the acquisition price. With rates rising and the new lease accounting standard applying from April 2027, exit reviews of held assets are advancing — and what asset managers and investment committees should be pricing is the height of the floor that halts the fall in valuation when lodging demand misses the plan, and the breadth of the buyers who could join the bidding at that point. Quantifying both, property by property, looks like the most practical way to make the downside in collateral valuation shallower. On how far that rate level pushes up the viability line for new development, our analysis of a 1.00% policy rate and hotel development back-solves the break-even ADR across eight major markets.
Further reading
- Japan’s Pre-1981 Hotel Stock: 236k Rooms, 19.1% — Retrofit or Rebuild
- Old Malls and Warehouses as Next Hotel Rooms: Conversion Investment Boundaries
- Construction +41% & Labor Crunch Erase Japan’s 2027-2029 Hotel Supply
- Aging Trade Areas Constrain Hotel Exits: Atami 49.1% vs Takayama 38.8%
- Department Store Sites: 6 of 14 Go Hotel, ADR Needs 1.4-3.1x Market
- Corporate Retreat Conversions: 8.27% GOP Yield Across 5 Onsen Areas
- Policy Rate 1.00%: Break-Even ADR Across Japan’s 8 Hotel Markets
- Hotel Acquisition Costs 7.1%: A 6.5% Gross Yield Becomes 4.65% Net
- Osaka Settled ADR June 2026: City -26.3%, Business -32.8% Post-Expo
References and Sources
■ Data sources
Hotel-side rates were rebuilt monthly as a median of ward-level estimated settled ADR across the 24 wards of Osaka City, 7 wards of Fukuoka City and 10 wards of Sapporo City, weighted by the number of properties in scope in each ward, with the 12-month average from August 2025 to July 2026 taken as each city’s representative figure (monthly scope averages roughly 505 properties in Osaka, 249 in Fukuoka and 194 in Sapporo, confirmed-basis months only). Property-level ADR is the median across the 507 properties with estimates available for six months or more in the same period (261 in Osaka, 136 in Fukuoka, 110 in Sapporo). Property counts, room counts, opening years and gross floor areas come from the property master (based on verified OTA listings, as of August 2026). Residential rents are monthly rents by area band for privately rented housing (apartment buildings, non-wooden, excluding zero-rent) from the Ministry of Internal Affairs and Communications “2023 Housing and Land Survey.” Expected yields come from the Japan Real Estate Institute “54th Japanese Real Estate Investor Survey” (as of April 2026). Use districts were determined by matching city planning decision data from MLIT’s Real Estate Information Library against property coordinates (726 of 730 properties). Statutory provisions are as in force as of August 2026, per e-Gov Law Search.
■ Calculation assumptions
Hotel NOI = estimated settled ADR × 365 × occupancy × 30% NOI margin. Occupancy is flexed across three levels — 65%, 75% and 85% — with 75% treated as the representative level for normal conditions (estimated prevailing occupancy in June 2026 was 83.9% in Osaka Prefecture, 90.5% in Fukuoka Prefecture and 89.3% in Hokkaido, so 75% is a conservative setting below those). Residential NOI = monthly rent × 12 × 95% residential occupancy × 75% NOI margin. Dormitories are set at 85% of the rent in the 29 m²-or-less band with one guest room as one dormitory room; apartment housing uses the rent in the 30–49 m² band with two guest rooms as one dwelling unit. Conversion capex is deducted at midpoints of ¥1.75mn per room for dormitories and ¥5.5mn per unit (= ¥2.75mn per room) for apartment housing. Asset value is by income capitalisation (NOI ÷ expected yield), using the limited-service hotel yield for hotels and the single-building studio rental housing yield for residential uses. The break-even ADR is back-solved as the ADR at which a hotel would generate NOI equal to the residential NOI.
■ Limitations and caveats
Estimated settled ADR applies format-specific coefficients to OTA listed prices and differs from each property’s actual transacted rates and accounting figures (the median error against property-level disclosures by listed hotel REITs is about 7%). Estimated occupancy is based on OTA sales inventory and is used only at the prefecture and municipality level. Room counts and gross floor areas in the property master can diverge from OTA-published figures and registered areas, so treat them as a distribution. Construction costs are a simplified build-up from new-build unit rates in the Building Construction Statistics and prevailing per-tsubo rates; they exclude the cost of a legal-compliance status survey where no certificate of completion inspection exists, pre-survey and removal costs for asbestos and similar materials, seismic retrofit costs, income foregone during downtime, and demolition or reinstatement costs. Asset values rest on income capitalisation alone; in central commercial districts, the vacant-land price forms a separate floor. Rents are actual rents paid by existing tenant households and may differ from the rents assumed for units marketed after conversion, both in level and in lease-up pace. This article quantifies the structure of the market and does not recommend conversion of any specific property. Individual investment decisions require a property-level feasibility study.
■ Market data
- MetroEngines Research & Consulting — estimated settled ADR (3 cities, by ward, January 2025 to July 2026), property master (room counts, gross floor area, opening year; based on verified OTA listings), estimated occupancy (June 2026)
■ Legislation
- e-Gov Law Search, “Building Standards Act” (Act No. 201 of 1950) — Articles 28, 30 and 87
- e-Gov Law Search, “Enforcement Order of the Building Standards Act” (Cabinet Order No. 338 of 1950) — Articles 19, 22-3, 114, 119, 126-4, 137-18 and 137-19
- MLIT, “Results of the public consultation on the draft partial amendment to the notification prescribing standards for the installation of lighting equipment, securing effective daylighting methods and other equivalent measures” (7 February 2023)
- Shinjuku City, “4-2 On changes of use” (in force from 1 October 2020) — an organisation of the treatment of changes of use
■ Government statistics and public data
- Ministry of Internal Affairs and Communications, “2023 Housing and Land Survey” — privately rented housing (dwellings for exclusive residential use), monthly rent by building type and floor area (government statistics code 0004021532)
- Ministry of Internal Affairs and Communications, “Retail Price Survey (Trends Edition)” — retail prices and private rents by city for principal items (government statistics code 0003421913)
- MLIT, “Building Construction Statistics Survey” — floor area and planned construction cost by use and prefecture (government statistics code 0003114490, 2024)
- MLIT Real Estate Information Library — city planning decision data (use districts)
- MLIT National Land Numerical Information — projected future population by 250 m mesh (FY2024 National Spatial Planning Bureau estimates)
- Ministry of Internal Affairs and Communications / Ministry of Economy, Trade and Industry, “Economic Census for Business Activity (2021)” — establishments and workers (boundaries from the 2020 Population Census small-area data)
■ Industry reports and REIT disclosures
- Japan Real Estate Institute, “54th Japanese Real Estate Investor Survey (as of April 2026)” (published 27 May 2026) — expected yields for limited-service hotels and single-building rental housing
- Invincible Investment Corporation, “Fiscal Period Ended December 2024 Results Presentation” (published 26 February 2025) — GOP margin for 91 MHM-operated domestic properties (38.9%, up 1.6 points year on year)
- Invincible Investment Corporation, portfolio (hotels) — occupancy, ADR and RevPAR actuals for held hotels