

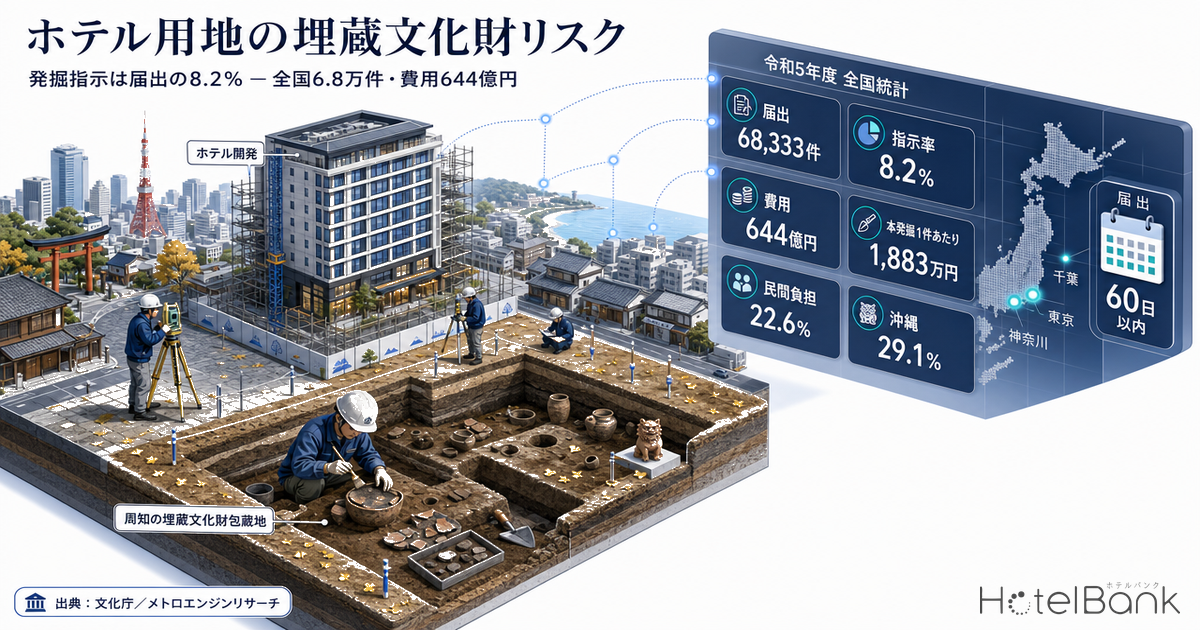
When evaluating a site for a hotel, land price, zoning, floor-area ratio and road frontage are always checked. There is one item, however, that routinely drops out of early due diligence even though it can force a complete rewrite of the construction schedule after contracts are signed: the designated buried cultural property zone (周知の埋蔵文化財包蔵地). According to the Agency for Cultural Affairs (文化庁), roughly 460,000 such zones exist nationwide, and any work that breaks ground inside one — regardless of scale — must be notified to the authorities at least 60 days before the planned start date.
This article uses the national statistics the Agency publishes each year as primary source material to quantify how much this process actually costs a hotel development in money and in months. Filing a notification does not automatically mean an excavation survey. The share of filings that reach a survey is in fact limited. But when it does land, the amount and the number of months are large. Low probability, high impact — for an investment decision, this is exactly the kind of item worth pricing in as a range in advance.
Metric Definitions Used in This Article
- Designated buried cultural property zone: an area publicly identified as containing buried cultural properties such as shell mounds or burial mounds. Under Article 93 of the Act on Protection of Cultural Properties, anyone intending to excavate land inside such a zone for civil engineering or similar work must file a notification at least 60 days before the planned start of construction (national and local government bodies file under Article 94 instead).
- Guidance category: one of four dispositions issued by the local board of education in response to a filing. Preservation in situ (the site is preserved via design changes) / Excavation survey (a survey for record preservation; includes instructions to conduct a test or confirmation survey) / Construction attendance (an official attends during the works) / Careful construction (proceed as planned, with care).
- Test / confirmation survey: a preliminary survey to establish whether remains are present and how far they extend. Full excavation survey: the main survey, digging out the whole area for record preservation. The “case counts” in the statistics are counts of survey projects, not areas.
- ADR (average daily rate): an estimated settled rate (tax-excluded equivalent) calculated by applying a property-type correction factor to the cheapest publicly listed plan level on OTAs (double occupancy, per room, tax included). Cross-checked against per-property results disclosed by listed hotel REITs (91 properties, trailing three months), the median error is approximately 7%. These are estimates and differ from each property’s actual transacted rates and accounting figures. Area-level ADR is the median of the properties covered (the level of a typical property in that area).
- OCC (occupancy rate): sold rooms as a share of total rooms in the area (an estimate based on OTA sales inventory).
- Data sources: Agency for Cultural Affairs, “Statistical Data on Buried Cultural Properties — FY2024” (March 2025, Cultural Properties Division II) / MetroEngines Research & Consulting
FY2023 national results — 68,333 filings, ¥64.4 billion in cost
In FY2023, local governments across Japan received 68,333 notifications and filings for civil engineering work inside designated buried cultural property zones. Of these, 60,231 (88.1%) were private-sector filings under Article 93 of the Act on Protection of Cultural Properties, and 8,102 (11.9%) were notifications from national and local government bodies under Article 94. Emergency excavation survey costs arising from development projects in the same year totalled ¥64.4 billion (¥64,405,836 thousand), up ¥4.16 billion or 6.9% on the previous year.
Only 8.2% of filings proceed to an excavation survey — four guidance categories split the schedule
After a filing is made, the board of education returns one of four guidance categories. That is where cost and schedule diverge. The FY2023 breakdown was careful construction 33,519 cases (49.1%), construction attendance 28,437 cases (41.6%), excavation survey 5,587 cases (8.2%), preservation in situ 137 cases (0.2%) and other 653 cases (1.0%).
In other words, roughly nine out of ten filings can either break ground as planned or proceed once attendance during the works is accepted. The published guidance from the City of Nagoya likewise states explicitly that both attendance for construction-status checks and careful construction carry “no cost to the applicant” (full-time attendance, which may be required on very constrained sites, does carry a cost). Cost lands on the developer in the remaining 8.2% — the cases where an excavation survey is ordered. Even then, those 5,587 cases include instructions to run a test or confirmation survey, so the number that reach a full excavation of the entire footprint is narrower still.
| Guidance category | Cases | Share | Cost to developer | Schedule impact |
|---|---|---|---|---|
| Careful construction | 33,519 | 49.1% | None | Allowing for the 60-day filing period is enough |
| Construction attendance | 28,437 | 41.6% | None | Excavation must be scheduled around attendance dates |
| Excavation survey | 5,587 | 8.2% | Yes in principle (borne by the party causing the works) | Wide range: some end at the test survey, others go to full excavation |
| Preservation in situ | 137 | 0.2% | Design change costs | Foundation type and site layout must be reworked |
| Other | 653 | 1.0% | — | — |
| Total | 68,333 | 100.0% | — | — |
Measured by surveys actually carried out, emergency excavation work driven by development projects in the same year consisted of 14,402 test and confirmation surveys and 3,205 full excavation surveys. Some 82% of the total ended at the test or confirmation stage; only 18.2% went on to full excavation. Set against the 68,333 filings, that puts full excavation at roughly 4.7 cases per 100 filings. Note, though, that filings and surveys straddle fiscal years, so this is a ratio between two annual flows rather than a cohort rate following the same projects through.
The order rate varies almost 20-fold by prefecture — the 8.2% national average is not a usable benchmark
Do not apply the 8.2% national average to your own project. Order rates diverge sharply by prefecture. Among the prefectures with the most hotel openings, Okinawa runs at 29.1%, Tokyo 13.4%, Chiba 12.9% and Osaka 10.7% — all above the national average — while Kanagawa at 2.2% and Shizuoka at 1.5% sit in the low single digits. The gap between top and bottom is nearly 20-fold.
This spread cannot be explained by the density of archaeological sites alone. Differences in local practice matter just as much: how filings are received and counted, how widely the designated zones are drawn, and whether a test survey is run first or a full excavation is ordered directly. Okinawa has the highest order rate at 29.1%, but its base of 79 filings is among the smallest in the country, so the ratio swings widely. Hokkaido is similarly thin at 133 filings. Never read the rate without the base (N) — that is the practical rule here.
Colour shows the excavation order rate against filings. Darker means a higher chance of being ordered to survey. Size and colour do not move together — Kanagawa ranks second nationally by amount but has a 2.2% order rate, while Osaka has a 10.7% order rate yet one of the lowest costs per case in the country.
| Prefecture | 2025 openings | Civil works filings | Excavation ordered | Order rate | Full excavations | Full excav. cost (¥bn) | Per case (¥mn) |
|---|---|---|---|---|---|---|---|
| Okinawa | 127 | 79 | 23 | 29.1% | 47 | 1.98 | 42.17 |
| Tokyo | 115 | 4,739 | 634 | 13.4% | 228 | 8.39 | 36.78 |
| Hokkaido | 100 | 133 | 9 | 6.8% | 20 | 0.97 | 48.67 |
| Shizuoka | 85 | 1,375 | 20 | 1.5% | 55 | 1.01 | 18.42 |
| Kyoto | 85 | 2,848 | 242 | 8.5% | 89 | 2.39 | 26.85 |
| Nagano | 73 | 3,054 | 316 | 10.3% | 60 | 1.46 | 24.31 |
| Chiba | 72 | 2,556 | 329 | 12.9% | 165 | 4.82 | 29.20 |
| Fukuoka | 62 | 1,705 | 89 | 5.2% | 299 | 1.19 | 3.98 |
| Hyogo | 60 | 2,967 | 282 | 9.5% | 123 | 1.35 | 10.99 |
| Osaka | 55 | 8,369 | 897 | 10.7% | 220 | 1.08 | 4.90 |
| Kanagawa | 50 | 6,230 | 140 | 2.2% | 190 | 7.89 | 41.50 |
| Nationwide | 1,741 | 68,333 | 5,587 | 8.2% | 3,205 | 60.36 | 18.83 |
There is no simple relationship in which more openings means a heavier buried cultural property burden. Okinawa, first by openings, is high on both counts — a 29.1% order rate and ¥42.17mn per case — while Hokkaido, third by openings, sits below average on order rate at 6.8% yet runs ¥48.67mn per case, 2.6 times the ¥18.83mn national average. Osaka is the mirror image: 8,369 filings and a 10.7% order rate make an encounter likely on a count basis, but at ¥4.90mn per case the unit cost is low. The probability of being hit and the size of the hit have to be assessed separately.
Full excavation averages ¥18.83mn per case — unit costs vary 12-fold by prefecture
FY2023 saw 3,205 development-driven full excavation surveys nationwide at a cost of ¥60.36 billion, a simple average of ¥18.83mn per case. Test and confirmation surveys numbered 14,402 at ¥4.04 billion, or ¥280,000 per case — two orders of magnitude apart. Whether a project ends at the test survey or goes on to full excavation is the decisive fork on cost as well as schedule.
Across the 11 prefectures in the table above, the highest unit costs are Hokkaido at ¥48.67mn (N=20), Okinawa ¥42.17mn (N=47), Kanagawa ¥41.50mn (N=190) and Tokyo ¥36.78mn (N=228). At the bottom sit Fukuoka at ¥3.98mn (N=299) and Osaka at ¥4.90mn (N=220) — a spread of roughly 12 times. Low unit costs in high-volume Osaka and Fukuoka suggest that a large number of small-scale surveys are being processed. Hokkaido and Okinawa are the opposite: fewer cases, each more likely to be large. Keep in mind that case counts and unit costs tend to move inversely, and set your estimating range according to which type your own project resembles.
Private developers bear 22.6% — large-company cases run ¥20.1mn each
Excavation survey costs are borne, in principle, by the party whose works cause them. The City of Nagoya states this explicitly: “As a rule, we ask the operator who filed the construction notification under Article 93 of the Act on Protection of Cultural Properties to bear the cost” (individuals building a home they will live in themselves bear nothing, thanks to national subsidies).
Splitting FY2023’s ¥60.36 billion in full excavation cost by the party causing the works gives ¥46.73 billion (77.4%, 1,265 cases) for public-sector projects and ¥13.63 billion (22.6%, 1,940 cases) for private ones. Public bodies dominate on amount, but private projects are more numerous. Per case, public runs ¥36.94mn against ¥7.03mn for private — public-sector projects are the larger ones.
| Party causing the works | Sector | Cases | Survey cost (¥bn) | Per case (¥mn) |
|---|---|---|---|---|
| Prefectures | Public | 465 | 15.64 | 33.64 |
| Municipalities | Public | 517 | 10.61 | 20.51 |
| Local government corporations | Public | 20 | 0.63 | 31.44 |
| National ministries and agencies | Public | 187 | 14.27 | 76.29 |
| JR and railway construction corporations | Public | 43 | 1.31 | 30.50 |
| Highway and urban renaissance agencies | Public | 29 | 2.03 | 70.15 |
| Other public corporations | Public | 4 | 2.24 | 560.93 |
| Large enterprises | Private | 272 | 5.47 | 20.10 |
| Small and medium enterprises | Private | 594 | 3.11 | 5.23 |
| Micro enterprises | Private | 30 | 0.13 | 4.27 |
| Cooperatives | Private | 42 | 1.66 | 39.54 |
| Sole proprietors | Private | 231 | 1.04 | 4.51 |
| Private homes | Private | 677 | 0.74 | 1.10 |
| Universities and research institutions | Private | 34 | 0.52 | 15.17 |
| Other | Private | 60 | 0.97 | 16.13 |
| Total | — | 3,205 | 60.36 | 18.83 |
Asking which row a hotel developer falls into, most land in the large enterprise band (272 cases, ¥5.47bn, ¥20.10mn per case) or the SME band (594 cases, ¥3.11bn, ¥5.23mn per case). Those two rows are the central estimates to carry into land acquisition. Private homes top the table on count at 677 cases, but at ¥1.10mn each they are a different animal entirely. The large-enterprise figure of ¥20.10mn sits somewhat above the ¥18.83mn national average, which argues for placing hotel-scale development on the heavier side of the national mean. Survey costs are not the only item that stacks up at acquisition, of course; how far brokerage fees and taxes erode a gross yield is broken down in Hotel Acquisition Costs 7.1%: A 6.5% Gross Yield Becomes 4.65% Net.
The FY2023 total of ¥64.4 billion is the highest in nine years. Over the longer run, however, the level has fallen sharply. The Agency’s own time series puts the peak of emergency excavation survey costs at ¥132.1 billion in FY1997, making FY2023 49% of that. Fewer large developments since the bubble era, and the now-established practice of triaging cases through test and confirmation surveys, both lie behind the decline. Meanwhile the private-sector share (measured on total emergency excavation cost including test and confirmation surveys, a different base from the 22.6% cited for full excavations alone) has drifted sideways from 23.3% in FY2019 to 23.9% in FY2023 — the public–private cost structure itself is stable.
Where hotel projects show up in the statistics — four categories, 11.3% of filings
The statistics classify filings by type of development. By count the two dominant categories are private homes at 24,913 (36.5%) and gas and similar utilities at 18,266 (26.7%), together 63% of the total — because gas, water and sewer works inside designated zones occur constantly.
There is no standalone “hotel” category in the statistics. In practice, the building itself is filed under other buildings; projects involving site preparation go under residential land development; mixed commercial schemes under retail; and resort projects under tourism development. Those four categories total 7,724 cases, or 11.3% of all filings.
| Development category | Filings | Share of total |
|---|---|---|
| Other buildings | 3,857 | 5.6% |
| Residential land development | 2,998 | 4.4% |
| Retail | 745 | 1.1% |
| Tourism development | 124 | 0.2% |
| Four categories combined | 7,724 | 11.3% |
Tourism development is small at 124 cases (0.2%), and the breakdown is dominated by Fukuoka’s 76 — one prefecture accounting for 60% of the national figure. That reflects differences in how municipalities assign categories, so the number cannot be read as “the number of resort projects in Japan.” The real volume of hotel development is better understood as dissolved into the 3,857 other-buildings and 2,998 residential-land-development cases.
Due diligence maths on cost and schedule — 2,000 sqm means about 9.7 months and over ¥50mn
The national statistics above describe an average picture, not an estimate for any individual project. To make them usable, we apply the survey unit costs and progress rates that municipalities publish.
■ Assumptions
- Unit cost and progress rate follow the guideline figures published by the City of Nagoya: ¥25,000–30,000 per sqm, 300 sqm per month, and at least one month of preparation before the survey starts (where the city itself conducts the survey; figures move with scale, site conditions and the state of the remains)
- Filing lead time is counted as 2.0 months, per the 60 days before the planned start date required by Article 93, paragraph 1 of the Act on Protection of Cultural Properties
- “Area” here is not the site area but the area affected by excavation, i.e. the area to be surveyed. It changes substantially with foundation type and whether there are basement levels
- Time to process finds and prepare the survey report is not included above (it is required separately)
- Unit costs and progress rates differ by municipality and by site, and cannot be transferred directly to other regions. Use this as a reference conversion for sizing a range
| Area to be surveyed | Survey cost | On-site survey period | Total lead time from filing to survey completion |
|---|---|---|---|
| 300 sqm | ¥7.5–9.0mn | 1.0 month | 4.0 months |
| 600 sqm | ¥15–18mn | 2.0 months | 5.0 months |
| 1,000 sqm | ¥25–30mn | 3.3 months | 6.3 months |
| 2,000 sqm | ¥50–60mn | 6.7 months | 9.7 months |
| 3,000 sqm | ¥75–90mn | 10.0 months | 13.0 months |
Working the ¥18.83mn national average back through those unit costs implies a surveyed area of roughly 630–750 sqm. The ¥20.10mn typical of large-enterprise cases implies about 670–800 sqm. Given the building footprint of a single hotel, the central case when a full excavation does land is on the order of 600–1,000 sqm and about six months of lead time — close enough to observed practice to be useful.
The cash impact of a six-month delay to opening
Schedule bites harder than cost. Taking a 100-room limited-service hotel, we estimate the guest-room GOP pushed into later years if opening slips by six months. ADR is MetroEngines Research’s estimated settled ADR for limited-service hotels in Tokyo, July 2026 actuals of ¥12,306 (N=913 properties, confirmed basis), rounded to ¥12,300. Occupancy and GOP margin are assumptions.
| OCC 70% | OCC 80% | OCC 90% | |
|---|---|---|---|
| GOP margin 30% | ¥47.1mn | ¥53.8mn | ¥60.6mn |
| GOP margin 40% | ¥62.8mn | ¥71.8mn | ¥80.8mn |
| GOP margin 50% | ¥78.5mn | ¥89.7mn | ¥101.0mn |
The central case (OCC 80%, GOP margin 40%) comes to ¥71.8mn. For reference, estimated occupancy in Tokyo (based on OTA listed inventory) stood at a high 92.8% as of June 2026 (N=1,336 properties), so an 80% assumption is conservative. GOP margins are often put at 50–60% for limited-service properties, while operating results disclosed by listed hotel REITs show levels closer to just under 40%; 40% is used here as the central case.
The ordering of the amounts is what matters. A full excavation of 2,000 sqm costs ¥50–60mn, while a six-month delay to opening shifts ¥71.8mn of GOP into later years. The schedule slip is bigger than the survey bill itself — and a delay also pulls forward interest during construction and payroll. In due diligence, treating this as a schedule risk rather than a cost line is closer to reality. How many months hotels actually take from groundbreaking to completion is measured across 67 planned projects in Hotel Build Times: 2.80-Year Median, 1.96 Solo vs 4.00 Mixed-Use; the survey period sits on top of that to give the real schedule.
Putting it to work — what can and cannot be settled before contract
STEP 1 Zone enquiries are free and same-day
Whether a candidate site falls inside a designated buried cultural property zone can be confirmed with the municipal cultural properties desk, and many local governments publish the zone boundaries as web map data. This is a step that can always be completed during first-pass site screening, at almost no cost or time. If the site is outside a zone, the issue closes there.
STEP 2 If it is inside, press through to the likely order
Even inside a zone, only 8.2% nationally proceed to an excavation survey. Construction attendance (41.6%) and careful construction (49.1%) carry no cost. But the order depends on excavation depth and foundation type. Bringing plan drawings to the pre-consultation stage and getting a read on the likely category is worth doing.
STEP 3 Carry a range into the deal terms
If a full excavation lands, the central case is 600–1,000 sqm, about six months and roughly ¥20mn. Whether the purchase agreement can carry a condition precedent tied to survey results, or a schedule-adjustment clause, is what decides how much risk actually transfers. Pricing in the money is not enough; the schedule has to be priced in too.
Buried cultural property is not like land price or floor-area ratio, where research settles the number. Because the scale is undetermined until the ground is opened, it behaves more like soil contamination or underground obstructions. That is precisely why the sensible order is to size the probability and the cost range from national statistics, then keep the screening stage to a binary in-zone / out-of-zone test and, on in-zone sites, absorb the exposure through schedule buffers and contract clauses.
Seen from the supply side, this process also acts as a real barrier to entry. Where the buried cultural property burden stacks on top of rising construction costs, new supply tends to be suppressed. How far construction costs alone are cutting into supply plans is tracked year by year in Construction +41% & Labor Crunch Erase Japan’s 2027-2029 Hotel Supply. For operators holding existing stock there is an upside — competition eases, and there are windows in which repositioning or acquiring existing assets becomes relatively more attractive.
Frequently asked questions
Summary
Pulling together what the Agency for Cultural Affairs’ FY2023 statistics show. First, civil works filings inside designated buried cultural property zones numbered 68,333 nationwide, and only 8.2% of them were ordered to conduct an excavation survey. Nine in ten proceed at no cost. Second, the impact when a project does land in that 8.2% is not small: 3,205 full excavation surveys cost ¥60.36 billion, averaging ¥18.83mn each and rising to ¥20.10mn where a large enterprise is the party causing the works.
Third, both the probability and the unit cost diverge widely by prefecture. Order rates run from 29.1% in Okinawa to 1.5% in Shizuoka, and among the 11 prefectures with the most hotel openings alone, cost per case ranges from ¥48.67mn in Hokkaido to ¥3.98mn in Fukuoka. Applying the national average to your own project means little; it has to be re-read for the municipality where the site sits. Fourth, schedule bites harder than cost. The roughly 9.7-month lead time at 2,000 sqm shifts an amount comparable to six months of guest-room GOP for a 100-room hotel into later years.
Adding one line — “check the designated zone” — to a site screening checklist costs essentially nothing. Skipping it and carrying on to contract, by contrast, can force a schedule rebuild that moves the whole development programme. Low-probability, high-impact items are exactly the ones worth clearing in the first 30 minutes.
Related reading
- Hotel Build Times: 2.80-Year Median, 1.96 Solo vs 4.00 Mixed-Use
- Hotel Acquisition Costs 7.1%: A 6.5% Gross Yield Becomes 4.65% Net
- Hotel Development Capacity 2026: Zoning, FAR & Land Price in 5 Markets
- Construction +41% & Labor Crunch Erase Japan’s 2027-2029 Hotel Supply
- Shiga Hotel Development: 1.5% New Supply, ¥11-16k Whitespace, 8.0% NOI
- Hakodate Station Land +10.3%, Goryokaku Flat: 226 Hotels, 11,449 Rooms
- Hotel Water & Sewer Costs Vary 2.1x by Municipality: ¥7.85mn NOI Gap
- Banquet Floors to Guestrooms: 20 Markets Clear the ¥9,600 ADR Line
- Matsumoto ADR ¥13,400 vs ¥18,300 Ceiling: Absorbing 222 New Rooms
References and sources
■ Primary statistics (the core data in this article)
- Agency for Cultural Affairs, “Statistical Data on Buried Cultural Properties — FY2024” (March 2025, Cultural Properties Division II) — Figure 7 trend in excavation filings, Table 8 civil works filings over time, Table 9 excavation survey filings over time, Table 10 cases by development type, Table 12 overview of excavation filings, Table 14 trend in emergency excavation survey cost, Table 15 emergency excavation survey cost over time, Table 16 summary of excavation survey costs, Table 17 full excavation survey cost by party causing the works
- Agency for Cultural Affairs, “Buried Cultural Properties” — approximately 460,000 designated buried cultural property zones, the filing system (Articles 92, 93, 94, 96 and 97), and the principle of cost borne by the party causing the works
■ Municipal practice and unit costs
- City of Nagoya, “Who bears the cost of surveying land that requires an excavation survey?” (Nagoya Oshiete Dial FAQ ID 1036, updated 22 March 2026) — cost ¥25,000–30,000 per sqm, pace 300 sqm per month, at least one month of preparation before starting
- City of Nagoya, “Handling of buried cultural properties” — the 60-day filing obligation; construction attendance and careful construction carry no cost
- City of Imizu, “Handling of buried cultural properties in civil engineering and construction work” — guideline of four months from planning to completion of the on-site survey for 500 sqm or less
■ Market data
- MetroEngines Research & Consulting — estimated settled ADR (Tokyo, limited-service hotels, July 2026, N=913 properties), estimated occupancy (Tokyo, June 2026, N=1,336 properties), new openings (2025, confirmed via OTA listings, N=1,741 properties)