

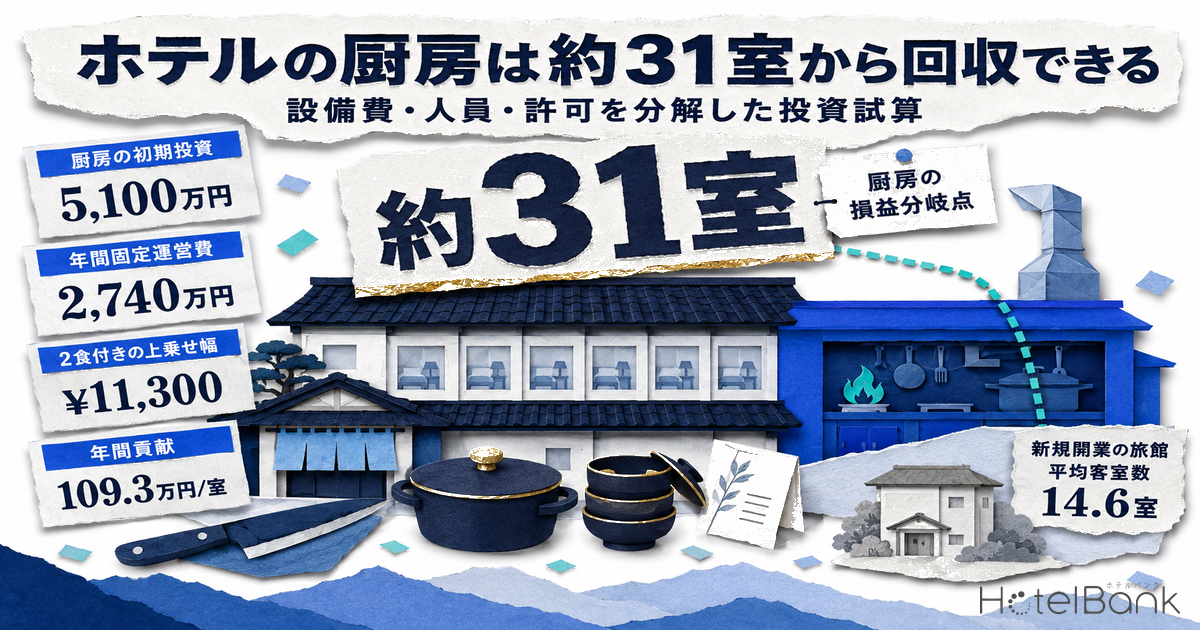
The biggest fork in a hotel or ryokan development plan is not room grade or location — it is whether the property serves its own meals. The moment you decide to have a kitchen, the building’s floor-area mix, capital expenditure, permits and hiring plan all change. This article breaks the kitchen function into four elements — (1) floor area and equipment cost, (2) the practical cost of permits and hygiene management, (3) cooking and serving staff and labor cost after the minimum-wage revision, and (4) the price premium a meal-inclusive plan can command — and estimates the break-even point: how many rooms a property needs before a kitchen pays for itself. The short answer: under conservative assumptions the break-even point is about 31 rooms. Yet ryokan (Japanese inns) that opened in 2026 average just 14.6 rooms, so actual new supply sits far below that threshold.
Metric Definitions Used in This Article
- ADR (Average Daily Rate): An estimated settled rate (tax-excluded equivalent), calculated by applying a segment-specific adjustment factor to the lowest publicly listed plan price at each property (per room, 2 guests, tax included). Cross-checked against property-level results disclosed by listed hotel REITs (91 properties, most recent 3 months), the median error is about 7%. These are estimates and differ from each property’s actual settled rates and accounting figures. Area-level ADR is the median across properties (the level of a typical property in the area).
- Meal premium (the core metric of this article): The difference in listed prices, taken only where the same property sells both a “room only” plan and a “breakfast included” or “half-board (breakfast + dinner)” plan (paired comparison). Per room, 2 guests, tax included. It is not a comparison of averages across different properties. Because it is a difference in listed prices, not in settled rates, the estimate below discounts it by a “realization rate” described later.
- OCC (Occupancy Rate): Share of sold rooms in total rooms in an area (an estimate based on OTA sales inventory). In this article it is used only as an assumption in the model.
- Data sources: MetroEngines Research & Consulting (prices and supply) / HotelBank Editorial Team research (NLP analysis of guest reviews)
- — About 31 rooms is the kitchen break-even point: fixed capex of ¥51.0M and an annual fixed operating cost of ¥27.4M, divided by a meal contribution of ¥998k per room per year.
- — Ryokan opened in 2026 average 14.6 rooms (46 properties, 670 rooms) — far below the 31-room break-even, so actual new supply collides head-on with standalone kitchen economics.
- — The revenue input is a median half-board premium of ¥11,300 (12 prefectures, same-property paired comparison, listed prices). Rather than using the listed difference as-is, it is discounted by a 70% realization rate.
- — The variable that moves the break-even point most is the realization rate: 21.0 rooms at 100%, 44.9 rooms at 50%. Raising fixed capex by 15% barely moves it (31.4 rooms).
- — 47.9% of new openings are vacation rentals (683 properties) with no commercial kitchen. A property under 31 rooms that keeps a kitchen should aim at review scores and direct, name-driven demand rather than standalone profitability.
What Supply Shows — About Half of New Openings Have No Kitchen
Before the investment question, it is worth checking which way the market is actually going. Within the coverage of MetroEngines Research & Consulting, 1,425 lodging properties were confirmed to have opened in 2026. By segment, vacation rentals account for 683 properties (47.9%), nearly half the total, followed by hostels at 109 (7.6%) and guesthouses at 75 (5.3%). None of these segments cook and serve meals from their own kitchen; at most they offer a self-catering kitchen for guests.
By contrast, ryokan — which assume two meals a day — account for only 50 properties (3.5%). Since 2023, the vacation-rental share has risen steadily from 36.3% → 42.3% → 42.9% → 47.9%, while the ryokan share has stayed flat at a low level: 4.0% → 3.9% → 3.4% → 3.5%.
Even more important is the size per property. Where room counts could be confirmed, the average size of 2026 openings differs by an order of magnitude across segments. Business hotels average 100.1 rooms (149 properties, 14,916 rooms) and resort hotels 92.6 rooms (64 properties, 5,924 rooms), whereas ryokan average 14.6 rooms (46 properties, 670 rooms), hostels 17.0 rooms (81 properties, 1,374 rooms), and vacation rentals just 1.6 rooms per building (658 properties, 1,047 rooms).
In other words, ryokan — the segment expected to operate kitchens — are among the smallest in scale. To test what this structure implies, we build up the numbers from the cost side.
1. Kitchen Capex — Floor Area, Specialist Works and Equipment per Room
The kitchen is the most expensive zone of a building per unit of floor area. The reason is simple: it stacks works that guest rooms do not need — waterproofed floors, a buried grease trap (grease interceptor), exhaust ducts running to the roof, fire compartmentation for a room using open flame, and concentrated water, drainage, gas and electrical runs. Fit-out and equipment works for restaurants in shell-condition premises typically cost ¥300,000–600,000 per tsubo (3.3㎡), and a rooftop exhaust duct alone runs ¥1–3M (Tenpo Naiso Mitsumori Hikaku.com). This comes on top of the structural cost.
On the structural side, the Ministry of Land, Infrastructure, Transport and Tourism (MLIT) Building Construction Statistics put 2025 lodging buildings at ¥2.026M per tsubo for reinforced concrete (RC) construction (≈ ¥613,000/㎡) and ¥2.405M per tsubo for steel (S) construction. For reference, a separate HotelBank analysis of 31 planned projects puts guest-room construction at about ¥20.67M per room at a unit floor area of 35.0㎡, which helps put the kitchen-zone unit cost below in context. Below, we assume RC construction and design the minimum kitchen needed to serve two meals (a 40㎡ kitchen zone).
| Item | Amount | Basis |
|---|---|---|
| Structure, floor waterproofing and fire compartment for kitchen zone (40㎡) | ¥24.5M | 40㎡ × ¥613k/㎡ (RC ¥2.026M/tsubo) |
| Kitchen building services (grease trap, water/drainage, gas, electrical, waterproof finish) | ¥6.0M | 12.1 tsubo × ¥500k/tsubo (upper band of the ¥300–600k/tsubo range; kitchens concentrate wet areas and exhaust) |
| Rooftop exhaust duct works | ¥2.5M | Upper band of the ¥1–3M range |
| Kitchen equipment set (refrigeration, cooking, ice maker, dishwasher, storage) | ¥18.0M | Standard configuration for two meals at 30–40 rooms |
| Fixed capex subtotal (required regardless of room count) | ¥51.0M | Same configuration covers up to ~40 rooms |
On top of this comes the portion that scales with room count: the dining hall. Allowing 2 seats per room at 1.0㎡ per seat (2.0㎡ per room), and costing it at ¥713k/㎡ (¥613k/㎡ structure plus ¥100k/㎡ interior), gives ¥1.43M per room.
This fixed-plus-variable structure creates large differences in per-room burden by size. Dividing the total by room count gives ¥4.83M per room at 15 rooms, ¥3.98M at 20 rooms, ¥3.08M at 31 rooms and ¥2.28M at 60 rooms. Kitchen-related investment per room differs 2.1x between 15 and 60 rooms. Kitchens are “heavy for small properties” not as a matter of intuition, but because of the denominator of fixed costs.
15 rooms
Total ¥72.45M / ¥4.83M per room
¥51.0M fixed capex spread over 15 rooms
31 rooms
Total ¥95.33M / ¥3.08M per room
The break-even size discussed below
60 rooms
Total ¥136.80M / ¥2.28M per room
Where dilution of fixed capex takes effect
2. Permits and HACCP — Fees Are Small; the Weight Sits in Facility Standards
Permits and hygiene management are often cited as barriers to serving food, but in money terms they are actually small. The application fee for a restaurant business permit is ¥18,300 in Tokyo and roughly ¥16,000–19,000 nationwide (Ota City / Tokyo Metropolitan Bureau of Public Health). HACCP became fully mandatory in June 2021, but small operators with fewer than 50 employees can comply voluntarily by following industry-association guidebooks, and public health centers offer free training, so there is almost no extra cost. Even going as far as (optional) certification costs about ¥150,000 for a small property, and planning for large operators is cited at ¥200,000–500,000 (ISO Certification Navi).
The point for investment decisions is that the cost sits in “facility standards,” not in “fees.” A permit requires physical conditions — washing facilities, dedicated hand-washing stations, a partitioned cooking area, proper ventilation and drainage — and these are already built into the capex in the previous section. Permits are therefore less a separate cost line than a procedure that confirms, after the fact, the cost of deciding to build a kitchen. At the feasibility stage, it is more effective to confirm early in design that the plan meets facility standards than to book permit costs as a separate line.
| Item | Amount | Nature |
|---|---|---|
| Restaurant business permit application fee | ¥18k | One-off; ¥16,000–19,000 nationwide |
| HACCP compliance (under 50 employees, guidebook-based) | Effectively ¥0 | Covered by guidebooks and free training |
| HACCP certification (optional, small property) | ¥150k/year | Only if required by business partners |
| Hygiene operations (records, pest control, grease-trap cleaning) | ¥600k/year | Recurring; included in annual fixed operating cost |
3. Staffing — Annual Labor Cost in the Era of a ¥1,177 Minimum Wage
The real cost of a kitchen is the labor cost that goes out every year after it is built. Based on the Central Minimum Wages Council’s recommendation, Japan’s FY2026 regional minimum wage averages ¥1,177 nationally on a weighted basis (+¥56 year on year). Across the 47 prefectures, recommended rates range from a high of ¥1,280 in Tokyo to a low of ¥1,085 in Miyazaki, with effective dates staggered from October 1 to December 2, 2026. The ¥56 increase is the second largest since the guideline system began in FY1978, and it hits serving and dishwashing labor — where the share of part-timers is high — directly.
We build up a standard staffing structure and annual labor cost for a 30-room property serving breakfast and dinner.
| Role | Headcount | Annual labor cost | Assumption |
|---|---|---|---|
| Head chef | 1 | ¥6.0M | Full-time; also handles menu design and purchasing |
| Cooks | 2 | ¥8.0M | Full-time, ¥4.0M × 2 |
| Prep and dishwashing | 1 | ¥2.12M | ¥1,177/hour × 6 hours × 300 days |
| Serving | 2 | ¥3.88M | ¥1,177/hour × 5 hours × 330 days × 2 |
| Statutory welfare costs (15%) | — | ¥3.0M | Employer share of social insurance, etc. |
| Labor cost subtotal | 6 | ¥23.0M | — |
Adding ¥3.0M for kitchen and dining-hall utilities (gas, electricity, hot water, exhaust), ¥600k for hygiene operations and ¥800k for replacing tableware, linen and consumables brings the annual fixed operating cost to ¥27.4M. Note that setting hourly wages at the minimum-wage level is an optimistic assumption, not a conservative one: actual advertised wages for kitchen assistants and servers usually exceed the minimum wage.
4. The Premium a Meal Plan Commands — Inputs from Listed Prices
Now for the revenue input. We use the difference in listed prices, limited to cases where the same property sells both a room-only plan and a meal-inclusive plan. Comparing average prices across different properties introduces selection bias (“properties that serve meals are pricier to begin with”), so the pure value added by meals can only be measured through a same-property paired comparison.
As of August 2026, across 12 major prefectures (2 guests per room, tax included), the half-board premium over room-only is largest in Kyoto at about ¥22,000 (+60.7%, N=49 properties), followed by Tokyo at about ¥16,800 (+43.2%, N=83) and Okinawa at about ¥14,100 (+24.2%, N=87). The smallest is Miyagi at about ¥7,200 (+35.6%, N=41), and the median across the 12 prefectures is about ¥11,300.
Note that yen amounts and percentages do not line up. Kyoto stands out on both, but Fukuoka is mid-table in yen (about ¥10,900) yet high in percentage terms (+44.5%). In areas with a low room-only base price, the same meal looks like a larger premium in percentage terms. What matters for recovering a kitchen investment is the yen amount, not the percentage, so the model below works in yen.
Geographic distribution of the half-board premium (circle size = premium amount)
Broken down by segment, the structure splits clearly even within the same prefecture. In Tokyo in August 2026, business hotels command a half-board premium of only about ¥7,200 (+35.3%, N=36 properties), versus about ¥20,300 (+49.0%, N=24) at city hotels and about ¥36,400 (+43.8%, N=16) at deluxe hotels. In Nagano, resort hotels command about ¥15,200 (N=40) versus about ¥6,000 (N=21) at business hotels. In Hokkaido, too, city hotels (about ¥16,000, N=28) and business hotels (about ¥7,300, N=43) differ by 2.2x.
| Prefecture / segment | Breakfast premium | Half-board premium | N (properties) |
|---|---|---|---|
| Tokyo — Deluxe hotels | ¥14,856 (+17.1%) | ¥36,421 (+43.8%) | 16 |
| Tokyo — City hotels | ¥7,224 (+17.3%) | ¥20,324 (+49.0%) | 24 |
| Tokyo — Business hotels | ¥2,806 (+13.7%) | ¥7,156 (+35.3%) | 36 |
| Hokkaido — City hotels | ¥5,819 (+18.7%) | ¥15,958 (+47.7%) | 28 |
| Hokkaido — Business hotels | ¥1,957 (+9.4%) | ¥7,253 (+34.4%) | 43 |
| Nagano — Resort hotels | ¥2,438 (+4.1%) | ¥15,192 (+25.2%) | 40 |
| Nagano — Business hotels | ¥1,002 (+5.2%) | ¥6,031 (+27.4%) | 21 |
| Shizuoka — City hotels | ¥4,229 (+12.8%) | ¥19,125 (+50.8%) | 16 |
| Shizuoka — Business hotels | ¥824 (+5.3%) | ¥4,154 (+26.4%) | 45 |
The small premiums in the business-hotel segment support the logic behind that segment’s consolidation into a lightweight, breakfast-only F&B function. If the price premium cannot justify going as far as dinner, it is consistent from an investment standpoint to keep the kitchen size and staffing to the minimum needed for breakfast. Breakfast and dinner premiums also vary widely by region and segment, so the prefecture median used here should be replaced with local, segment-specific figures for any individual project.
Don’t Book the Listed Price Gap as Revenue — the “Realization Rate” Discount
This is the part of the model that requires the most care. The ¥11,300 above is a difference in listed prices, not a difference in settled rates. Several factors keep the full listed gap from landing as revenue: the share of guests choosing room-only plans, last-minute switches to no-meal plans, no-meal nights during multi-night stays, and negotiated rates for group and corporate contracts. For reference, estimated settled ADR in Nagano in August 2026 (tax-excluded equivalent, median) was about ¥14,400 for ryokan (N=476 properties), about ¥19,400 for resort hotels (N=118) and about ¥12,200 for business hotels (N=161); the listed price gap is by no means small relative to these settled levels. It is hard to justify simply adding the gap. A related question is how far higher listed prices are absorbing rising costs — in particular, whether half-board ryokan have passed rising dinner food costs through to ADR — which deserves its own segment- and region-level analysis.
This article therefore converts the listed gap to a tax-excluded equivalent and multiplies it by a realization rate to arrive at revenue. The base case uses a 70% realization rate, and the sensitivity analysis tests both ends at 50% and 100%.
| Revenue build-up (per occupied room night) | Amount |
|---|---|
| Half-board premium (median of 12 prefectures, listed price, tax included) | ¥11,300 |
| Converted to tax-excluded equivalent | ¥10,273 |
| Applying 70% realization rate (base case) | ¥7,191 |
| Less 30% food cost ratio | ¥5,034 |
| Annual contribution at 70% occupancy (model assumption, full year) and 85% meal-plan share (217.2 room nights per year) | ¥1.093M per room |
Break-Even Estimate — A Kitchen Pays for Itself from About 31 Rooms
With all four elements in place, we can solve for the break-even point. The structure is simple: break-even is where the annual contribution, which scales with room count, exceeds the fixed burden incurred regardless of room count.
| Type | Item | Amount |
|---|---|---|
| Fixed (independent of room count) | Annual fixed operating cost (6 staff + utilities + hygiene + consumables) | ¥27.4M/year |
| Depreciation of ¥51.0M fixed capex (15-year straight line) | ¥3.4M/year | |
| Variable (proportional to room count) | Annual contribution from meal-inclusive sales | +¥1.093M per room |
| Depreciation of ¥1.43M/room dining-hall capex (15-year straight line) | −¥95k per room | |
| Break-even point | ¥30.8M ÷ ¥998k per room | 30.9 rooms |
The base-case break-even point is 30.9 rooms — about 31 rooms in practice. At 20 rooms the meal department loses ¥10.84M a year; at 40 rooms it turns to a ¥9.12M profit. The decision to have a kitchen flips sign at around 30 rooms.
The realization rate moves the result most. If the full listed gap is captured (100%), break-even falls to 21.0 rooms; if only half lands (50%), it rises to 44.9 rooms. Lowering occupancy from 70% to 60% gives 36.6 rooms; raising the food cost ratio from 30% to 35% gives 33.5 rooms; a 10% overrun in labor cost gives 33.2 rooms. Stacking pessimistic assumptions — 60% occupancy × 50% realization — gives 53.7 rooms, a size at which almost no newly opened ryokan could recover a kitchen of this level.
Interestingly, sensitivity to construction cost is relatively small. Raising fixed capex by 15% moves break-even only to 31.4 rooms, barely different from the base case. The center of gravity of a kitchen investment lies not in the cost of building it, but in the labor cost that goes out every year and in how much of the price premium actually lands. Even amid talk of soaring construction costs, whether a property can support a meal service depends mainly on labor cost and the realization rate.
| Realization \ Occupancy | 60% | 65% | 70% | 75% | 80% |
|---|---|---|---|---|---|
| Realization 50% | 53.7 rooms | 48.9 rooms | 44.9 rooms | 41.5 rooms | 38.6 rooms |
| Realization 60% | 43.5 rooms | 39.8 rooms | 36.6 rooms | 33.9 rooms | 31.6 rooms |
| Realization 70% | 36.6 rooms | 33.5 rooms | 30.9 rooms | 28.6 rooms | 26.7 rooms |
| Realization 85% | 29.5 rooms | 27.1 rooms | 25.0 rooms | 23.2 rooms | 21.7 rooms |
| Realization 100% | 24.8 rooms | 22.7 rooms | 21.0 rooms | 19.5 rooms | 18.2 rooms |
Viewed on two axes, the break-even point ranges from 18.2 to 53.7 rooms — roughly a 3x spread. Raising occupancy 20 points from 60% to 80% lowers break-even by only 9.9 rooms (36.6 → 26.7), whereas raising the realization rate from 50% to 100% lowers it by 28.9 rooms (53.7 → 24.8). What decides the success of a kitchen investment is not occupancy but what share of the listed gap actually lands as settled rate. The variable worth collecting real data on at the feasibility stage narrows down to this realization rate.
Two Investment Profiles — With a Kitchen vs. Without
We now line up the numbers for a half-board ryokan model and a vacation rental / hostel model (segments without in-house food service), using a common 30-room assumption.
| Dimension | Half-board ryokan (with kitchen) | Vacation rental / hostel (no kitchen) |
|---|---|---|
| Meal-related initial investment | ¥93.9M (¥3.13M per room) | Near zero (self-catering kitchens do not require a restaurant permit) |
| Annual fixed operating cost | ¥27.4M | Zero |
| Specialist staff required | Hiring and retaining a head chef and cooks is a prerequisite | None; cleaning and operations can be outsourced |
| Permits | Restaurant business permit + HACCP-based hygiene management | Lodging business permit only |
| Revenue upside | +¥5,034 gross contribution per occupied room night | Almost entirely rate and occupancy |
| Structure when demand falls | Labor cost stays fixed, amplifying the downside | Thin fixed costs, resilient in contraction |
| Viable scale | Roughly 31+ rooms (50+ under pessimistic assumptions) | Viable from 1–2 rooms per building |
| Average size of 2026 openings | Ryokan 14.6 rooms | Vacation rentals 1.6 rooms / hostels 17.0 rooms |
The 14.6-room average for ryokan opened in 2026 collides head-on with the 31-room break-even point. How should this gap be read? There are three possibilities. First, many small new ryokan are not offering full half-board but lighter formats — breakfast only, dinner through outside partners, or catered meals. Second, owners cook themselves, so labor cost is not externalized as in the model. Third, the kitchen sits outside the profit calculation, held as an investment in brand and guest experience. Whichever applies, one point is common: a design that builds a new full half-board kitchen at a small property and expects it to pay on a standalone basis is not being chosen under today’s cost structure.
The Other Asset a Kitchen Buys — Differentiation Through Meal Ratings
Measuring a kitchen’s value only by price premium, however, misses an important element. Looking at “meal” category scores from NLP analysis of guest reviews by segment, there is a stable gap between ryokan and business hotels. On a 24-month median basis, Nagano ryokan score 4.50 (328 properties, 35,715 reviews) versus 3.91 for business hotels (80 properties, 4,289 reviews); Kyoto ryokan 4.66 (97 properties, 7,534 reviews) versus 4.11 for business hotels (70 properties, 5,678 reviews); and Hyogo ryokan 4.62 (163 properties, 21,646 reviews) versus 4.08 for business hotels (71 properties, 5,053 reviews). Ryokan score higher in all seven prefectures, with gaps of 0.25–0.59 points.
At the tag level, the share of reviews mentioning kaiseki (multi-course) cuisine or in-room dining clearly varies by property; in Nagano, some properties see kaiseki cuisine mentioned in 5–6% of all reviews (N=589–1,158 reviews per property). Meals are an element guests readily write about as a memorable experience of a stay. Investment in a kitchen partly buys this “reason to be written about,” which is hard to capture in single-year gross profit.
Bringing this back to the model, a kitchen may be justified even without clearing the ~31-room break-even on a standalone basis, if knock-on effects on occupancy and rate via higher review scores are included. Put the other way, when deciding to operate a kitchen below 31 rooms, the coherent design is to set review scores and direct, name-driven demand — not price premium — as the explicit goal, and to track progress with those KPIs.
Summary — Four Questions That Decide the Call
Whether to operate a meal service can be decided by whether you can answer the following four questions.
1. Does the property exceed 31 rooms?
Are there enough rooms to absorb ¥51.0M fixed capex and a ¥27.4M annual fixed operating cost? Under pessimistic assumptions, 50+ rooms are needed.
2. What share of the listed gap lands?
21 rooms at a 100% realization rate, 45 rooms at 50%. Pin down the meal-plan mix and last-minute switching rate with real data.
3. Can you hire and retain culinary talent?
Break-even is more sensitive to labor cost than to construction cost. Hiring feasibility is a precondition.
4. Standalone profit, or winning ratings?
Below 31 rooms, the purpose is differentiation. Set review scores and direct demand — not price premium — as KPIs.
What 2026 new supply shows is that projects able to answer “yes” to all four questions have become a minority. The vacation-rental share rising from 36.3% to 47.9% in three years, and new ryokan averaging just 14.6 rooms, together show that the cost structure of kitchens is rewriting the choice of segment itself. The decision to have a kitchen is no longer an equipment question; it has become a business-design question of whether scale, talent and price realization can be designed as a set.
⚠ Note on new-opening data: Opening counts and room counts in this article are aggregated from confirmed OTA listings. Because listings appear several months before opening, figures for recent and future months may rise as more listings appear. Later months of the year carry a structural downward bias; segment shares are relatively stable, but totals are likely to be revised upward.
⚠ Note on listed prices: The premiums in this article are differences in publicly listed selling prices at the time of the survey and change as the check-in date approaches. The model is a simplified estimate based on this article’s assumptions; actual investment decisions require a detailed feasibility study reflecting project-specific design conditions, labor cost levels and demand outlook.
Related Reading
- Oita Meal Premiums: Business Breakfast +10.6%, Half-Board +39.3%
- In-Room Dining Ryokan TOP 30: 58.3% Still Offer It, ADR +91%
- Japan 2026: 1,242 Openings, 33,749 Rooms — 47% Villas, 42% Business
- Is the Hotel Breakfast Premium Justified? Verifying with OTA Price Data
- Vacation Rentals Take 45% of Japan’s 2026 New Hotel Openings (247 Villas)
- Construction +41% & Labor Crunch Erase Japan’s 2027-2029 Hotel Supply
References and Sources
■ Data Sources
Supply data (opening counts, segment mix, room counts) are aggregated by MetroEngines Research & Consulting from confirmed OTA listings (2026 N=1,425 properties; room counts available for N=1,375 properties / 35,369 rooms). Meal premiums are a paired comparison limited to properties selling both room-only and meal-inclusive plans (August 2026, 2 guests per room, tax included, 12 prefectures, N=41–468 properties). Review scores are HotelBank Editorial Team research (NLP analysis of guest reviews, most recent 24 months, N=14–328 properties). Construction unit costs are from MLIT Building Construction Statistics; wages are based on the Ministry of Health, Labour and Welfare FY2026 regional minimum wage recommendation.
■ Model Assumptions
Kitchen zone 40㎡ at RC ¥613k/㎡, kitchen building services 12.1 tsubo, rooftop exhaust duct ¥2.5M and kitchen equipment set ¥18.0M, for fixed capex of ¥51.0M. Dining hall 2.0㎡ per room at ¥713k/㎡, or ¥1.43M per room. All depreciation is 15-year straight line. Annual fixed operating cost ¥27.4M (6 staff ¥23.0M + utilities ¥3.0M + hygiene operations ¥600k + consumables ¥800k). On the revenue side, the ¥11,300 premium is converted to a tax-excluded ¥10,273, then a 70% realization rate, 30% food cost ratio, 70% occupancy and 85% meal-plan share (217.2 room nights per year; occupancy is a full-year model assumption) are applied. Sensitivity analysis covers realization rates of 50–100% and occupancy of 60–80%.
■ Limitations
(1) Premiums are differences in listed prices, not in settled prices. The realization rate is an assumed value to absorb this gap and has not been validated against actual settled data. (2) Opening counts are based on confirmed OTA listings; because listings appear several months before opening, the most recent months are undercounted. (3) Capex and labor costs are representative national market levels and do not reflect variation by location, construction method or hiring conditions. (4) This is a simplified estimate based on stated assumptions; actual investment decisions require a detailed feasibility study reflecting project-specific design conditions, labor cost levels and demand outlook.
■ Market Data
- MetroEngines Research & Consulting — Listed prices by meal plan via same-property paired comparison (August 2026, 12 prefectures, N=41–468 properties), estimated settled ADR, and opening counts and room counts by segment (based on confirmed OTA listings, 2026 N=1,425 properties)
- HotelBank Editorial Team research (NLP analysis of guest reviews) — Median “meal” category scores (most recent 24 months, by prefecture and segment, N=14–328 properties)
■ Government Statistics and Public Data
- MLIT “Building Construction Statistics” (建築着工統計調査) — Unit cost per tsubo for lodging buildings by structure (2025: RC ¥2.026M / S ¥2.405M)
- Ministry of Health, Labour and Welfare “National List of Regional Minimum Wages” (地域別最低賃金の全国一覧) — FY2026 recommendation: national weighted average ¥1,177 (+¥56), effective October 1 – December 2, 2026
- Tokyo Metropolitan Bureau of Public Health “Food Hygiene Window”: Overview of business permits and notifications
- Ota City “Starting a New Food-Related Business” — Restaurant business permit fee ¥18,300
■ Industry Information and Market Rates
- archi-book “Construction Cost per Tsubo Data, 2025 Edition”
- Tenpo Naiso Mitsumori Hikaku.com “Market Rates for Restaurant Kitchen Works”
- IDEAL “Cost of Restaurant Exhaust Duct Works”
- ISO Certification Navi “Market Rates for HACCP Implementation and Certification”
- Relo Hotel Solutions “GOP Ratio Benchmarks by Hotel Type”