

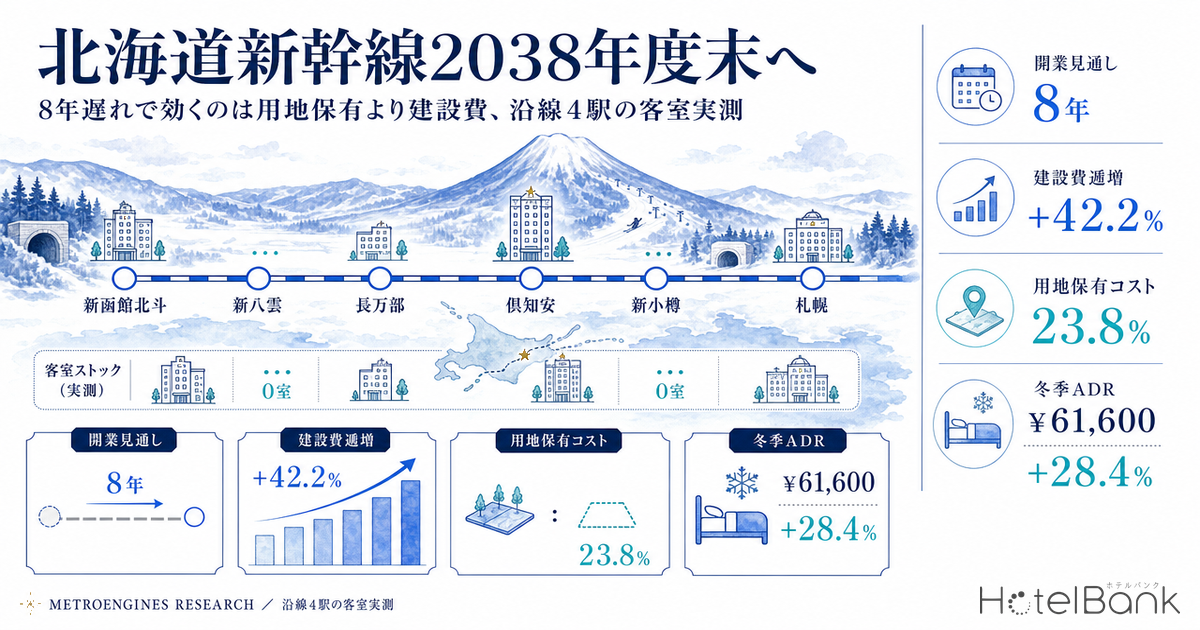
When the opening date of a Shinkansen extension moves, the first thing that changes for lodging investment along the corridor is not the quality of the location but the time axis. The Japan Railway Construction, Transport and Technology Agency (JRTT) had been targeting the end of FY2030 for completion and opening of the Shin-Hakodate-Hokuto–Sapporo section of the Hokkaido Shinkansen. Following deliberations by an expert panel convened by the Ministry of Land, Infrastructure, Transport and Tourism (MLIT), that outlook has been revised to “around the end of FY2038.” The gap is roughly eight years. This article quantifies what that eight-year shift actually does to hotel investment along the line, using measured room stock, settled-ADR estimates, catchment data, land prices and construction costs for the planned new station sites (Shin-Yakumo, Oshamambe, Kutchan, Shin-Otaru) and for Shin-Hakodate-Hokuto, which is already open.
The angle here does not overlap with our earlier work. Niseko’s Top Tier: Just 2 Hotels, 75 Rooms covered supply structure, and Chitose & Tomakomai Worker Lodging covered business demand in central Hokkaido. What this article asks is a different question — how a change in the opening date works on the investment time axis — and the scope is narrowed to the new station sites in the Shiribeshi and Oshima regions. The closest companion piece in spirit is Naniwasuji & Haneda Access Lines 2031: Hotel Investment Timelines.
Metric Definitions Used in This Article
- ADR (average daily rate) = a settled-rate estimate (tax-exclusive equivalent) derived by applying category-specific adjustment factors to each property’s lowest published plan rate on OTAs (double occupancy, per-room, tax-inclusive). Cross-checked against property-level disclosures from listed hotel REITs (91 properties, most recent three months), the median error is approximately 7%. These are estimates and differ from each property’s actual transacted rates and accounting figures. Area-level ADR is the median of the properties covered (the level of a typical property in that area).
- Published price = the average published selling price across all plans (double occupancy, per-room, tax-inclusive). Because the basis differs from the settled-ADR estimate, the two are always distinguished in this article.
- Room stock = the total rooms at properties with at least one room registered in the property master, within a 3km radius of each station or planned station site.
- Data source: MetroEngines Research & Consulting
- — The opening outlook has slipped eight years, from a target of end-FY2030 to around the end of FY2038. This is not a fixed date; JRTT explicitly notes the possibility of “a further delay of several years.”
- — Land is not the main driver of delay costs. Holding 2,000m² in Kutchan for eight years costs ¥44.98m, against +¥1.37bn in construction cost escalation over the same eight years (assuming +4.5% per year) — roughly 30 times more.
- — Both the Shin-Yakumo and Shin-Otaru sites have zero rooms within a 1.5km radius. They sit 3.0km and 4.0km outside the existing town centres, meaning the station district has to be built from nothing.
- — Kutchan is not waiting for the Shinkansen. Its settled-ADR estimate for January 2026 was ¥61,574 (+28.4% YoY), against ¥17,468 in July — a 3.5x spread.
- — A decade-old precedent: the 3km radius around Shin-Hakodate-Hokuto Station built up to 9 properties and 448 rooms, yet Hokuto City’s settled-ADR estimate runs 28.3% below Hakodate City’s.
What Exactly Slipped by Eight Years — Reading the Primary Sources as Written
Start with the facts as JRTT states them. The Shin-Hakodate-Hokuto–Sapporo section runs approximately 212km, of which roughly 169.0km (about 80%) is tunnel. Construction was authorised in June 2012, and a government–ruling party agreement in January 2015 moved the target forward by five years, to completion by the end of FY2030.
JRTT subsequently reported to the Minister of Land, Infrastructure, Transport and Tourism in May 2024 that “completion and opening by the end of FY2030 has been judged extremely difficult, owing to worse-than-anticipated ground conditions and the emergence of massive rock masses.” After deliberation by MLIT’s expert panel, findings published in March 2025 stated that “assuming risks with a high probability of materialising, completion and opening is currently expected around the end of FY2038,” that “should further risks with a large impact on the schedule materialise, an additional delay of several years is possible,” and that “because considerable uncertainty remains in the present outlook, it would be appropriate to review the overall schedule and set an opening date once tunnel breakthrough is reasonably in sight.”
For investment purposes this matters twice over. First, the end of FY2038 is not a confirmed opening date but an “approximately, around” expectation. Second, JRTT itself has put in writing that “a further delay of several years is possible.” What belongs in a business plan, then, is not a single opening year but a range centred on the end of FY2038. Work continues to advance section by section: the Shiribeshi Tunnel (17,975m) broke through in June 2026, and excavation of the Yotei Tunnel (Hirafu) and adjoining sections (5,569m) was completed in August 2026. The three major tunnels — Oshima (approx. 32.7km), Yotei (approx. 9.7km) and Sasshō (approx. 26.2km) — remain the focus of schedule management.
There are six stations: Shin-Hakodate-Hokuto, Shin-Yakumo (provisional name), Oshamambe, Kutchan, Shin-Otaru (provisional name) and Sapporo. Shin-Hakodate-Hokuto opened back in March 2016 and, as discussed below, serves as a live case study of what a Shinkansen station district looks like ten years on.
Zero Rooms Within 1.5km of the New Station Sites — Two Stations With No “Station District” Yet
We counted room stock along the corridor on a consistent basis: a 3km radius around each station and each planned site. The results diverge sharply. Within 3km of Otaru Station there are 110 properties and 2,516 rooms, and within 3km of Kutchan Station 33 properties and 774 rooms. Within 3km of Oshamambe Station there are just 11 properties and 107 rooms (the largest has 16), and within 3km of Yakumo Station 10 properties and 165 rooms (the largest has 36).
More important still, Shin-Yakumo (provisional) and Shin-Otaru (provisional) will both be built away from the existing town centres. Shin-Yakumo Station is planned for the Kasuga district of Yakumo Town, about 3.0km in a straight line from the existing Yakumo Station. Shin-Otaru Station will sit in the Tenjin district of Otaru City, about 4.0km from Otaru Station. Counted within a 1.5km radius of either site, the room count is zero. Even widening to 3km yields only 10 properties and 91 rooms around the Shin-Otaru site, and 2 properties and 16 rooms around the Shin-Yakumo site.
In other words, for these two stations the stock that would form the baseline for any discussion of “the competitive set around the station” does not currently exist. From a development standpoint that is a blank slate — and equally, it means that station-district functions including food and beverage, retail and last-mile transport all have to be built from zero. That the opening has moved eight years back means the starting gun for that build-up has moved eight years back as well.
| Station / planned site | Properties | Rooms | Resident pop. 2025 | 2040 change (vs. 2020) | Working-age share | Establishments | Employees |
|---|---|---|---|---|---|---|---|
| Otaru Station (existing) | 110 | 2516 | 20,966 | -33.6% | 52.3% | 1,623 | 11,298 |
| Shin-Otaru (provisional) planned site | 10 | 91 | — | — | — | — | — |
| Kutchan Station (co-located new station) | 33 | 774 | 11,197 | -14.2% | 62.2% | 496 | 3,488 |
| Oshamambe Station (co-located new station) | 11 | 107 | 3,091 | -36.5% | 50.7% | 191* | 987* |
| Yakumo Station (existing) | 10 | 165 | 8,741 | -26.7% | 58.0% | 345 | 1,825 |
| Shin-Yakumo (provisional) planned site | 2 | 16 | — | — | — | — | — |
| Shin-Hakodate-Hokuto Station (opened 2016) | 9 | 448 | 1,139 | -28.1% | 52.1% | 49* | 508* |
Seen from the population side, the corridor shrinks uniformly. Resident population within a 1.5km radius is projected to move from 11,197 in 2025 to 9,941 in 2040 at Kutchan Station, from 8,741 to 6,835 at Yakumo Station, from 20,966 to 15,277 at Otaru Station, and from 3,091 to 2,138 at Oshamambe Station. National Land Numerical Information’s change rates are measured against 2020 actuals, and on that basis read -14.2% for Kutchan, -26.7% for Yakumo, -33.6% for Otaru and -36.5% for Oshamambe. The smallest decline is Kutchan, which is also the only point on the corridor where the working-age share exceeds 60%, at 62.2%. The Oshamambe catchment runs 50.7% working-age and 42.4% elderly — a thin labour base around the station.
On the employment side, the 1km radius around Otaru Station stands out with 1,623 establishments and 11,298 employees, of which office-type employment is 10.5%. Kutchan Station’s 1km radius has 496 establishments and 3,488 employees with an office-type share of 9.0%, weighted toward tourism-linked lodging, food service and retail. Neither is a catchment where business travel forms the backbone of station-front demand; weekday demand rests on construction, public sector and local employers.
Six Stations, Mapped — The Two New Stations Sit 3–4km Outside the Town Centres
| Shin-Otaru (provisional) ←→ Otaru Station | approx. 4.0km |
| Shin-Yakumo (provisional) ←→ Yakumo Station | approx. 3.0km |
| Kutchan Station (Shinkansen station co-located) | same site |
| Oshamambe Station (Shinkansen station co-located) | same site |
Because Kutchan and Oshamambe will have their Shinkansen platforms co-located with the existing conventional-line stations, their current station-front stock becomes the initial supply on opening day. Shin-Otaru and Shin-Yakumo, by contrast, will form a station district essentially from scratch. That distinction bears directly on how the eight years can be used. The former can keep trading while they wait; the latter are more likely to face a stretch in which they are simply holding land.
Kutchan Is Not Waiting for the Shinkansen — ¥61,600 in Winter vs. ¥17,500 in Summer
The corridor’s rate structure splits into markets waiting on the opening and markets where pricing already stands regardless of it. Kutchan Town’s settled-ADR estimate was ¥61,574 in January 2026 and ¥63,522 in February, up 28.4% and 19.1% year on year respectively. The same town’s July 2026 figure was ¥17,468 (-1.7% YoY), a 3.5x gap against winter. That winter rate is created by ski demand and is independent of when the Shinkansen opens.
Otaru City has a different shape. At ¥17,942 in January 2026 (+25.0% YoY) and ¥19,127 in July (+9.4% YoY), winter and summer sit at similar levels — the mark of year-round tourism depth. Yakumo Town came in at ¥7,553 in July (-0.6% YoY) and Hakodate City at ¥9,644 (-8.2% YoY), neither showing meaningful growth. Oshamambe Town has only one listed property, and no observations sufficient to compute a settled-ADR estimate. That level should be read as an effective absence of room stock in the town rather than treated as an average.
This asymmetry changes how each area should read the delay. Kutchan already has an earnings base that turns year-round, which places the Shinkansen in the category of upside rather than necessity. If the opening moves eight years back, operating cash flow does not stop. In Oshamambe and Yakumo, by contrast, the station itself is the primary trigger for lodging demand — so moving it eight years back moves the demand ramp eight years back with it.
In Yakumo Town, a 30-room lodging property opened in 2025. Its format targets long-stay and worker demand, which reads as a design aimed at construction demand — including the Shinkansen works — plus local business demand. Even in a section whose opening has receded, the construction itself represents demand lasting years to more than a decade, and that should not be overlooked.
Shin-Hakodate-Hokuto: A Ten-Year-Old Precedent — 448 Rooms, Rates 28% Below the City Centre
There is no need to speculate about what a new station district becomes. Shin-Hakodate-Hokuto Station, opened on the same line in March 2016, offers ten years of evidence.
Within a 3km radius of that station there are 9 properties and 448 rooms. As a build-up from zero it counts as a success — but the top two properties account for 355 rooms (79%), and limited-service national chains dominate the supply. The surrounding resident population is 1,139 within a 1.5km radius, and the employment base is thin at 49 establishments and 508 employees (employment data coverage is sparse in this district and may understate actual conditions). A station was born; a substantial urban catchment around it was not.
Rates tell the same story. Hokuto City’s settled-ADR estimate averaged ¥6,223 over the most recent 12 months (August 2025–July 2026), 28.3% below Hakodate City’s ¥8,680. The presence of a Shinkansen station has not by itself produced rates above the city centre. Coverage for Hokuto City is thin at 4–6 properties per month, so the figure should be read for direction rather than level — but it is grounds for caution toward any business plan built on the premise that a Shinkansen station makes station-front rates jump.
Shin-Otaru (provisional) sits about 4.0km from Otaru Station and Shin-Yakumo (provisional) about 3.0km from Yakumo Station. In terms of distance from the existing town centre, the structure closely resembles Shin-Hakodate-Hokuto, which makes it a valuable recent analogue for estimating what happens after opening. On the general question of how far rates decay with distance from a station, Station Premium Ends at an 8-Minute Walk measures the distance-decay curve across eight major stations.
Putting a Number on Eight Years — Construction Cost Beats Land Holding by About 30x
What happens to a party that has secured land ahead of an opening that then moves eight years back? The question breaks into three parts: the cost of holding the land, the escalation of construction cost, and the erosion of present value from a later start to cash inflow. Take them in order.
1. Land holding cost — 23.8% of the acquisition price
For a 2,000m² site acquired and held, annual cost is modelled as fixed asset tax (assessed base set at 70% of the published land price, rate 1.4%) plus borrowing interest (2.0%, assuming the full acquisition price is debt-funded). That comes to 2.98% of the acquisition price per year, reaching 23.8% over eight years. The ratio is constant regardless of land price level; what differs is the denominator — the acquisition price — and how land prices move over the eight years.
| Area | Published land price (¥/m²) | YoY | Acquisition price | Annual holding cost | 8-year total | Land value change if recent rate persists 8 years | Net |
|---|---|---|---|---|---|---|---|
| Around Kutchan Station | 94,333 | +12.94% | ¥188.67m | ¥5.62m | ¥44.98m | +¥310.77m | +¥265.79m |
| Otaru City average | 41,775 | +1.23% | ¥83.55m | ¥2.49m | ¥19.92m | +¥8.58m | -¥11.33m |
| Yakumo Town average | 17,133 | -1.56% | ¥34.27m | ¥1.02m | ¥8.17m | -¥4.05m | -¥12.22m |
| Oshamambe Town average | 8,500 | -0.95% | ¥17.00m | ¥0.51m | ¥4.05m | -¥1.25m | -¥5.30m |
The corridor’s asymmetry shows clearly here. Around Kutchan Station, the 2026 published price of ¥94,333/m² (+12.94% YoY) continues to rise, and if the recent rate held for eight years the land value gain would far exceed the holding cost. Yakumo Town (¥17,133/m², -1.56%) and Oshamambe Town (¥8,500/m², -0.95%), by contrast, are in a declining phase where holding cost and asset value erosion pull the same way. Otaru City (¥41,775/m², +1.23%) sits in between, with the gain falling short of covering the holding cost.
The absolute amounts, however, are small. Even Kutchan comes to ¥44.98m over eight years, and Oshamambe to ¥4.05m. This is the point most easily missed in this analysis: land holding is not the main driver of delay cost.
2. Construction cost escalation — +42.2% over eight years, or ¥1.37bn
Dividing planned construction spend by floor area for lodging-use buildings in Hokkaido, from e-Stat’s Building Construction Starts Statistics, gives a unit cost that rose 2.34x, from ¥286,900/m² in 2018 to ¥671,100/m² in 2024. That annualises to 15.2%, but with only 40–207 buildings per year the unit cost swings on the presence or absence of large projects, and that caveat matters. Indeed, some years came in below the prior year, such as 2015 (¥208,200) and 2017 (¥260,600).
On the related question of how far a later construction start moves the conditions under which a project pencils, Policy Rate 1.00%: Break-Even ADR Across Japan’s 8 Hotel Markets works the break-even ADR backwards for eight major markets. For a forward escalation rate, rather than extrapolating those volatile actuals, it is more realistic to use the range published by construction consultancies for domestic construction cost forecasts — roughly +4.5% to +5% per year. Here we take +4.5% per year as the base case, with +3% and +6% as sensitivities.
The modelled asset is a 100-room hotel at 30m² per room with a 62% guestroom ratio, giving 4,839m² of gross floor area. At the 2024 actual unit cost of ¥671,100/m², project cost comes to ¥3.25bn. Built eight years later at +4.5% per year, the multiple is 1.4221x, or ¥4.62bn — a difference of ¥1.37bn. At +3% per year the gap is ¥0.87bn; at +6% per year, ¥1.93bn.
Against ¥44.98m of land holding cost over eight years in Kutchan, the ¥1.37bn construction cost difference is roughly 30 times larger. The conclusion is that the impact of the construction start itself moving back is an order of magnitude greater than fixed asset tax and interest on the land. Put the other way: in a delay scenario, what needs protecting is not the land but the design and procurement question of how to lock in the construction cost level at the point of starting work.
| Annual escalation | Multiple after 8 years | Project cost after 8 years | Difference | Increase per room | Ratio to 8-year land holding |
|---|---|---|---|---|---|
| +3.0% per year | 1.267x | ¥4.11bn | +¥0.87bn | +¥8.66m | 19.3x |
| +4.5% per year (base case) | 1.422x | ¥4.62bn | +¥1.37bn | +¥13.71m | 30.5x |
| +6.0% per year | 1.594x | ¥5.18bn | +¥1.93bn | +¥19.28m | 42.9x |
| Annual escalation \ years of delay | 4 years (end FY2034) | 6 years (end FY2036) | 8 years (end FY2038) | 10 years (end FY2040) | 12 years (end FY2042) |
|---|---|---|---|---|---|
| +3.0% per year | +¥0.41bn | +¥0.63bn | +¥0.87bn | +¥1.12bn | +¥1.38bn |
| +4.5% per year (base case) | +¥0.63bn | +¥0.98bn | +¥1.37bn | +¥1.80bn | +¥2.26bn |
| +6.0% per year | +¥0.85bn | +¥1.36bn | +¥1.93bn | +¥2.57bn | +¥3.29bn |
Viewed as a range rather than a single eight years, the increase in project cost spans +¥0.41bn to +¥3.29bn. Even holding escalation at +4.5% per year, a four-year delay costs +¥0.63bn and a twelve-year delay +¥2.26bn — a 3.6x spread. Misreading the start date by four years hits the number harder than misreading the escalation rate by 1.5 points. What belongs in a business plan is not a point estimate of the opening year but a view on where in this two-axis grid your own project sits.
3. The present value of an eight-year later opening — a 32.3% haircut at a 5% discount rate
The third element is the timing of cash inflow itself. An asset that opens at the end of FY2030 and reaches stabilised operation differs from one that reaches the same state at the end of FY2038 by eight years of receipt timing. At a 5% discount rate, value eight years out is 0.677x — a 32.3% haircut. At 4% it is 0.731x; at 6%, 0.627x.
It is worth being clear that this is deferral, not loss. The project has not disappeared; the same earnings are simply received later. How the capital tied up in the meantime is treated, however, varies enormously by sponsor. Eight years means something different to a landowner who can hold the site with equity than to a developer whose plan carries debt with interest costs priced in over the development period. The former can more easily choose to wait; for the latter, interim or provisional use of the site becomes the practical focus.
The Pipeline Is Not Pointed at the Corridor — Where 7 Projects and 1,582 Rooms Are Going
Now the supply side. Planned hotels in Hokkaido identifiable from building confirmation applications (50 rooms or more) number 7 projects totalling 1,582 rooms. By location, 5 projects and 882 rooms (55.8% on a room basis) are concentrated in Sapporo City, with the remainder split between 200 rooms in Furano City and 500 rooms in the Hanazono area of Kutchan Town. Not a single project is on file within walking distance of the Shin-Yakumo, Oshamambe or Shin-Otaru sites.
| Location | Planned rooms | Completion | Principal developer | Relationship to the Shinkansen |
|---|---|---|---|---|
| Hanazono, Kutchan Town | 500 | December 2025 | Schoening Investment (シェニングインベストメント) | Independent (ski demand) |
| Kita 1-jo Nishi 5, Chuo-ku, Sapporo | 216 | December 2026 | NTT Urban Development (NTT都市開発) | Independent (central Sapporo) |
| Minami 7-jo Nishi 5, Chuo-ku, Sapporo | 200 | May 2028 | Marubeni Urban Development (丸紅都市開発) and others | Independent (central Sapporo) |
| Shimogoryo, Furano City | 200 | December 2027 | Route Inn Japan (ルートインジャパン) | Independent (Furano tourism) |
| Kita 3-jo Nishi 3, Chuo-ku, Sapporo | 172 | December 2025 | Hulic (ヒューリック) | Independent (central Sapporo) |
| Kita 6-jo Nishi 6, Kita-ku, Sapporo | 168 | April 2027 | APA Home / APA Mansion (アパホーム/アパマンション) | Independent (central Sapporo) |
| Minami 7-jo Nishi 4, Chuo-ku, Sapporo | 126 | February 2027 | Tokyu Land Corporation (東急不動産) | Independent (central Sapporo) |
The pattern reads straightforwardly. Central Sapporo has autonomous demand regardless of when the Shinkansen opens, and development proceeds there. The 500 rooms in Kutchan’s Hanazono area target ski demand on the Niseko Hirafu side and are likewise not waiting on the Shinkansen. The same holds for Furano. In short, every project that has progressed to confirmation application is one that works without the Shinkansen — and station-front development at the new station sites is most naturally read as waiting for the opening date to firm up.
There is a constructive implication in this too. That the new station sites have almost no existing supply and an empty planning pipeline also means the room to enter remains intact for whenever the opening date is fixed. Oshamambe in particular sits midway between Shin-Hakodate-Hokuto and Sapporo, and is a junction of the Hakodate Main Line and the Muroran Main Line. Yakumo Town, too, has already seen long-stay and worker-oriented supply begin to move. The time axis has shifted back, but the seats are still open.
The Catchment Around Kutchan Station — 11,197 People Within 1.5km, 62.2% Working-Age
Kutchan is the one point on the corridor where demand and rates stand without waiting for the Shinkansen, so it is worth viewing its station catchment on a 250m mesh. Resident population within a 1.5km radius was 11,197 in 2025, projected at 9,941 in 2040 (-14.2% vs. 2020). The age mix is 62.2% working-age and 25.4% elderly, a markedly higher share of workers than elsewhere on the corridor. That is the flip side of a concentration of businesses around the station: 496 establishments and 3,488 employees are identifiable within a 1km radius.
For lodging demand, the key point is that this resident population is not the same as the population present. The Kutchan–Niseko area draws visitors from Japan and abroad in winter, generating a presence many times the resident base. The settled-ADR estimate climbing to ¥61,574 in January reflects that demand exceeding the 774-room stock within 3km of the station. In July it falls back to ¥17,468. Levelling occupancy across the year remains a substantial open theme in this market.
The significance of co-locating the Shinkansen at Kutchan Station may be felt precisely in that summer–winter gap, because it would change last-mile access from the Sapporo and southern Hokkaido directions, against a current demand structure dominated by access from New Chitose Airport. That, however, is a story for around the end of FY2038; for the twelve years until then, the market runs on the demand structure it has now.
Framing the Investment Decision — “Eight Years” Means Three Different Things
A Kutchan / Niseko area
An earnings base independent of the Shinkansen
Winter settled-ADR estimate of ¥61,574 (January 2026, +28.4% YoY). Land prices up 12.94% in the 2026 published series. Existing operations and asset value keep working through the eight-year wait. The focus is not waiting for the opening but closing the 3.5x gap against ¥17,468 in summer.
B Oshamambe / Yakumo
The Shinkansen is the primary trigger, and the seats are open
11 properties and 107 rooms within 3km of Oshamambe Station (largest 16 rooms); 10 properties and 165 rooms within 3km of Yakumo Station; zero rooms within 1.5km of the Shin-Yakumo site. Land prices are declining (-0.95% / -1.56%), so there is little appeal in holding, but the room to enter is preserved until the opening date firms up. Construction and worker demand carry the market in the meantime.
C Otaru / Shin-Otaru
A two-layer structure with 4km between the town centre and the new station
110 properties and 2,516 rooms within 3km of Otaru Station, against zero rooms within 1.5km of the Shin-Otaru site. Existing tourism demand (settled-ADR estimate of ¥19,127 in July 2026, +9.4% YoY) turns regardless of where the station sits. The new station district looks likely to follow the Shin-Hakodate-Hokuto pattern of building up from zero.
Practical risk factors
| Category | Description | Implication for investment decisions |
|---|---|---|
| Opening date | “Expected around the end of FY2038” is not a fixed date. JRTT itself notes the possibility of “a further delay of several years” | Plan for a range, not a single year. Tunnel breakthrough progress is the trigger for updating it |
| Construction cost | +42.2% over eight years (assuming +4.5% per year). Sensitivity spans +¥0.87bn to +¥1.93bn | The main driver of delay cost. Locking design and procurement early is the practical issue |
| Land holding | 23.8% of the acquisition price (8 years, property tax plus 2.0% interest). Outside Kutchan, falling land prices compound it | Absolute amounts are small. The meaning changes depending on equity versus debt funding |
| Demand ramp | In the Shin-Hakodate-Hokuto case, ten years after opening the 3km radius holds 448 rooms and rates sit 28.3% below the city centre | Do not assume that a station equals a high rate |
| Catchment contraction | Projected 2040 population within 1.5km is -14.2% to -36.5% versus 2020 across the stations | Design for through and visitor demand rather than in-area demand |
In sum, the eight-year delay does not land evenly along the corridor. In a market like Kutchan, with an earnings base independent of the Shinkansen and rising land prices, the waiting period can function as a period of asset formation. In markets like Oshamambe and Yakumo, where the Shinkansen is the primary trigger, the demand ramp moves back eight years with it. And what weighs most across every area is not the cost of holding land but the construction cost escalation that comes from the start of works moving eight years back. Re-examining a business plan in that order is the rational approach.
Methodology and Sources
■ Estimate assumptions
Land holding cost: 2,000m² site, fixed asset tax assessed base set at 70% of the published land price at a 1.4% rate, borrowing interest 2.0% (full acquisition price debt-funded). City planning tax is excluded because it varies by municipality.
Construction cost: 100 rooms at 30m² per room with a 62% guestroom ratio, giving 4,839m² gross floor area. The base unit cost of ¥671,100/m² is derived from e-Stat’s Building Construction Starts Statistics for Hokkaido, use category 52 (lodging), dividing 2024 planned construction spend (¥128.71bn) by total floor area (191,797m²). The escalation rate uses +4.5% per year as the base case, with +3.0% and +6.0% as sensitivities.
Present value: a 5% discount rate is used as the base, with 4% and 6% shown alongside.
All figures are simplified estimates; an actual investment decision requires detailed, project-specific feasibility study.
■ Scope of aggregation
Settled-ADR estimates are calculated at the municipal level as the median of properties with observable sales in the month in question. The number of properties covered (N) is noted with each chart and table. Oshamambe Town is excluded from settled-ADR estimation because it has only one listed property. Room stock is the total rooms at properties with at least one room registered in the property master, within a 3km radius of each station or planned site. Aggregation covers the scope tracked by MetroEngines Research and is not a complete census.
Related Reading
- Naniwasuji & Haneda Access Lines 2031: Hotel Investment Timelines
- Niseko’s Top Tier: Just 2 Hotels, 75 Rooms — Where Fairmont’s 165 Fit
- Chitose & Tomakomai Worker Lodging — 7 New Hotels, 738 Rooms in 2026
- 429 Municipalities Have 1 Hotel or Fewer — Just 51 Are True Blanks
- Hokkaido ADR H1 2026: City −5.7%, Business +4.1%, April the Turn
- Hotel Development Capacity 2026: Zoning, FAR & Land Price in 5 Markets
- Station Premium Ends at an 8-Minute Walk: 8 Stations, 1,012 Hotels
- Policy Rate 1.00%: Break-Even ADR Across Japan’s 8 Hotel Markets
References and Sources
■ Data sources
Settled-ADR estimates and room stock are aggregated by MetroEngines Research & Consulting. ADR uses the median of properties with observable sales in the month at the municipal level, covering only months with finalised results (January 2026 coverage: Kutchan 20 properties, Niseko 10, Otaru 25, Yakumo 7, Hakodate 82, Hokuto 6). Room stock is the sum of rooms registered in the property master within a 3km radius of each station or planned site. Resident population is from MLIT National Land Numerical Information, “Projected Population by 250m Mesh”; employment from the Ministry of Internal Affairs and Communications and Ministry of Economy, Trade and Industry, “Economic Census for Business Activity”; land prices from MLIT “Published Land Prices” (2026); construction costs from e-Stat “Building Construction Starts Statistics” (Hokkaido, lodging use); and planned hotels from MLIT “Construction Statistics Survey” on a building confirmation application basis. The opening outlook and section specifications are from published materials of the Japan Railway Construction, Transport and Technology Agency and MLIT.
■ Limitations and caveats
The end of FY2038 is not a confirmed opening date but an “approximately, around” expectation, so the eight-year premise of this article itself carries a range. Oshamambe Town has only one listed property and is therefore excluded from settled-ADR estimation; coverage for Hokuto City and Yakumo Town is also thin at 4–7 properties per month, so those figures should be read for direction rather than level. The land price scenario “if the recent rate persists eight years” is a simple compounding calculation to show sensitivity, not a forecast. The construction cost escalation rate is an assumption drawn from the general range of construction cost forecasts and differs from project-specific quotations and procurement terms. Planned hotels are a lower bound on a confirmation-application basis and will rise as further applications are filed. Employment data may understate actual conditions in districts with sparse coverage (Oshamambe and Shin-Hakodate-Hokuto). All figures are simplified estimates; an actual investment decision requires detailed, project-specific feasibility study.
■ Market data
- MetroEngines Research & Consulting — settled-ADR estimates, published prices, room stock aggregation
■ Primary sources (Shinkansen)
- Japan Railway Construction, Transport and Technology Agency (JRTT), “Hokkaido Shinkansen | Projects Under Construction” — section specifications, completion and opening outlook, construction progress
- MLIT, “Expert Panel on the Development of the Hokkaido Shinkansen (Shin-Hakodate-Hokuto–Sapporo Section)”
■ Government statistics and public data
- MLIT, “Published Land Prices 2026” (released 18 March 2026)
- e-Stat, “Building Construction Starts Statistics” (statistics ID 0003114490, Hokkaido, use category 52 lodging)
- MLIT National Land Numerical Information, “Projected Population by 250m Mesh (2024 National Institute estimate)”
- Ministry of Internal Affairs and Communications and Ministry of Economy, Trade and Industry, “Economic Census for Business Activity (2021)” / boundaries from the 2020 Population Census small-area data (e-Stat Statistical GIS)
- MLIT, “Construction Statistics Survey” (building confirmation application data for planned hotels)
■ Municipal and related materials