

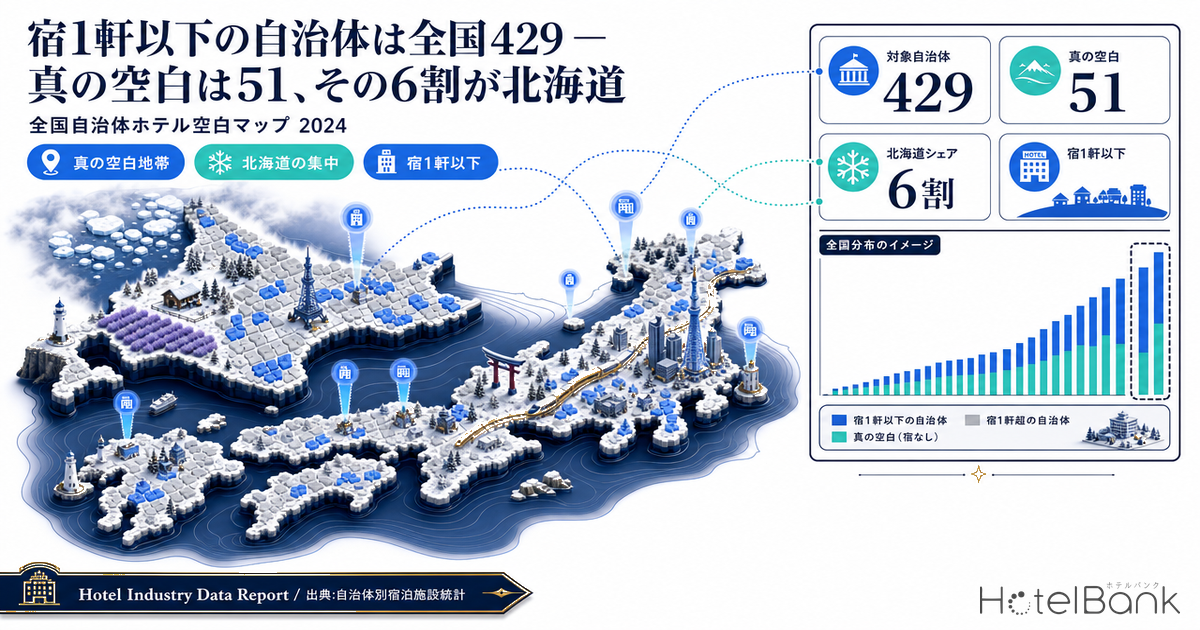
Counting Japan’s municipalities one by one, 429 of them have one or zero lodging facilities whose operation can be confirmed on OTAs. That is 24.9% of the 1,721 municipalities assessed — roughly one in four. Read those 429 as “accommodation supply blank zones,” however, and you will get the judgment badly wrong. Re-measured by the room inventory within a 30 km radius of each municipal office, 378 of the 429 (88.1%) have a thick catchment next door. There is simply no hotel inside the municipal boundary; as a trade area, supply is sufficient. The 51 municipalities that are genuinely blank — fewer than 1,000 rooms even within 30 km — break down as 30 in Hokkaido and 13 on remote islands. This article shows how to separate the two types, and outlines with numbers what development headroom actually remains on the blank side.
Metric Definitions Used in This Article
- Listed facilities: the number of lodging facilities for which a selling price was confirmed on OTAs in August 2026 (counted per municipality). Minshuku, simple lodging houses, municipally operated training lodges not listed on OTAs, and facilities not sold to general travelers are excluded. “Zero listed facilities” therefore does not mean there is nowhere at all to stay in that municipality.
- Rooms within a 30 km radius: the total number of guest rooms at lodging facilities located within 30 km of each municipality’s representative point (the municipal center coordinates obtained from the Geospatial Information Authority of Japan place-name search). The population is the facility master maintained by MetroEngines Research, which is a deliberately broad aggregation that also includes facilities not listed on OTAs. A verdict of “thin even within 30 km” is therefore a conservative reading of how thin supply is.
- Municipalities assessed: of the 1,741 municipalities recorded in the Ministry of Internal Affairs and Communications “Local Government Codes” (excluding the 6 villages of the Northern Territories), the 1,721 remaining after excluding the 20 government-ordinance-designated cities whose listing data is aggregated by administrative ward.
- Data sources: MetroEngines Research & Consulting / Ministry of Internal Affairs and Communications “Local Government Codes” / Geospatial Information Authority of Japan “Place-name Search API”
- — Of the 1,721 municipalities assessed, 429 have one or zero lodging facilities confirmed operating on OTAs (24.9%). Of those, 205 had zero listings.
- — Re-measured by room inventory within a 30 km radius, 378 of the 429 (88.1%) have a catchment of 1,000 rooms or more in range. Zero inventory inside the municipal boundary is not the same thing as a blank trade area.
- — The 51 municipalities that fall below 1,000 rooms even within 30 km are the true blanks. Hokkaido accounts for 30 (58.8%) and remote islands for 13; the 38 on the mainland center on Hokkaido and northern Iwate.
- — In 2025, foreign guest nights in regional areas rose 19.1% year on year, outpacing the 5.1% gain in the three major metropolitan areas — yet planned and under-construction lodging projects cluster in existing supply hubs, and not one falls in the 51 Type A municipalities.
- — Rooms within 30 km of Type A municipalities range from a minimum of 15, a median of 362, and a maximum of 975. A 100-room build multiplies in-range inventory at the median point by 1.28x, so the workable development scale differs by an order of magnitude from site to site.
429 municipalities have one hotel or fewer — and metropolitan prefectures rank high
Start with the national distribution. Of the municipalities recorded in the Ministry of Internal Affairs and Communications “Local Government Codes,” we matched listed-facility counts as of August 2026 against the 1,721 municipalities remaining after excluding the 20 government-ordinance-designated cities whose listing data is aggregated by administrative ward. The result: 429 municipalities with one listed facility or fewer, of which 205 had no listing confirmed at all.
What is unexpected is that the prefectures with the highest shares are not only depopulating ones. Ranked by ratio, Saga leads at 45.0% (9 of 20 municipalities), followed by Fukuoka at 44.8% (26 of 58), Aomori at 42.5%, Nara at 41.0% and Saitama at 40.3%. Fukuoka, Nara and Saitama all contain major metropolitan areas. In other words, “one hotel or fewer” is not proof that demand is absent; it also arises as a state in which lodging demand is being absorbed by the neighboring municipality.
In absolute numbers, Hokkaido has the most at 62 municipalities, followed by Fukuoka with 26, Saitama 25, Fukushima 20 and Aomori 17. The table below breaks down the top 20 prefectures by ratio; the rightmost column, “of which blank type,” is the count of Type A as defined in the next section. Thirty of Hokkaido’s 62 and six of Iwate’s seven were classified as blank type, while Saga, Fukuoka, Nara and Saitama had zero. The same “one or fewer” label covers completely different realities.
| Prefecture | Assessed | ≤1 facility | of which zero | of which blank (A) | Ratio |
|---|---|---|---|---|---|
| Saga | 20 | 9 | 2 | 0 | 45.0% |
| Fukuoka | 58 | 26 | 15 | 0 | 44.8% |
| Aomori | 40 | 17 | 9 | 2 | 42.5% |
| Nara | 39 | 16 | 4 | 0 | 41.0% |
| Saitama | 62 | 25 | 12 | 0 | 40.3% |
| Gifu | 42 | 16 | 11 | 0 | 38.1% |
| Tottori | 19 | 7 | 2 | 0 | 36.8% |
| Hokkaido | 178 | 62 | 25 | 30 | 34.8% |
| Fukushima | 59 | 20 | 9 | 0 | 33.9% |
| Kanagawa | 30 | 10 | 6 | 0 | 33.3% |
| Kyoto | 25 | 8 | 4 | 0 | 32.0% |
| Gunma | 35 | 11 | 7 | 0 | 31.4% |
| Aichi | 53 | 16 | 10 | 0 | 30.2% |
| Osaka | 41 | 12 | 4 | 0 | 29.3% |
| Kumamoto | 44 | 12 | 4 | 0 | 27.3% |
| Miyazaki | 26 | 7 | 3 | 0 | 26.9% |
| Miyagi | 34 | 9 | 5 | 0 | 26.5% |
| Yamaguchi | 19 | 5 | 4 | 0 | 26.3% |
| Yamagata | 35 | 9 | 3 | 0 | 25.7% |
| Tokushima | 24 | 6 | 3 | 0 | 25.0% |
Re-measured at a 30 km radius, 88% land on the “catchment exists” side
We therefore aggregated, for all 429 municipalities, the guest rooms at lodging facilities within 30 km of the representative point. Given rural road conditions, 30 km corresponds roughly to a 40–50 minute drive. It is the range within which a traveler whose destination is that municipality may in practice end up sleeping in a neighboring one.
The resulting distribution was extremely skewed. The median room count within 30 km across the 429 municipalities is 11,038 rooms. At the top sit municipalities with more than 300,000 rooms in range. Mitaka City in Tokyo, for example, has one listed facility inside the city (Mitaka City Hotel, 67 rooms) but 4,508 facilities and 335,125 rooms within 30 km. The fact that there is no hotel in the city does not mean supply is short in this trade area.
At the left edge of this distribution, 51 municipalities have fewer than 1,000 rooms within 30 km. A 1,000-room line corresponds to a catchment that can accommodate on the order of fewer than 2,000 guests a night — less than a single mid-sized hot-spring resort area. From here on, we call these 51 Type A (true blanks) and the remaining 378 Type B (catchment type).
Type B Catchment type — 378 municipalities
One listed facility or fewer inside the municipality, but 1,000 rooms or more within 30 km. Lodging demand is being absorbed by the adjacent central city. If you are considering a new build, the benchmark is not “competitors inside this municipality” but the existing inventory of the central city.
Type A True blank — 51 municipalities
Thin both inside the municipality and within 30 km. When visit demand arises it cannot be absorbed in range, so the overnight stay flows to a neighboring prefecture or farther afield, or converts into a day trip. This is territory where building the capacity itself creates the length of stay.
What the split means in practice
Use a “list of municipalities with no hotels” directly as a site shortlist and nearly nine in ten of them will in fact sit inside a competitively crowded metropolitan area. Zero inventory at the municipal level is not the same thing as a blank trade area.
Type B: the “one or fewer” municipalities of Fukuoka, Nara and Saitama sit behind central cities
By prefecture, Type B is led by Hokkaido with 32, then Fukuoka 26, Saitama 25, Fukushima 20, Nara 16, Aichi 16 and Gifu 16. All 26 of Fukuoka’s municipalities are Type B, with not a single blank type. Kasuya Town (zero listings) has 1,115 facilities and 59,369 rooms within 30 km; Onojo City (one listing) has 1,151 facilities and 61,304 rooms. Both sit where Fukuoka City’s entire lodging inventory falls inside the radius.
Shikoku is the same. Six municipalities in Tokushima Prefecture came in at one facility or fewer (Katsuura, Kamikatsu, Sanagochi, Ishii, Kitajima and Itano), but each has 7,000–10,000 rooms within 30 km and all were classified as Type B. The seven municipalities in Kochi Prefecture (Tano, Yasuda, Kitagawa, Umaji, Okawa, Sakawa and Mihara) are likewise all Type B; even Tano, the thinnest, has 1,082 rooms within 30 km. Shikoku’s “municipalities with no hotels” have the inventory of Tokushima City, Kochi City and the Muroto area standing behind them.
| Prefecture | Municipality | Listed facilities | Facilities within 30 km | Rooms within 30 km |
|---|---|---|---|---|
| Tokyo | Mitaka City | 1 | 4,508 | 335,125 |
| Tokyo | Komae City | 0 | 4,437 | 334,300 |
| Saitama | Yashio City | 1 | 3,905 | 289,769 |
| Kanagawa | Zama City | 0 | 1,369 | 77,946 |
| Nara | Ikaruga Town | 1 | 2,704 | 167,668 |
| Fukuoka | Kasuya Town | 0 | 1,115 | 59,369 |
| Fukuoka | Onojo City | 1 | 1,151 | 61,304 |
| Saga | Kiyama Town | 1 | 1,240 | 63,197 |
| Tokushima | Kitajima Town | 0 | 406 | 10,104 |
| Kochi | Sakawa Town | 0 | 213 | 7,640 |
Type A: 60% of the 51 true blanks are in Hokkaido, a quarter are remote islands
Splitting the 51 Type A municipalities by prefecture gives Hokkaido 30, Iwate 6, Okinawa 5, Aomori 2, Tokyo 2, Shimane 2, Kagoshima 2, Niigata 1 and Oita 1. Hokkaido accounts for 58.8%. Thirteen of the 51 are remote islands (Mishima and Toshima villages in Kagoshima; Tarama, Aguni, Kitadaito, Iheya and Tonaki villages in Okinawa; Aogashima and Mikurajima villages in Tokyo; Awashimaura village in Niigata; Chibu village in Shimane; Okushiri town in Hokkaido; and Himeshima village in Oita), and the remaining 38 are inland or coastal locations on the mainland. How lodging rates on the island side form their own tiers is covered in detail in our analysis comparing lodging rates across 10 major island municipalities.
Plotted on a map, the structure is clear. Of the 38 on the mainland, 29 are in Hokkaido, scattered across the Sea of Okhotsk coast (Omu, Okoppe, Nishiokoppe, Takinoue, Hamatonbetsu and Sarufutsu), the Rumoi–Soya stretch on the Sea of Japan side (Embetsu, Shosanbetsu, Tomamae, Obira and Horonobe), southern Hokkaido (Matsumae, Fukushima, Shiriuchi, Oshamambe and Imakane), Tokachi and eastern Hokkaido (Urahoro, Taiki and Honbetsu), and the northern interior (Nakagawa, Otoineppu and Bifuka). Outside Hokkaido, six municipalities cluster in northern Iwate and along the Sanriku coast (Kuzumaki, Ichinohe, Kunohe, Noda, Fudai and Tanohata).
The table below is the full list of 51, ordered from the fewest rooms within 30 km. Remote islands cluster at the top: Mishima Village in Kagoshima has just 3 facilities and 15 rooms even within 30 km, and Tarama Village in Okinawa 3 facilities and 37 rooms. The thinnest on the mainland is Omu Town in Hokkaido, with 5 facilities and 61 rooms within 15 km and 14 facilities and 145 rooms within 30 km.
| # | Prefecture | Municipality | Listed facilities | Facilities within 15 km | Rooms within 15 km | Facilities within 30 km | Rooms within 30 km |
|---|---|---|---|---|---|---|---|
| 1 | Kagoshima | Mishima Village (island) | 0 | 3 | 15 | 3 | 15 |
| 2 | Kagoshima | Toshima Village (island) | 0 | 2 | 8 | 4 | 37 |
| 3 | Okinawa | Tarama Village (island) | 0 | 3 | 37 | 3 | 37 |
| 4 | Tokyo | Aogashima Village (island) | 0 | 6 | 46 | 6 | 46 |
| 5 | Okinawa | Aguni Village (island) | 0 | 5 | 37 | 8 | 49 |
| 6 | Okinawa | Kitadaito Village (island) | 0 | 6 | 80 | 6 | 80 |
| 7 | Hokkaido | Omu Town | 1 | 5 | 61 | 14 | 145 |
| 8 | Hokkaido | Urahoro Town | 1 | 7 | 59 | 23 | 180 |
| 9 | Okinawa | Iheya Village (island) | 1 | 21 | 207 | 21 | 207 |
| 10 | Hokkaido | Embetsu Town | 1 | 6 | 67 | 16 | 219 |
| 11 | Niigata | Awashimaura Village (island) | 0 | 12 | 114 | 31 | 231 |
| 12 | Hokkaido | Nishiokoppe Village | 1 | 2 | 28 | 19 | 237 |
| 13 | Aomori | Imabetsu Town | 0 | 14 | 140 | 29 | 242 |
| 14 | Hokkaido | Shimamaki Village | 0 | 9 | 65 | 24 | 243 |
| 15 | Hokkaido | Sarufutsu Village | 0 | 4 | 78 | 15 | 253 |
| 16 | Tokyo | Mikurajima Village (island) | 0 | 7 | 34 | 33 | 253 |
| 17 | Hokkaido | Matsumae Town | 1 | 8 | 97 | 20 | 264 |
| 18 | Hokkaido | Hamatonbetsu Town | 0 | 6 | 76 | 17 | 272 |
| 19 | Hokkaido | Oshamambe Town | 1 | 13 | 166 | 29 | 292 |
| 20 | Hokkaido | Taiki Town | 1 | 8 | 75 | 25 | 302 |
| 21 | Shimane | Chibu Village (island) | 0 | 41 | 275 | 43 | 311 |
| 22 | Hokkaido | Okushiri Town (island) | 0 | 26 | 312 | 26 | 312 |
| 23 | Hokkaido | Honbetsu Town | 1 | 13 | 191 | 31 | 332 |
| 24 | Hokkaido | Shiriuchi Town | 1 | 18 | 269 | 30 | 340 |
| 25 | Iwate | Kuzumaki Town | 0 | 3 | 50 | 23 | 348 |
| 26 | Hokkaido | Nakagawa Town | 0 | 4 | 51 | 26 | 362 |
| 27 | Hokkaido | Suttsu Town | 0 | 8 | 73 | 36 | 389 |
| 28 | Hokkaido | Shosanbetsu Village | 1 | 2 | 32 | 30 | 399 |
| 29 | Hokkaido | Kuromatsunai Town | 0 | 5 | 95 | 45 | 400 |
| 30 | Hokkaido | Otoineppu Village | 1 | 3 | 39 | 15 | 428 |
| 31 | Hokkaido | Fukushima Town | 0 | 13 | 196 | 32 | 433 |
| 32 | Hokkaido | Tomamae Town | 1 | 19 | 256 | 35 | 459 |
| 33 | Hokkaido | Horonobe Town | 1 | 15 | 315 | 27 | 462 |
| 34 | Hokkaido | Imakane Town | 1 | 13 | 203 | 41 | 548 |
| 35 | Hokkaido | Obira Town | 0 | 21 | 384 | 38 | 572 |
| 36 | Iwate | Tanohata Village | 1 | 22 | 335 | 41 | 611 |
| 37 | Iwate | Ichinohe Town | 1 | 19 | 382 | 45 | 671 |
| 38 | Hokkaido | Niikappu Town | 1 | 20 | 476 | 33 | 690 |
| 39 | Hokkaido | Takinoue Town | 1 | 3 | 56 | 26 | 698 |
| 40 | Aomori | Sai Village | 0 | 23 | 309 | 57 | 716 |
| 41 | Iwate | Noda Village | 1 | 20 | 390 | 41 | 723 |
| 42 | Hokkaido | Okoppe Town | 0 | 9 | 89 | 31 | 732 |
| 43 | Okinawa | Tonaki Village (island) | 0 | 3 | 12 | 89 | 761 |
| 44 | Iwate | Fudai Village | 1 | 13 | 211 | 43 | 782 |
| 45 | Oita | Himeshima Village (island) | 1 | 21 | 195 | 47 | 808 |
| 46 | Iwate | Kunohe Village | 1 | 18 | 339 | 51 | 831 |
| 47 | Hokkaido | Bifuka Town | 1 | 7 | 279 | 30 | 850 |
| 48 | Shimane | Yoshika Town | 1 | 9 | 158 | 73 | 884 |
| 49 | Hokkaido | Uryu Town | 0 | 29 | 512 | 58 | 928 |
| 50 | Hokkaido | Chippubetsu Town | 1 | 18 | 228 | 56 | 932 |
| 51 | Hokkaido | Numata Town | 1 | 12 | 180 | 57 | 975 |
The shape of the opportunity — demand-side signals, and a skewed supply pipeline
The 51 blank municipalities cannot simply be called an untapped market. In most of them, the explanation that supply is thin because demand is thin holds. Even so, there are a few areas where demand-side signals can be confirmed.
The macro tailwind is clear in the numbers. According to the Japan Tourism Agency “Overnight Travel Statistics Survey,” total guest nights in 2025 came to 661.11 million, of which foreign guest nights were 179.92 million, up 9.4% year on year. Within that, foreign guest nights in the three major metropolitan areas (Tokyo, Kanagawa, Chiba, Saitama, Aichi, Osaka, Kyoto and Hyogo) were 119.36 million, up 5.1%, while regional areas recorded 60.56 million, up 19.1% year on year — far outpacing the urban gain. The increment of demand is being distributed more heavily to the regions.
Looked at individually, some Type A areas do have concrete reasons for visits. Five municipalities in northern Iwate (coastal Noda, Fudai and Tanohata, plus inland Kunohe and Ichinohe) sit along or near the Sanriku Coastal Road, fully opened on 18 December 2021 (Sendai–Hachinohe, 359 km, the longest toll-free stretch in Japan). Access conditions are a different animal from before the 2011 earthquake, yet rooms within 30 km remain at 611 for Tanohata, 782 for Fudai and 723 for Noda. Ichinohe is home to the Goshono Site, inscribed in 2021 as a component of the World Heritage “Jomon Prehistoric Sites in Northern Japan,” and has 671 rooms within 30 km.
Taiki Town in Hokkaido shows the same structure. Hokkaido Spaceport (HOSPO) in the town has been in full operation since April 2021 as a private commercial spaceport; several operators have selected it as a launch site, and a reusable rocket launch is planned for fiscal 2027. Yet Taiki has one listed facility, and only 25 facilities with 302 rooms even within 30 km. However much launch-related visitation accumulates, the rooms available to absorb it in range are limited.
And the supply pipeline is not pointed at filling this blank. Looking at planned and under-construction projects based on the Ministry of Land, Infrastructure, Transport and Tourism “Construction Statistics Survey,” eight can be confirmed in Hokkaido — five in Sapporo City, one in Furano City, one in Kutchan Town and one in Kitahiroshima City, all of them existing supply hubs. The 7 properties and 738 rooms opening in 2026 across Chitose and Tomakomai in central Hokkaido, which we broke down in a separate analysis, show the same pattern of supply converging where demand is legible. Iwate has a single project in Rikuzentakata City and Okinawa a single one in Urasoe City. Not one planned project falls in the 51 Type A municipalities. Note that this is on a building-confirmation-application basis as of the survey date; counts are expected to rise as further applications are filed, so treat it as a lower bound on the confirmed pipeline at this point.
How to read it — “blank” is not a shortlist of sites, it is a checklist of preconditions
Translated into a development screening procedure, the above comes out as follows.
First, do not treat zero inventory at the municipal level as a site signal. Of the 429, 88.1% are Type B — locations that compete head-on with the inventory of a central city. The question to ask in that case is not “why is there no hotel in this municipality?” but “can we create a reason for a guest who would otherwise stay in the central city to stay here instead?” That requires conditions the central city’s inventory cannot easily offer: proximity to an airport or expressway interchange, adjacency to a large facility, or fittings suited to extended stays. Re-measuring inventory depth at the trade-area level is the same move used when reading entry headroom from 15-year supply curves across Japan’s 20 major markets.
Second, in Type A there is room for a new facility to create length of stay in itself. In an environment with fewer than 1,000 rooms within 30 km, even rising occupancy at existing properties cannot absorb new guests. That said, 13 of the 51 are remote islands, where construction costs, staffing and seasonality impose constraints an order of magnitude heavier than on the mainland. The 38 on the mainland — particularly areas whose access conditions have changed in recent years (northern Iwate along the Sanriku Coastal Road) and areas where new reasons to visit are emerging (Taiki Town, Hokkaido) — are worth verifying demand for case by case.
Third comes sizing. Rooms within 30 km across Type A range from a minimum of 15 to a maximum of 975. A 100-room build is a scale that could double in-range inventory outright. Small, distributed formats that can be expanded in stages while confirming actual occupancy — or the renovation and rebranding of existing facilities — sit more naturally with this order of magnitude. The premise is to design in a form where the supply ratio is legible, as in the case of 283 rooms being added in Hida.
Supply impact by scale — dividing new rooms by the 30 km inventory
Let us put the previous section’s “sizing” into numbers. What matters in Type A is not the absolute room count but the ratio a new build represents against in-range inventory. There is exactly one identity computable from the figures in this article: supply uplift rate = new rooms ÷ rooms within a 30 km radius. It assumes neither occupancy nor rate; it is a unit conversion, not a revenue forecast.
| Supply scale | Thinnest point 15 rooms | Median point 362 rooms | Largest point 975 rooms | Inventory multiple at the median point |
|---|---|---|---|---|
| Small, distributed (10 rooms) | 66.7% | 2.8% | 1.0% | 1.03x |
| Mid-scale (50 rooms) | 333.3% | 13.8% | 5.1% | 1.14x |
| 100-room class (100 rooms) | 666.7% | 27.6% | 10.3% | 1.28x |
Adding a 100-room class property at the median point (362 rooms within 30 km) makes in-range room inventory 1.28x larger. The “scale that could double inventory outright” mentioned above becomes even more extreme at the lower end of Type A: at the thinnest point, even a 10-room build lifts in-range inventory by 66.7%. Conversely, at the upper bound of 975 rooms, 100 rooms amounts to just 10.3% — a ratio no different from ordinary new entry. Even within the same “blank,” the workable scale differs by an order of magnitude.
| New rooms \ rooms within 30 km | 15 rooms Mishima Village, Kagoshima | 145 rooms Omu Town, Hokkaido | 302 rooms Taiki Town, Hokkaido | 611 rooms Tanohata Village, Iwate | 975 rooms Numata Town, Hokkaido |
|---|---|---|---|---|---|
| 10 rooms | 66.7% | 6.9% | 3.3% | 1.6% | 1.0% |
| 20 rooms | 133.3% | 13.8% | 6.6% | 3.3% | 2.1% |
| 50 rooms | 333.3% | 34.5% | 16.6% | 8.2% | 5.1% |
| 67 rooms | 446.7% | 46.2% | 22.2% | 11.0% | 6.9% |
| 100 rooms | 666.7% | 69.0% | 33.1% | 16.4% | 10.3% |
The reading is simple. The lower right of the grid, where uplift rates stay in the low teens, is the range that existing inventory depth can absorb; the further you move toward the upper left, the further you enter territory where your own build reshapes the supply-demand balance of your own trade area. Of the 51 Type A municipalities, 26 — a majority — have 362 rooms or fewer within 30 km, and on that side a 100-room class build means an uplift of 27.6% or more. The asymmetry of this ratio is why staged formats that expand while confirming occupancy, and the renovation or rebranding of existing facilities, were described as the better fit.
Summary
Of Japan’s 1,721 assessed municipalities, 429 (24.9%) have one or zero lodging facilities whose operation can be confirmed on OTAs, and 205 of those have zero listings. Re-measured by room inventory within a 30 km radius, however, 378 (88.1%) have a catchment of 1,000 rooms or more next door. Zero inventory inside a municipal boundary is a different phenomenon from a blank trade area.
The true blanks — fewer than 1,000 rooms even within 30 km — number 51 municipalities, of which Hokkaido accounts for 30 and remote islands for 13. Foreign guest nights in regional areas rose 19.1% year on year in 2025, far outpacing urban areas, so demand is flowing heavily toward the regions. Even so, planned and under-construction lodging facilities cluster in existing supply hubs, and not one can be confirmed in the 51 blank municipalities. The practice of taking stock of room inventory municipality by municipality works the same way for event readiness and for development screening alike. Do not judge “present or absent” by looking at the municipal boundary alone; re-measuring at the radius of the trade area is the starting point.
Related reading
- World Masters Games 2027 Kansai: 164,707 Rooms Across 50 Venue Cities
- Hilton Takayama Resort Opens Sept 14: 283 Rooms Into a 562-Room Tier
- Dusit’s Japan Debut at Lake Toya: 8 Asian Luxury Brands’ Entry Routes
- Station Premium Ends at an 8-Minute Walk: 8 Stations, 1,012 Hotels
- Okinawa 2026: 2,842 New Rooms, 0.6% Business vs 22.1% City Inventory
- Autumn on Japan’s Islands: 2.37x ADR Gap Across 10 Municipalities
- Japan Intra-Prefecture ADR Gaps Reach 5.2x: 368 Municipalities Ranked
- Chitose & Tomakomai Worker Lodging — 7 New Hotels, 738 Rooms in 2026
References and Sources
■ Data sources
MetroEngines Research & Consulting listed-facility counts by municipality (August 2026, OTA listing-confirmed basis; 1,721 municipalities assessed) and facility and room counts within 15 km and 30 km of municipal representative coordinates (facility-master basis, including facilities not listed on OTAs). The municipality master is the Ministry of Internal Affairs and Communications “Local Government Codes” (1,741 entities, excluding the 6 villages of the Northern Territories); representative coordinates are from the Geospatial Information Authority of Japan “Place-name Search API.” National demand-side figures are the Japan Tourism Agency “Overnight Travel Statistics Survey,” 2025 annual values (final figures, released 6 July 2026). The supply pipeline is planned and under-construction projects based on the Ministry of Land, Infrastructure, Transport and Tourism “Construction Statistics Survey” (building-confirmation-application basis).
■ Calculation assumptions
The assessed set is the 1,721 municipalities remaining after excluding, from the 1,741 entities, the 20 government-ordinance-designated cities whose listing data is aggregated by administrative ward. “One or fewer” is the sum of municipalities with zero and with one listed facility; zero means no listed facility could be confirmed in that municipality. The type split uses 1,000 rooms within a 30 km radius as the boundary: 1,000 or more is Type B (catchment type), under 1,000 is Type A (true blank). Supply uplift rates by scale are computed solely as the unit conversion “new rooms ÷ rooms within 30 km,” with no assumptions about occupancy, rate or cost (this is not a revenue forecast). The five levels on the horizontal axis of the grid (15 / 145 / 302 / 611 / 975 rooms) are all values of points that actually appear in the Type A list in the body text; the vertical axis is confined to the range from the average size of existing facilities in range (about 10 rooms) up to the “100-room class” cited in the body, and no extrapolation beyond the observed range has been performed.
■ Limitations and caveats
Listed-facility counts are limited to facilities for which a selling price was confirmed on OTAs, and exclude minshuku, simple lodging houses and municipally operated training lodges not listed on OTAs. “Zero listings” therefore does not mean that no place to stay exists in that municipality. The 15 km and 30 km radii are measured as straight-line distances from a single representative point per municipality; actual travel times vary considerably with road conditions and, for islands, ferry schedules. The 20 government-ordinance-designated cities are excluded from the assessed set because their aggregation unit is the administrative ward, so the national ratios in this article are computed against a denominator that does not include those 20 cities. The supply pipeline is on a building-confirmation-application basis as of the survey date and should be read as a lower bound that will rise as further applications are filed.
■ Market data
- MetroEngines Research & Consulting — listed-facility counts by municipality (August 2026, 1,721 municipalities assessed); facility and room counts within 15 km and 30 km (facility-master basis, N=429 municipalities)
■ Government statistics and public data
- Ministry of Internal Affairs and Communications, “Local Government Codes” — municipality master (1,741 entities, excluding the 6 villages of the Northern Territories)
- Japan Tourism Agency, “Overnight Travel Statistics Survey,” 2025 annual values (final figures) — 2025 total guest nights 661.11 million, foreign guest nights 179.92 million (up 9.4% YoY), foreign guest nights split between the three major metropolitan areas and regional areas (released 6 July 2026). The survey index is at Japan Tourism Agency, “Overnight Travel Statistics Survey”
- Geospatial Information Authority of Japan, “Place-name Search API” — municipal representative coordinates
- Ministry of Land, Infrastructure, Transport and Tourism, “Construction Statistics Survey” — planned and under-construction lodging projects (building-confirmation-application basis)
■ News, municipal and operator announcements
- Taiki Town, Hokkaido, “About Hokkaido Spaceport (HOSPO)”
- “Taiki spaceport running away with it — multiple firms select it as a launch site, reusable rocket launch set for FY2027” (Hokkaido Shimbun, 2026)
- Kuji City, “Sanriku Coastal Road (Sendai–Hachinohe), 359 km, fully opened” (18 December 2021)
- World Heritage “Jomon Prehistoric Sites in Northern Japan” official site — Goshono Site (Ichinohe Town, Iwate)
- “2025 guest nights: foreign visitors up 8% — Overnight Travel Statistics (preliminary)” (Travel Voice, 2 March 2026; reporting on a preliminary basis. The figures in this article use the annual final values cited above)