

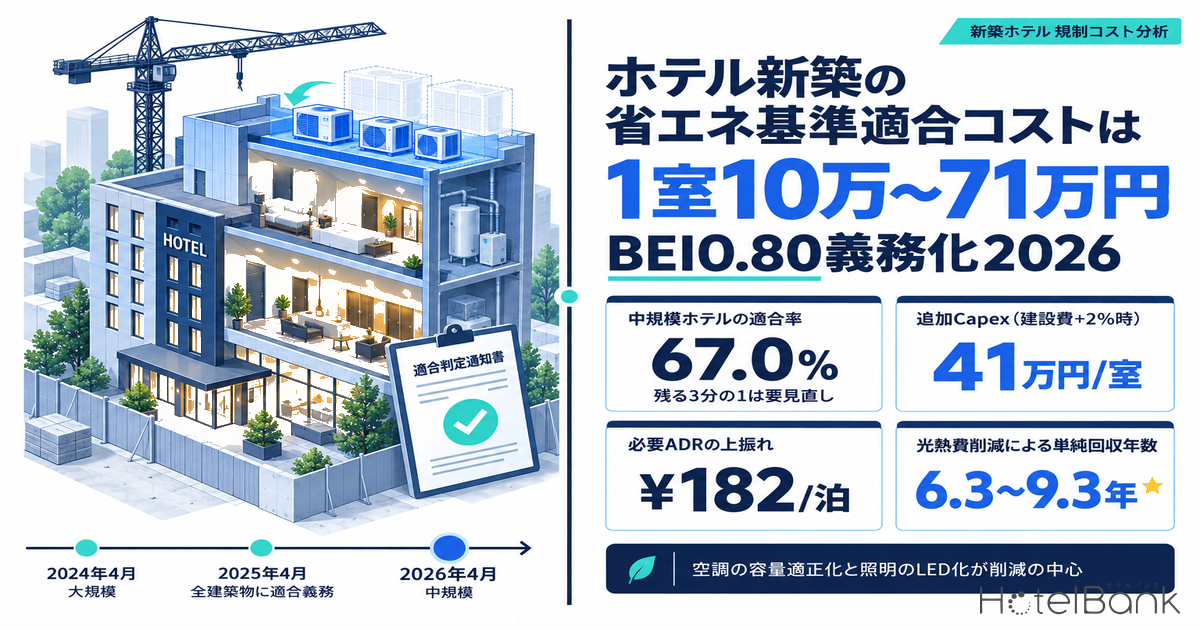
Since 1 April 2025, every new building in Japan on which construction starts must comply with the national energy efficiency standard. Energy code compliance is classified as a provision related to the Building Standards Act, so if compliance cannot be confirmed, no building confirmation certificate is issued and construction cannot begin. From 1 April 2026 the threshold itself was raised for medium-scale non-residential buildings with a total floor area of 300 m² or more but less than 2,000 m². For the hotel use class, designs must now hold primary energy consumption 20% below the reference value (BEI ≤ 0.80). This article quantifies how much that regulation adds to a new lodging development, using published Ministry of Land, Infrastructure, Transport and Tourism (MLIT) materials, the Building Construction Starts Statistics, and the size composition of the 1,506 properties that opened in 2026.
Our earlier work covered adjacent cost layers: rising electricity prices in the summer of 2026 and their effect on hotel GOP addressed operating-phase running costs, while Hotel Construction Cost ¥8.7M-71.4M per Room and Hotel Construction Cost ¥20.67M/Room addressed construction cost itself. This article deals with what comes before both — the precondition for breaking ground at all, namely whether the confirmation application clears — and isolates only the regulatory compliance portion within the construction cost range.
Metric Definitions Used in This Article
- BEI: design primary energy consumption divided by reference primary energy consumption. A value of 1.00 sits exactly at the reference level; 0.80 means a 20% reduction against it. The calculation covers five building services: air conditioning, ventilation, lighting, hot water supply and elevators.
- Energy Efficiency Conformity Assessment (省エネ適合性判定, “sho-ene tekihan”): review of the energy plan by the competent administrative agency or a registered building energy performance assessment body. Without the conformity assessment certificate, no building confirmation certificate is issued.
- ADR (average daily rate): an estimated transacted rate (tax-exclusive equivalent) derived by applying a category-specific adjustment factor to the lowest published plan rate each property posts on OTAs and similar channels (double occupancy, per-room, tax-inclusive). Cross-checked against property-level results disclosed by listed hotel REITs (91 properties, trailing three months), the median error is approximately 7%. These are estimates and differ from each property’s actual transacted prices and accounting figures. Area-level ADR is the median across the properties covered, representing the standard level for that area.
- Data sources: published materials from MLIT and the Ministry of Economy, Trade and Industry (METI), the e-Stat “Building Construction Starts Statistics”, and MetroEngines Research & Consulting.
- — BEI 0.80: applies from 1 April 2026 to medium-scale hotels of 300–2,000 m² total floor area. Large-scale buildings have been held to the same level since April 2024, and small-scale buildings have been subject to the compliance obligation since April 2025, so in practice every new-build plan now sits inside the regulatory perimeter.
- — 67.0%: share of past medium-scale hotel-class designs that already met BEI 0.80 or better, out of n=947. The remaining third will not receive a conformity assessment certificate on their existing design approach, which moves the construction start date.
- — 287 properties, 6,995 rooms: the medium-scale band among 2026 openings (1,498 with known room counts) where the required level actually changes. The reduction comes mainly from right-sizing air-conditioning capacity (rated heat source capacity down 26–29%) and LED lighting.
- — ¥103,000–710,000 per room: the add-on when additional construction work is modelled as a sensitivity of 0.5–3.0% of construction cost. For the 100-room model, +2.0% (¥414,000) corresponds to a required ADR uplift of ¥182 per night, or 1.3% of Tokyo business-hotel ADR.
- — 6.3–9.3 years: simple payback from utility cost savings across the three market models. Capitalising those savings at a 5.0% cap rate yields ¥890,000–1,310,000 per room, more than the additional capex.
A three-stage rollout across 2024, 2025 and 2026 brought every building inside the compliance obligation
The amendments that govern lodging design requirements did not arrive as a single event; they advanced in three stages, set out below.
The first stage came in April 2024. For large-scale non-residential buildings of 2,000 m² or more, the previously uniform BEI ≤ 1.00 standard was raised on a use-by-use basis, and hotel use moved to 0.80. The second stage came on 1 April 2025. Under the Act Partially Amending the Act on the Improvement of Energy Consumption Performance of Buildings and Related Acts to Contribute to the Realisation of a Decarbonised Society (Act No. 68 of 2022), every new build, extension and renovation of residential and non-residential buildings starting construction on or after that date became subject to the energy code compliance obligation. Because the obligation had previously been limited to medium-scale and larger non-residential buildings, small buildings under 300 m² entered the regulatory perimeter for the first time. The third stage was 1 April 2026: the raising of the standard for medium-scale non-residential buildings.
The legal basis for the third stage is the Ministerial Ordinance Partially Amending the Ministerial Ordinance Prescribing Building Energy Consumption Performance Standards (Ordinance No. 2 of 2024, METI and MLIT), promulgated on 16 October 2024 and in force from 1 April 2026. An administrative notice issued on 13 November 2025 by MLIT’s Housing Bureau Counsellor for Building Planning to prefectures and designated cities states the scope and level explicitly: for non-residential buildings where the floor area of the new, extended or renovated portion is 300 m² or more but less than 2,000 m², BEI must not exceed the value set for the relevant use — 0.75 for factories (a 25% reduction against the reference), 0.8 for offices, hotels, department stores and schools (a 20% reduction), and 0.85 for hospitals, restaurants and assembly halls (a 15% reduction).
| Size band (total floor area) | BEI standard for hotel use | Effective date of the increase | Energy Efficiency Conformity Assessment | Typical lodging examples |
|---|---|---|---|---|
| Large-scale (2,000 m² or more) | 1.00 → 0.80 | 1 April 2024 | Required | Limited-service, city and resort hotels of roughly 60 rooms or more |
| Medium-scale (300 m² to under 2,000 m²) | 1.00 → 0.80 | 1 April 2026 | Required | Boutique and small-format hotels of 10–50 rooms, small and mid-sized ryokan |
| Small-scale (under 300 m²) | 1.00 (unchanged) | Compliance obligation from 1 April 2025 | Required for non-residential use (can be omitted for residential use via prescriptive standards) | Rental villas, cottages, machiya townhouses, guesthouses |
Exemptions are narrowly drawn under Articles 10 and 20 of the Act: new builds, extensions and renovations of 10 m² or less; buildings that need no air-conditioning equipment because they have no habitable rooms or are highly open to the outside; historic buildings and cultural properties; and emergency temporary buildings, temporary buildings and temporary performance venues. In lodging use, effectively only extensions of 10 m² or less fall into this list — ordinary guest-room and back-of-house blocks should all be treated as in scope. Note too that in mixed-use buildings, a property is not exempt if it contains any portion that does not fall under an exempt use.
One in three medium-scale hotels will not reach 0.80 on their existing design approach
How much the higher threshold bites in practice depends on where current designs sit. The joint committee material published a cumulative BEI frequency distribution by use class for medium-scale non-residential buildings, drawn from five years of energy performance plans (conformity assessments and notifications) filed between fiscal 2018 and fiscal 2022. The population covers new builds of 300 m² to under 2,000 m² across all climate zones, with mixed-use buildings aggregated under their representative use; hotel use has n=947. Of those, 67.0% came in at BEI 0.80 or better.
Put the other way: roughly one third of medium-scale hotels will not receive a conformity assessment certificate from April 2026 if they carry their existing design straight through. Seen from the business plan, that is a scheduling question — whether the construction start date moves — before it is a question of whether construction cost rises. Measured against the threshold applicable to each use, schools lead at 82.7% and offices at 76.7%; hotel use sits mid-table at 67.0%, followed by department stores at 60.3%. Factories, judged against a stricter 0.75, come in at 69.4%, while the uses held to 0.85 sit lowest — hospitals 57.0%, assembly halls 61.3% and restaurants 49.7%. Hotel use occupies the position of “mostly there, but with a non-trivial tail”.
Reaching 0.80 is about HVAC and lighting design, not a wholesale rethink of the envelope
So what actually has to change? MLIT addresses this in its “Simple Guide to Energy-Efficient Design for Medium-Scale Non-Residential Buildings”, which publishes side-by-side average design specifications for hotel use (business hotels, climate zone 6) at the old standard level (BEIm ≈ 1.0, n=51) and the new standard level (BEIm ≈ 0.8, n=167). The figures are averages and modes taken from actual conformity assessment input data for the benefit of designers, and the guide notes they are not intended to restrict how compliance is achieved — but as primary data on which systems do the work, they are extremely useful.
According to the guide, the ▲0.15 reduction in BEIm breaks down as ▲0.09 from air conditioning, ▲0.05 from lighting and ▲0.01 from hot water. In other words, roughly 60% is air conditioning and 30% is lighting. The specification differences themselves are as follows.
| System | Design specification | Old standard level BEIm ≈ 1.0 (n=51) | New standard level BEIm ≈ 0.8 (n=167) | Difference |
|---|---|---|---|---|
| Air conditioning | Rated heat source capacity (cooling) | 281 W/m² | 208 W/m² | −26% |
| Rated heat source capacity (heating) | 342 W/m² | 243 W/m² | −29% | |
| Rated heat source efficiency (cooling) | 1.22 | 1.24 | +2% | |
| Rated heat source efficiency (heating) | 1.30 | 1.42 | +9% | |
| Lighting | Power consumption (guest rooms) | 7.2 W/m² | 4.2 W/m² | −42% |
| Power consumption (lobby) | 10.8 W/m² | 5.8 W/m² | −46% | |
| Hot water | Heat source efficiency (bathrooms) | 0.86 | 0.90 | +4% |
| Heat source efficiency (kitchen) | 0.78 | 0.86 | +10% |
The point not to miss is that the air-conditioning difference is driven by right-sizing capacity, not by higher efficiency. Efficiency moves only 2% on cooling and 9% on heating, while rated heat source capacity falls 26% on cooling and 29% on heating. The guide itself lists “right-sizing and improving the efficiency of air-conditioning equipment (cooling and heating)” as a key measure. Switching to designs that do not carry oversized heat sources is the single largest source of BEI reduction — and because smaller capacity also pushes equipment prices down, this element is a source of cost headroom rather than added cost.
The ▲42–46% on lighting is, likewise, in practice LED conversion and a rethink of zoning. Moreover, general-purpose fluorescent lamps are being phased out: under the decision of the fifth Conference of the Parties to the Minamata Convention on Mercury (October–November 2023), manufacture, import and export of compact fluorescent lamps ends on 31 December 2026, and of linear and circular fluorescent lamps on 31 December 2027. A design that newly specifies fluorescent lighting in a building starting construction in 2026 or later is barely viable in any case, so the lighting difference is closer to an established trajectory than to a regulatory response.
The joint committee also published the results of hearings with industry bodies on feasibility from a design-practice standpoint. The Japan Federation of Building Services Design Firms Associations and the Society of Heating, Air-Conditioning and Sanitary Engineers of Japan both responded that manufacturers have emphasised COP in recent years, that qualifying products are available on the market, and that for new construction there is no particular obstacle because equipment location, maintenance and replacement methods are examined as part of the design anyway. The committee’s own conclusion was that the levels “are achievable through measures on the equipment side for each use class (with further headroom available through envelope refinements)”. Not requiring a wholesale rebuild of the envelope is, in other words, the regulator’s own design intent.
The hearings did, however, flag extensions and renovations: “there are many constraints — the state of existing building infrastructure connections and plant space planning requires examination including replacement methods — so compliance is not straightforward.” Where the extension or renovation exceeds 10 m², that portion becomes subject to the compliance obligation, and from April 2025 the applicable level follows the size band corresponding to the floor area of that portion. For owners considering a guest-room block extension or a conversion, this can be a harder problem than new construction.
Re-sorting the 1,506 properties opening in 2026 into size bands puts 287 properties and 6,995 rooms in the medium band
How much volume does the higher threshold actually touch? Across the 1,506 lodging properties that opened in 2026 within MetroEngines Research & Consulting’s coverage (those whose category could be identified, on an OTA-listing basis), sorting by room count puts 1,064 properties in the 1–9 room range — 70.7% of the total. The mean is 25 rooms and the maximum is 750.
To re-sort these into the regulatory size bands, we assume a total floor area of 35.0 m² per guest room. Among building plans registered in MLIT’s “Building Dynamics Statistics Survey” whose primary use is hotel alone and where both room count and total floor area are known (N=35, outliers excluded), the median floor area per room is 39.5 m², while limited-service properties of 200 rooms or more cluster at 15–26 m². The 35.0 m² figure is also consistent with the per-room floor area used in our earlier work. On that conversion, 300 m² corresponds to roughly 9 rooms and 2,000 m² to roughly 57 rooms.
| Size band | Properties | Share | Rooms | Room share | Main categories |
|---|---|---|---|---|---|
| Small-scale (under ~9 rooms / under 300 m²) | 1,034 | 69.0% | 2,012 | 5.3% | Rental villas 723, guesthouses 74, cottages 49, machiya 42 |
| Medium-scale (~9–57 rooms / 300–2,000 m²) | 287 | 19.2% | 6,995 | 18.5% | Business hotels 72, hostels 66, resorts 47, ryokan 26 |
| Large-scale (~57 rooms or more / 2,000 m² or more) | 177 | 11.8% | 28,765 | 76.2% | Business hotels 108, resorts 34, city hotels 25 |
| Total | 1,498 | 100% | 37,772 | 100% | N=1,506 properties (tabulated on the 1,498 with known room counts) |
Two things follow from this structure. First, on a room-count basis 76.2% of supply sits in the large-scale band, and that band has been designed to BEI 0.80 since April 2024. What newly changes with the April 2026 increase is the medium band — 287 properties and 6,995 rooms, or 18.5% of rooms. This is the cohort currently rebuilding its business plans.
Second, there is the small-scale band that accounts for 69.0% of properties by count. Its threshold stays at BEI 1.00, but this is precisely the cohort that became subject to the compliance obligation in April 2025. As the composition shows — 723 rental villas, 74 guesthouses, 49 cottages, 42 machiya — many of these are projects where energy calculation was never a step in the design workflow at all. Note that where a building is constructed as a dwelling under the Building Standards Act, there is a procedure to demonstrate energy code compliance using prescriptive standards or housing performance evaluation, which allows the conformity assessment to be omitted. Whether a project is built as non-residential or residential use therefore forks the process — something worth confirming in a small-format business plan.
Cold and hot-humid regions reach the same BEI 0.80 by different design routes
Japan’s energy code climate zones are set at municipality level from 1 to 8, so even for the same hotel use and the same BEI 0.80, the route to compliance varies by region. For hotel use, MLIT’s guide lists, for zone 2 (cold), insulation of walls, roofs and windows, solar shading of windows, right-sizing and efficiency of air conditioning, high-efficiency lighting, and high-efficiency hot water with enhanced pipe insulation; for zone 8 (hot and humid), it lists right-sizing and efficiency of air conditioning, high-efficiency lighting, and high-efficiency hot water. Because cold regions add envelope work and pipe insulation, the spread in construction cost also tends to be wider there.
Overlaying the distribution of 2026 openings on the climate zones shows supply concentrated at both regulatory extremes: Hokkaido, with the most properties at 146, is zone 1, while Okinawa at 88 is zone 8. In the map below, circle size represents the number of 2026 openings and colour represents the energy code climate zone (representative value for the prefecture).
What lands on each room — assessment fees are fixed, additional works are a sensitivity
From here we build up the amount that lands in the business plan. As the construction cost baseline we use e-Stat’s “Building Construction Starts Statistics” for lodging-industry buildings (nationwide, all client types). In 2024 there were 2,836 buildings, 1,756,286 m² of floor area and ¥1.0384 trillion in estimated construction value, giving a unit cost of ¥591,300/m² (¥1.955 million per tsubo). That is 41.1% above the ¥419,200/m² of 2022, in two years. Applied to a 100-room model at 35.0 m² per room (3,500 m² total floor area), construction cost is ¥2.07 billion, or ¥20.70 million per room — almost exactly the ¥20.67 million per room shown in our earlier work.
Next comes the one fixed cost attributable to regulatory compliance itself: the Energy Efficiency Conformity Assessment fee. In the fee schedules published by registered building energy performance assessment bodies, hotels fall under Class III (hotels, hospitals, assembly halls and similar). Under the Model Building Method, a total floor area of 3,000 to under 4,000 m² costs ¥343,750 (tax included) and 1,000 to under 2,000 m² costs ¥275,000 (tax included). Using the Standard Input Method, the same brackets cost ¥577,500 and ¥440,000 respectively.
| Item | A. 100 rooms, 3,500 m² (limited-service, large-scale) | B. 30 rooms, 1,200 m² (small-format, medium-scale) |
|---|---|---|
| Applicable size band | Large-scale (2,000 m² or more) | Medium-scale (300–2,000 m²) |
| BEI standard for hotel use | 0.80 (from April 2024) | 0.80 (from April 2026) |
| Construction cost (¥591,300/m²) | ¥2.070bn | ¥710m |
| Construction cost per room | ¥20.70m | ¥23.65m |
| Conformity assessment fee (Model Building Method, Class III, tax incl.) | ¥343,750 | ¥275,000 |
| Assessment fee per room | ¥3,438 | ¥9,167 |
| (Reference) per room under the Standard Input Method | ¥5,775 | ¥14,667 |
| Additional works at +0.5% | ¥103,000/room | ¥118,000/room |
| Additional works at +1.0% | ¥207,000/room | ¥237,000/room |
| Additional works at +2.0% | ¥414,000/room | ¥473,000/room |
| Additional works at +3.0% | ¥621,000/room | ¥710,000/room |
The assessment fee per room is ¥3,438 for the 100-room model against ¥9,167 for the 30-room model — 2.7 times higher. Because the fee schedule steps with total floor area, this is simply the structure by which fixed costs weigh more heavily on smaller projects. Adopting the Standard Input Method widens the gap further. For a small-format business plan, whether the Model Building Method suffices or the Standard Input Method is required feeds straight through to cost.
For additional construction works, no single actual figure can be drawn from public material. We therefore bound the range with published values and present it as a sensitivity. The basis for the lower bound is that the joint committee concluded the levels are “achievable through measures on the equipment side”, that practitioner hearings found no particular obstacle for new construction, and that the main driver of the air-conditioning difference is a 26–29% reduction in rated heat source capacity. Since smaller capacity pushes equipment costs down, the lower bound can approach zero. The upper bound comes from Ministry of the Environment ZEB material, which puts the construction cost premium for non-residential ZEB Ready (a 50% primary energy reduction level) at roughly 9–18%. The level at issue here is a 20% reduction — less than half the reduction of ZEB Ready. From these two bounds, this article presents a sensitivity band of 0.5–3.0% of construction cost.
The knock-on to required ADR is a few hundred yen a night — worked back across three markets
What does the additional capex come to when converted into the ADR a project has to clear? We use the same reverse calculation as our earlier work: multiply additional capex by the target NOI yield to get the required annual NOI increment, divide by the GOP ratio to convert it into required revenue, divide by 365 days for the required RevPAR increment, then divide by occupancy to obtain the ADR increment. For the GOP ratio we use 38.9%, the actual figure for the 91 MHM-operated properties disclosed by Invincible Investment Corporation (fiscal period ended December 2024), and we set occupancy conservatively at 80%. For reference, the same REIT reported occupancy of 86.3%, ADR of ¥15,100 and RevPAR of approximately ¥13,000 across its 101 domestic hotels in July 2026.
| Additional capex (100-room model) | Per room | Required ADR uplift (4% yield) | Required ADR uplift (5% yield) | Required ADR uplift (6% yield) |
|---|---|---|---|---|
| Construction cost +0.5% | ¥103,000 | ¥36 | ¥46 | ¥55 |
| Construction cost +1.0% | ¥207,000 | ¥73 | ¥91 | ¥109 |
| Construction cost +2.0% | ¥414,000 | ¥146 | ¥182 | ¥219 |
| Construction cost +3.0% | ¥621,000 | ¥219 | ¥273 | ¥328 |
Set that uplift against actual market prices. MetroEngines Research puts the median estimated transacted ADR over the trailing twelve months (September 2025 to August 2026) at approximately ¥14,100 for business hotels in Tokyo (N≈914 properties), ¥10,900 for business hotels in Fukuoka (N≈339 properties) and ¥16,100 for resort hotels in Okinawa (N≈267 properties). The ¥182 uplift required for additional capex of +2.0% of construction cost is just 1.3% of the Tokyo level, 1.7% in Fukuoka and 1.1% in Okinawa. Even at +3.0%, the figures reach only 1.9%, 2.5% and 1.7% respectively.
Translated into a per-night price, the additional burden of regulatory compliance runs from a few tens of yen to the low ¥300s, and stays broadly within 3% of market ADR in all three markets. It is also worth noting the difference in kind: the per-room regulatory costs covered in our earlier work — the minimum wage increase (¥9,600 per room per year) and statutory inspection costs (¥3,400–12,600 per room per year) — are operating expenses that recur every year, whereas energy code compliance is a one-off investment at construction.
The payback route is utility cost — capitalised, the NOI gain exceeds the investment
Everything so far has been about outlays. But BEI 0.80 means design primary energy consumption is 20% below the reference value, so operating-phase utility costs fall as well. Here we quantify that payback.
Ryoken Co., Ltd.’s 2022 operating conditions survey put energy costs (utilities plus fuel) at 11.2% of revenue on average across lodging properties. For room-led business hotels, this article sets the utility cost ratio slightly below that, at 10%. For the Tokyo business-hotel band (ADR approximately ¥14,100) at 80% occupancy (a modelling assumption, full-year) and 365 operating days, room revenue is ¥4.12 million per room per year and utility cost is ¥412,000 per year. Assuming that the five systems within the BEI calculation — air conditioning, ventilation, lighting, hot water and elevators — account for 70% of utility cost, and that a 20% reduction is realised there, the saving is ¥57,600 per room per year.
| Market model | Estimated transacted ADR | Room revenue per room/year | Utility cost per room/year | Saving per room/year | Payback (+2% = ¥414,000) | Capitalised NOI gain (at 5%) |
|---|---|---|---|---|---|---|
| Major city: Tokyo, business | ¥14,098 | ¥4.12m | ¥412,000 | ¥57,600 | 7.2 years | ¥1.153m/room |
| Regional hub: Fukuoka, business | ¥10,910 | ¥3.19m | ¥319,000 | ¥44,600 | 9.3 years | ¥892,000/room |
| Resort: Okinawa, resort | ¥16,058 | ¥4.69m | ¥469,000 | ¥65,600 | 6.3 years | ¥1.313m/room |
Against additional investment of +2.0% of construction cost (¥414,000 per room), simple payback on utility savings alone is 6.3 to 9.3 years — comfortably short relative to a building’s operating life. More important from an investment standpoint is that the annual saving flows straight into NOI. Capitalised at a 5.0% cap rate it is worth ¥892,000 to ¥1.313 million per room, well above the ¥414,000 of additional capex. In asset-value terms measured on NOI, spending on regulatory compliance recovers at least as much as it costs.
There is a second payback route. Energy performance is one of the metrics used to judge eligibility for ESG financing such as green bonds and sustainability-linked loans, so designing to a level that can earn third-party certification such as BELS secures financing headroom. The inducement standard (equivalent to ZEB Ready) is BEI 0.70 for hotel use, only 0.10 points away from the 0.80 compliance obligation. The joint committee’s conclusion also noted “further headroom available through envelope refinements”, leaving room to treat 0.80 as a waypoint rather than a floor.
Days to build into the schedule — 14 for the assessment plus 35 for confirmation is the floor
Alongside cost, the other thing that hits the business plan is the programme. Because energy code compliance is a provision related to the Building Standards Act, no building confirmation certificate is issued and construction cannot start until compliance is confirmed. The review period for the conformity assessment therefore sits directly on the critical path.
For the conformity assessment, the client must submit the energy plan before starting construction and obtain a determination from an assessment body or the competent administrative agency. Where an application is accepted, the body must issue a written determination within 14 days of the date of submission. However, where the submitted energy plan or attached drawings contain omissions or errors such that a longer review is reasonable, the review period may be extended by up to 28 days, subject to issuance of a written notice stating the extension and its grounds.
Building confirmation itself runs, under Article 6 of the Building Standards Act, to within 35 days of acceptance for Category 1 and Category 2 buildings (extendable by up to a further 35 days where there are reasonable grounds), and within 7 days for Category 3 buildings. Medium- and large-scale hotel projects normally fall under Category 1 or 2.
| Step | Standard period | Maximum with extension | Legal basis |
|---|---|---|---|
| Energy Efficiency Conformity Assessment (acceptance to issuance of the conformity certificate) | Within 14 days | +28 days (42 total) | Building Energy Efficiency Act, Article 12 |
| Building confirmation (acceptance to issuance of the certificate; Category 1 and 2 buildings) | Within 35 days | +35 days (70 total) | Building Standards Act, Article 6 |
| Combined (if run sequentially) | 49 days | 112 days | — |
In practice it is usual to run the conformity assessment and the confirmation application in parallel, but any corrections push the timeline toward the extended end. A design that sits right on the threshold invites review comments that trigger recalculation and design changes, which is exactly what stretches these day counts. For business-planning purposes it is more rational, as programme risk management, to set a design value with some margin — 0.78 to 0.79. Given that a construction start slipping by a month slips the opening by a month and wipes out that month’s revenue entirely, margin at the design stage is best read as programme insurance.
Conclusion — the regulatory cost is within reach of pricing, and NOI wins it back
To summarise the analysis. First, the energy standard for hotel use was raised to BEI 0.80 for large-scale buildings in April 2024 and for medium-scale buildings in April 2026, and small-scale buildings came under the compliance obligation in April 2025. In lodging use, essentially only extensions of 10 m² or less fall outside, so every new-build plan should be treated as in scope.
Second, the share of medium-scale hotels already at BEI 0.80 or better is 67.0% (n=947), meaning one third will not clear on their existing design. That said, the specification differences MLIT sets out centre on right-sizing air-conditioning capacity (rated heat source capacity down 26–29%) and LED lighting (power consumption down 42–46%) — levels designed not to presuppose a wholesale rebuild of the envelope.
Third, of the 1,506 properties opening in 2026, the medium band newly affected by the April 2026 increase is 287 properties and 6,995 rooms, or 18.5% on a room basis. The small-scale band that accounts for 69.0% of properties keeps its threshold, but is the cohort that newly came under the compliance obligation in April 2025.
Fourth, on what lands per room: the conformity assessment fee is ¥3,438 for the 100-room model against ¥9,167 for the 30-room model, weighing more heavily on smaller projects, while additional construction works run ¥103,000–710,000 per room on a 0.5–3.0% sensitivity. Worked back into the ADR a project must clear, that is ¥36–328 per night (100-room model, target NOI yield 4–6%; up to ¥375 for the 30-room model), broadly within 3% of market ADR across the three markets.
Fifth, the utility cost saving BEI 0.80 delivers is ¥44,600–65,600 per room per year, so additional investment equivalent to +2.0% of construction cost pays back in 6.3 to 9.3 years. Capitalising that saving at a 5.0% cap rate gives ¥892,000–1,313,000 per room, more than the additional capex. Energy code compliance is less a pure burden on the business plan than a way of pulling NOI design forward to before construction starts.
For the cohort assembling business plans now, the implication is clear. More than the additional capex itself, what matters for investment efficiency is building margin into the design value to contain programme risk, and converting the utility saving into an NOI assumption that can be used as leverage in financing negotiations. In a market where construction costs have risen 41% in two years, the compliance portion is a few percent of construction cost. Getting that order of magnitude right is what separates a precise business plan from an imprecise one.
■ Model assumptions
- Construction cost unit rate: ¥591,300/m² (e-Stat, “Building Construction Starts Statistics”, 2024, lodging-industry use, nationwide, all client types; estimated construction value ÷ total floor area). The latest confirmed annual figure is 2024.
- Model definitions: Model A = 100 rooms, 3,500 m² total floor area (35.0 m² per room); Model B = 30 rooms, 1,200 m² total floor area (40.0 m² per room). Floor area per room is set with reference to the 39.5 m² median for hotel-only projects in the “Building Dynamics Statistics Survey” (N=35, outliers excluded) and the 15–26 m² range for large limited-service projects.
- Size band conversion: assuming 35.0 m² of total floor area per room, 2026 openings are banded with 300 m² = approximately 9 rooms and 2,000 m² = approximately 57 rooms. The actual size band is determined by each project’s total floor area.
- Additional construction works: because no actual unit cost for non-residential buildings exists in public material, presented as a sensitivity of 0.5–3.0% of construction cost. The lower bound rests on the joint committee’s conclusion that the levels are “achievable through measures on the equipment side” and on the fact that right-sizing air-conditioning capacity (down 26–29%) pushes equipment costs down; the upper bound rests on the 9–18% construction cost premium for ZEB Ready (a 50% primary energy reduction level) shown in Ministry of the Environment ZEB material. The level at issue here is a 20% reduction, less than half the reduction of ZEB Ready.
- Required ADR reverse calculation: additional capex × target NOI yield ÷ GOP ratio ÷ 365 days ÷ occupancy. GOP ratio 38.9% (Invincible Investment Corporation, 91 MHM-operated properties, fiscal period ended December 2024), occupancy 80%, target NOI yield 4–6%.
- Utility cost saving: utility cost at 10% of revenue (industry average in Ryoken Co., Ltd., “2022 Operating Conditions Survey”), with the systems in the BEI calculation accounting for 70% of utility cost and a 20% reduction realised there. The capitalisation cap rate is 5.0%.
- Estimated transacted ADR: monthly median for September 2025 to August 2026 from MetroEngines Research. Tokyo business hotels approximately ¥14,100 (N≈914 properties), Fukuoka business hotels approximately ¥10,900 (N≈339 properties), Okinawa resort hotels approximately ¥16,100 (N≈267 properties).
- This analysis is a model case based on published statistics; actual amounts vary with each project’s design conditions, climate zone and use composition. An actual investment decision requires a detailed feasibility study.
Related reading
- Hotel Construction Cost ¥8.7M-71.4M per Room: 3 Tiers, 12 Markets
- Hotel Construction Cost ¥20.67M/Room: 35.0m² Floor Area in 31 Plans
- Hotel Statutory Inspection Costs: ¥3,400–12,600 per Room, NOI Impact
- Can You Build a Hotel in a National Park? Japan’s Rules & 33 Resorts
References and sources
■ Data sources
Published materials from MLIT and METI (administrative notice, simple guide to energy-efficient design, joint committee material), e-Stat “Building Construction Starts Statistics” (lodging-industry use, 2011–2024), published assessment fee schedules of registered building energy performance assessment bodies, disclosure materials from Invincible Investment Corporation, and MetroEngines Research data on 2026 openings (OTA-listing basis, N=1,506 properties) and estimated transacted ADR (monthly median, September 2025 to August 2026).
■ Model assumptions
Construction cost unit rate ¥591,300/m²; total floor area per room of 35.0 m² (100-room model) and 40.0 m² (30-room model); additional works as a sensitivity of 0.5–3.0% of construction cost; GOP ratio 38.9%, occupancy 80% (assumption, full-year), target NOI yield 4–6%; utility cost at 10% of revenue, BEI-covered systems at 70% of utility cost, 20% reduction; cap rate 5.0%. See the model assumptions box at the end of the main text for detail.
■ Limitations and caveats
Size bands are a conversion assuming 35.0 m² of total floor area per room; the actual band is determined by each project’s total floor area. Additional construction works are shown as a sensitivity rather than a point estimate, because no actual unit cost exists in public material. The 67.0% compliance rate reflects the past distribution of designs filed between FY2018 and FY2022 and does not indicate future design levels. Review periods are statutory and exclude pre-application consultation and correction time. Because listings for 2026 openings typically appear several months before opening, counts for the most recent months may rise.
■ Legislation and MLIT publications
- MLIT Housing Bureau, Counsellor for Building Planning, administrative notice “Raising the Energy Efficiency Standard for Medium-Scale Non-Residential Buildings from FY2026 (Notification)” (13 November 2025)
- MLIT, “Simple Guide to Energy-Efficient Design for Medium-Scale Non-Residential Buildings”
- Housing and Building SDGs Promotion Center, “Procedural Manual for the Energy Code Compliance Obligation System under the Building Energy Efficiency Act (April 2025 edition)” (FY2025 MLIT subsidised project)
- MLIT, “Housing: Building Energy Efficiency Act — latest legislation”
- Ministerial Ordinance Partially Amending the Ministerial Ordinance Prescribing Building Energy Consumption Performance Standards (Ordinance No. 2 of 2024, METI and MLIT; promulgated 16 October 2024, in force 1 April 2026)
- Act Partially Amending the Act on the Improvement of Energy Consumption Performance of Buildings and Related Acts to Contribute to the Realisation of a Decarbonised Society (Act No. 68 of 2022)
- Building Standards Act, Article 6 (applications and confirmation for building construction); Building Energy Efficiency Act, Articles 10, 12, 18 and 20
■ METI and Ministry of the Environment
- MLIT–METI joint committee material, “Review of the Energy Efficiency Standard for Medium-Scale Non-Residential Buildings”
- Ministry of the Environment, “ZEB PORTAL” — ZEB adoption targets and roadmap
- Ministry of the Environment and METI, “Manufacture, Import and Export of General-Purpose Fluorescent Lamps Will Be Phased Out by 2027” (February 2024)
■ Statistics and assessment body disclosures
- e-Stat, “Building Construction Starts Statistics”, by use and by client type / number of buildings, floor area and estimated construction value (statistical table ID 0003114490, use “52 lodging industry”)
- MLIT, “Building Dynamics Statistics Survey” (lodging properties planned and under construction)
- Published assessment fee schedule of a registered building energy performance assessment body (effective 1 April 2025, Class III: hotels, hospitals, assembly halls and similar)
■ REIT and industry data
- Invincible Investment Corporation, “Monthly Operating Results, July 2026” (101 domestic hotels)
- Invincible Investment Corporation, portfolio (GOP results for MHM-operated hotels)
- Ryoken Co., Ltd., “2022 Operating Conditions Survey” (utility cost as a share of revenue for lodging properties)
- MetroEngines Research & Consulting — estimated transacted ADR and 2026 opening data (OTA-listing basis)