

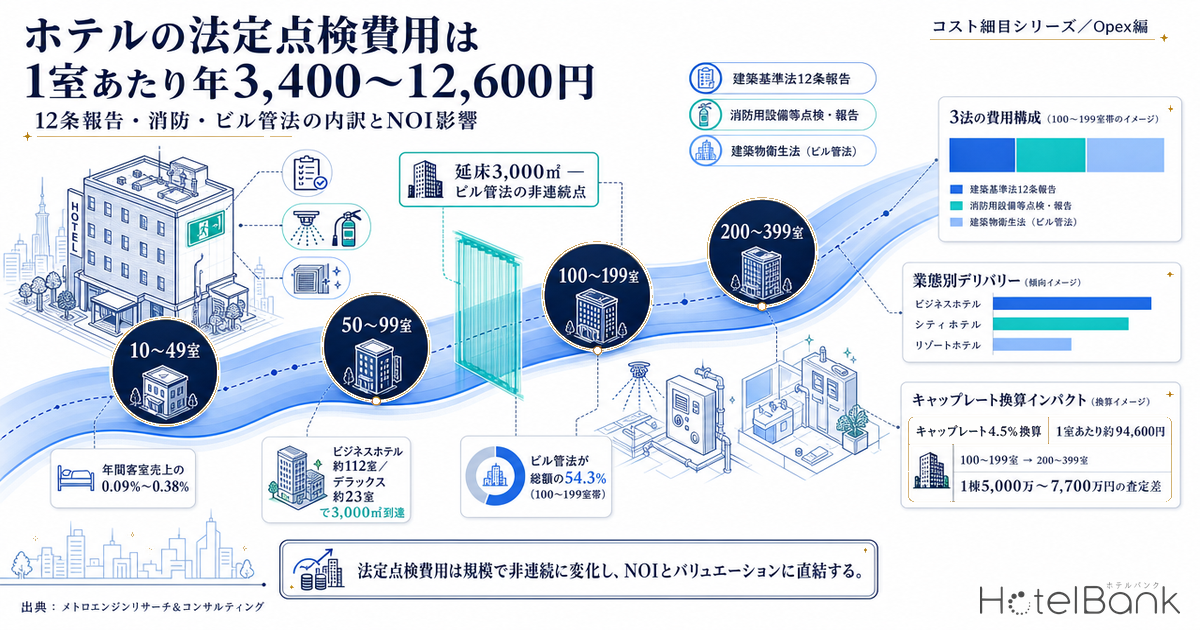
Among a hotel’s operating expenses there is a line item that recurs every single year without ever becoming a candidate for cost negotiation: periodic reporting under Article 12 of the Building Standards Act, inspection and reporting of fire-fighting equipment under the Fire Service Act, and sanitation management as a designated building under the Building Sanitation Act (commonly called the Building Management Act). For none of these does the law offer a “do not perform it” option. They are, in effect, the fixed cost of keeping a property legally operable. This article estimates how much this statutory inspection and reporting Opex adds per room per year by property scale, and quantifies how it flows through to NOI and — via cap rate conversion — to asset value.
Metric Definitions Used in This Article
- ADR (average daily rate): an estimated settled rate (tax-excluded equivalent) calculated by applying a category-specific adjustment coefficient to the lowest published plan level each property lists on OTAs and similar channels (double occupancy, per-room rate, tax included). Cross-checked against property-level results disclosed by listed hotel REITs (91 properties, most recent 3 months), the median error is approximately 7%. These are estimates and differ from each property’s actual transacted rates and accounting figures. In this article we take, for each room-count band, the monthly medians of the covered properties over the most recent 12 months (September 2025 to August 2026) and summarize them again as a median.
- OCC (occupancy rate): the room-count-band OCC figures in this article are medians, by band, of property-level results that five listed hotel REITs disclosed monthly (June to July 2026). They are not any single REIT’s published portfolio-wide figure.
- RevPAR: room revenue per available room per night, calculated as the ADR above multiplied by OCC. Annual room revenue is simplified as RevPAR × 365 days.
- Statutory inspection and reporting cost: the annual cost of outsourcing Article 12 reporting under the Building Standards Act, fire-fighting equipment inspection and reporting, and sanitation management work under the Building Sanitation Act. These are estimates built from published rate tables and market-rate materials, and differ from actual quotations (assumptions are set out at the end of this article). Amounts are stated tax-included.
- Data sources: MetroEngines Research & Consulting / monthly operating disclosures from individual REITs / various published rate materials
- — ¥3,400 to ¥12,600 per room per year. Combining the three regimes — Article 12 reporting under the Building Standards Act, fire-fighting equipment inspection, and the Building Sanitation Act — statutory inspection and reporting costs equal 0.09% to 0.38% of annual room revenue.
- — 3,000 m² of total floor area is a discontinuity. The moment a building qualifies as a designated building under the Building Sanitation Act, a cost category that did not previously exist appears and accounts for 45.6% to 54.3% of the total. It does not phase in gradually.
- — The room count at which that threshold is reached differs roughly fivefold by category. A business hotel needs about 112 rooms to reach 3,000 m²; city hotels and ryokan about 30; deluxe properties about 23. Judging the burden by room count alone leads you astray.
- — Differences in inspection cycles between administrative agencies alone move the annual figure by about 1.5x. Tokyo requires the periodic investigation of designated buildings every year for large hotels and ryokan; many other designated administrative agencies require it once every three years.
- — ¥10,000 per room per year equals ¥220,000 in asset value (at a 4.5% cap rate). This is the common conversion factor for pricing a permanent Opex item into an appraisal; for the 533-room model it translates into a ¥50–77 million difference per property.
Where This Article Sits in the Cost-Line Series — Opex for “Inspect and Report,” Not Capex
This article continues HotelBank’s series on individual hotel cost lines. It is worth drawing the boundary against earlier installments first.
First, our earlier analyses of hotel capital expenditure — capex of ¥130,000 to ¥620,000 per room per year read from the IR disclosures of five REITs, and the finding that lodging-industry capital investment runs at 1.51 times depreciation — both dealt with Capex (renewal investment). This article addresses Opex instead, and specifically only the cost of the act of inspecting, recording, and reporting to the authorities. It does not extend to the cost of the repairs that inspection may reveal to be necessary. If a fire door is flagged for failing to close properly and is replaced, that is Capex or a repair expense, and falls outside this article’s scope.
Second, this cost line differs in kind from the others we have covered: the 2.1x gap in hotel water and sewer charges between municipalities, the 2.6x municipal gap in waste disposal fees, dispatch rates for room cleaning, fire insurance and flood risk zoning, and property tax at ¥160,000 to ¥240,000 per room per year. Water and sewer, waste, and cleaning behave as variable costs tied to occupancy; fire insurance and property tax attach to ownership itself. Statutory inspection and reporting costs, by contrast, are almost entirely insensitive to both occupancy and room rate, and are determined only by the size of the building and how the regulatory regime is administered where it stands. In the sense that they do not fall by a single yen when occupancy drops, they resemble property tax — but they are two orders of magnitude smaller.
That is precisely why they get dropped in appraisals. Rolling “inspection costs” into a single line when building up post-acquisition Opex means missing the discontinuity described below entirely.
The Three Pillars of Statutory Inspection and Reporting — What Is Required, and How Often
The statutory inspections and reports imposed on lodging facilities divide into three regimes by governing law. Each has its own coverage criteria, frequency, and reporting authority, and each carries separately defined penalties for failure to report.
| Regime | Item | Coverage criteria (for lodging facilities) | Inspection / reporting frequency |
|---|---|---|---|
| Building Standards Act Article 12 reporting |
Periodic investigation of designated buildings | Hotel and ryokan use. In Tokyo, three storeys or more and over 2,000 m² | Annually or once every three years, depending on the designated administrative agency |
| Periodic inspection of building equipment | Ventilation, smoke exhaust, emergency lighting, and water supply and drainage equipment | Annually | |
| Periodic inspection of fire-prevention equipment | Fire doors, fire shutters, fire-resistant cloth screens and similar | At intervals of roughly six months to one year | |
| Periodic inspection of elevators and similar equipment | Elevators, escalators, and dumbwaiters | Annually | |
| Fire Service Act Article 17-3-3 |
Equipment inspection | Hotels and ryokan are designated fire-defense properties. Above 1,000 m², inspection by a licensed professional is mandatory | Once every six months |
| Comprehensive inspection and reporting | As above. Reported to the chief of the competent fire department or fire station | Inspection once a year, reporting once a year | |
| Building Sanitation Act (Building Management Act) |
Air environment measurement | Buildings in which the floor area of designated uses (including ryokan) totals 3,000 m² or more. Below 3,000 m², none of these items applies | Once every two months or less (six times a year) |
| Water storage tank cleaning | Once a year or less (designated buildings receive guidance to do it twice a year) | ||
| Drinking water quality testing | Eleven non-omissible items every six months or less; twelve disinfection by-product items once a year between June and September | ||
| Drainage equipment and drainage tank cleaning | Tokyo guidance requires drainage tanks to be cleaned once every four months or less (three times a year) | ||
| Rodent and insect control | Infestation surveys once every two months or less (Tokyo guidance calls for at least monthly) | ||
| Appointment of a Building Environmental Sanitation Manager | Year-round (since April 2022, one manager may cover multiple properties if conditions are met) |
Source: compiled from MLIT, “Periodic Reporting System under the Building Standards Act”; Tokyo Fire Department, “Fire-Fighting Equipment Inspection and Reporting System”; and Tokyo Metropolitan Institute of Public Health, “Sanitation Management Standards for Designated Buildings”
The first thing to note in this list is that the three regimes run independently of one another. Whether a property falls under Article 12 reporting, whether it falls under fire-fighting equipment inspection and reporting, and whether it counts as a designated building under the Building Sanitation Act are each judged against a separate threshold. It is perfectly ordinary for a property to end up in the combination “Article 12 once every three years, but Building Sanitation Act obligations running every month.”
A second point matters even more in practice: the frequency of the periodic investigation of designated buildings differs by designated administrative agency. Tokyo requires annual investigation and reporting for theatres, underground malls, large hotels and the like, and hotels and ryokan of three storeys or more and over 2,000 m² fall into the annual-reporting classification. Across many other designated administrative agencies, a three-year cycle is the norm for hotels and ryokan. For two properties of identical scale and specification, the annual investigation cost can differ threefold purely by location. For an owner holding several buildings, this is the leading cause of Opex differences between them. The same structure — local regulatory practice driving both cost and building specification — appears in parking-space obligations for hotels, where the required number of spaces varies by up to 2.5x between cities.
¥3,400 to ¥12,600 per Room per Year — Estimates by Room-Count Band
The skeleton of the estimate is simple. Because most of the statutory inspection and reporting cost is driven by total floor area, we set a standard total floor area for each room-count band, apply published rate tables to build up an annual figure, and finally divide by room count.
The total floor areas used as the basis come from actual values for the 787 properties with a recorded total floor area in our domestic lodging facility master. Median total floor area per room by category is 26.7 m² for business hotels (N=469), 99.8 m² for city hotels (N=159), 83.8 m² for resorts (N=54), 100.0 m² for ryokan (N=29), and 129.0 m² for deluxe properties (N=46). Median total floor area by room-count band is 2,110 m² for 10-49 rooms (N=50), 2,794 m² for 50-99 rooms (N=86), 4,209 m² for 100-199 rooms (N=321), 9,300 m² for 200-399 rooms (N=245), and 45,621 m² for 400 rooms and above (N=85).
Unit rates were set as two cases, low and high, from published inspection-agency price lists and industry materials. The low case assumes a designated administrative agency on a three-year cycle for the periodic investigation of designated buildings together with a lower-priced provider; the high case assumes an annual-reporting agency and a major inspection firm. The results are as follows.
| Room-count band | Assumed rooms |
Assumed floor area |
Article 12 reporting |
Fire | Building Sanitation Act |
Annual total per property |
Annual per room |
|---|---|---|---|---|---|---|---|
| High case (annual-reporting agency, higher unit rates) | |||||||
| 10-49 rooms | 30 | 2,110 m² | 290,100 | 87,155 | Not applicable | 377,255 | 12,575 |
| 50-99 rooms | 79 | 2,794 m² | 296,700 | 100,292 | Not applicable | 396,992 | 5,025 |
| 100-199 rooms | 149 | 4,209 m² | 409,700 | 123,095 | 634,000 | 1,166,795 | 7,831 |
| 200-399 rooms | 249 | 9,300 m² | 597,629 | 182,975 | 914,000 | 1,694,604 | 6,806 |
| 400+ rooms | 533 | 45,621 m² | 1,482,993 | 405,260 | 1,584,000 | 3,472,253 | 6,515 |
| Low case (three-year-cycle agency, lower unit rates) | |||||||
| 10-49 rooms | 30 | 2,110 m² | 198,583 | 58,103 | Not applicable | 256,687 | 8,556 |
| 50-99 rooms | 79 | 2,794 m² | 204,083 | 66,861 | Not applicable | 270,944 | 3,430 |
| 100-199 rooms | 149 | 4,209 m² | 233,083 | 82,063 | 436,000 | 751,147 | 5,041 |
| 200-399 rooms | 249 | 9,300 m² | 353,750 | 121,984 | 636,000 | 1,111,734 | 4,465 |
| 400+ rooms | 533 | 45,621 m² | 877,883 | 270,173 | 1,098,000 | 2,246,057 | 4,214 |
Amounts in yen, tax included. Total floor areas are observed medians from our lodging facility master (N=787 properties). Unit rates are estimates based on published price lists.
Source: MetroEngines Research & Consulting (total floor area, N=787 properties) / compiled from various published rate materials
The annual per-room figure falls within a range of ¥3,400 to ¥12,600. Even within the same room-count band, the low and high cases differ by roughly 1.5x, and that gap arises purely from how the regulatory regime is administered locally and the unit rates of the provider engaged — not from the specification of the building.
What deserves attention is that the burden does not decline monotonically with room count. It is heaviest at 10-49 rooms (¥12,600 in the high case), reaches its lightest point at 50-99 rooms (¥5,000), then jumps back up at 100-199 rooms (¥7,800). Beyond that, economies of scale take hold and it eases gradually. The shape is a U followed by a cliff.
Source: MetroEngines Research & Consulting (high case, estimated)
Why 10-49 rooms is heavy is easy to see. Article 12 reporting and fire inspection each carry a fixed component per building, and that is divided across 30 rooms. In this band, Article 12 reporting accounts for 76.9% of statutory inspection costs and fire for 23.1%.
The rebound at 100-199 rooms is what needs explaining. In that band, the Building Sanitation Act accounts for 54.3% of the total — 53.9% at 200-399 rooms and 45.6% at 400 rooms and above. In other words, the instant total floor area passes 3,000 m², a cost category that did not previously exist stands up to account for half the total. The roughly ¥2,800 increase in per-room burden from the 50-99 band to the 100-199 band is explained by netting the Building Sanitation Act addition (about ¥4,300 per room) against the dilution of fixed costs that comes with greater scale.
Measured against room revenue, statutory inspection costs amount to only 0.09% to 0.38% of annual room revenue. Set against the capital expenditure covered earlier in this series (¥130,000 to ¥620,000 per room per year), they are 2.6% to 9.7% of even the lower bound. In absolute terms, they are small. But they arise reliably every year, they do not shrink when occupancy falls, and — as the next section shows — dividing by a cap rate changes the order of magnitude.
The 3,000 m² Discontinuity — The Room Count at Which It Bites Differs Fivefold by Category
A designated building under the Building Sanitation Act is defined as one in which the floor area of designated uses, ryokan included, totals 3,000 m² or more. At 2,999 m², none of it applies as a legal obligation: no air environment measurement, no water storage tank cleaning, no water quality testing, no drainage tank cleaning, no pest control, no appointment of a Building Environmental Sanitation Manager. At 3,001 m², all of it starts at once. It is not a gradual increase but a step up.
What matters here is floor-area efficiency by category. In the observed values from our master, business hotels are the most efficient at 26.7 m² per room (N=469), while deluxe properties require 129.0 m² per room (N=46) — roughly 4.8 times as much. The same 3,000 m² therefore accommodates entirely different numbers of rooms. On how floor area per room governs construction cost and asset price, our earlier analysis works back from a planning standard of 35.0 m² per room across 31 development projects to a construction cost of ¥20.67 million per room.
Source: MetroEngines Research & Consulting (calculated from category medians across the 787 properties with recorded total floor area)
Working backwards produces the following. A business hotel only reaches 3,000 m² at about 112 rooms. City hotels and ryokan get there at about 30 rooms, resorts at about 36, and deluxe properties at about 23.
The practical implication of that gap is considerable. The intuition that “it is a small property, so the statutory sanitation obligations are light” does not hold for certain categories. A 25-room deluxe hotel or a 30-room ryokan may well carry heavier sanitation obligations, on the floor-area test, than a 100-room business hotel. When building up Opex in an acquisition appraisal, disposing of the question by room count alone — “it is small, so the Building Sanitation Act is irrelevant” — is risky. What needs checking is not the room count but the total floor area on the building confirmation.
Looking at the properties in our master with a recorded total floor area by room-count band, the share at 3,000 m² or above is 34.0% for 10-49 rooms (N=50), 47.7% for 50-99 rooms (N=86), 74.8% for 100-199 rooms (N=321), 98.8% for 200-399 rooms (N=245), and 100% for 400 rooms and above (N=85). About half of the 50-99 room band, and a third even of the 10-49 room band, are already covered by the Building Sanitation Act. Note that properties with a recorded total floor area skew relatively large, so these shares are likely overstated and should be read with that discount.
The 112-room threshold for business hotels sits in a position that overlaps with the industry’s actual room-size composition. Of the 14,491 operating lodging facilities and 1,138,460 rooms we track domestically, the 100-199 room band forms the largest volume zone at 18.1% of properties and 32.3% of rooms.
Source: MetroEngines Research & Consulting (14,491 operating properties, 1,138,460 rooms; 10 rooms or more, hotel/ryokan categories)
It is worth stating up front what this step is worth in asset value. For the 149-room, 4,209 m² model, the Building Sanitation Act stack runs ¥634,000 a year, or about ¥4,300 per room. Divided by a 4.5% cap rate, that equates to roughly ¥14.1 million per property, or about ¥94,600 per room, in asset value. When acquiring a hotel of more than 100 rooms, whether or not this line is built into annual costs produces a difference in the appraisal on the order of ¥10 million.
The Revenue Base — Prevailing ADR, OCC and RevPAR by Scale
To translate statutory inspection costs into NOI, the revenue level that forms the denominator has to be pinned to prevailing market data. ADR is taken from our estimated settled ADR, at the level of the most recent 12 months (September 2025 to August 2026) by room-count band, covering 1,120 properties in the hotel and ryokan categories. OCC is the median by room-count band of property-level results that five listed hotel REITs disclosed monthly (June to July 2026, N=166 properties).
| Room-count band | Estimated settled ADR (tax-excluded equivalent) |
OCC (median, REIT property-level) |
RevPAR | Annual room revenue (per room) |
Statutory inspection cost as share of revenue |
|---|---|---|---|---|---|
| 10-49 rooms (N=220 / 19 properties) | ¥11,215 | 80.8% | ¥9,062 | ¥3,307,528 | 0.26-0.38% |
| 50-99 rooms (N=247 / 53 properties) | ¥8,010 | 84.3% | ¥6,752 | ¥2,464,637 | 0.14-0.20% |
| 100-199 rooms (N=252 / 54 properties) | ¥8,688 | 89.0% | ¥7,732 | ¥2,822,297 | 0.18-0.28% |
| 200-399 rooms (N=255 / 30 properties) | ¥10,845 | 84.2% | ¥9,131 | ¥3,332,994 | 0.13-0.20% |
| 400+ rooms (N=146 / 10 properties) | ¥15,758 | 80.3% | ¥12,654 | ¥4,618,591 | 0.09-0.14% |
ADR is our estimated settled ADR (tax-excluded equivalent), with monthly medians over the most recent 12 months taken as a median by band (1,120 properties in total). OCC is the median by band of property-level monthly disclosures from five listed hotel REITs (June to July 2026, 166 properties in total) and is not any single REIT’s published portfolio-wide figure.
Source: MetroEngines Research & Consulting / compiled by MetroEngines Research & Consulting from monthly REIT operating data
For context on the wider market: Invincible Investment Corporation reported OCC of 86.3%, ADR of ¥15,100 and RevPAR of ¥13,039 across 101 domestic hotels for July 2026 (year on year: OCC +1.9pt, ADR -1.0%, RevPAR +1.2%). Ichigo Hotel REIT Investment Corporation reported portfolio-wide OCC of 84.4% as of July 2026, with ADR of ¥9,684 and RevPAR of ¥8,175. Japan Hotel REIT Investment Corporation reported OCC of 83.1% as of July 2026 across the 29 hotels with variable rent and similar structures, with ADR of ¥21,806 and RevPAR of ¥18,119. The band-level OCC figures in the table above are broadly consistent with these published values.
Judged by revenue share alone, statutory inspection is a small line: from the low ¥0.1% range to just under 0.4%. A ¥100 move in ADR absorbs it. In an appraisal, however, that way of looking at it produces errors.
Cap Rate Conversion — ¥10,000 per Room per Year Moves ¥220,000 of Asset Value
Under the income capitalization approach, a change in permanent Opex is a change in NOI, and it moves asset value by the amount produced when divided by the cap rate. A line item that looks trivial in a single year gains an order of magnitude once multiplied by the inverse of the capitalization yield (about 22.2x at 4.5%).
The table below sets out how much asset value per room moves when annual cost per room moves.
| Annual cost difference per room | Cap rate 4.0% | 4.5% | 5.0% | 5.5% |
|---|---|---|---|---|
| ¥3,000 | ¥75,000 | ¥66,667 | ¥60,000 | ¥54,545 |
| ¥5,000 | ¥125,000 | ¥111,111 | ¥100,000 | ¥90,909 |
| ¥10,000 | ¥250,000 | ¥222,222 | ¥200,000 | ¥181,818 |
| ¥15,000 | ¥375,000 | ¥333,333 | ¥300,000 | ¥272,727 |
| ¥20,000 | ¥500,000 | ¥444,444 | ¥400,000 | ¥363,636 |
Asset value difference = annual cost difference per room ÷ cap rate. Source: compiled by MetroEngines Research & Consulting
Source: compiled by MetroEngines Research & Consulting (simple conversion via the income capitalization approach)
Applying this to our estimates: converting the high-case statutory inspection cost straight into asset value at a 4.5% cap rate gives about ¥279,400 per room for the 10-49 band, about ¥111,700 for 50-99, about ¥174,000 for 100-199, about ¥151,200 for 200-399, and about ¥144,800 for 400 and above.
It is worth looking at this per property as well. Including the swing from the low case to the high case, the asset-value impact at a 4.5% cap rate is ¥5.7-8.4 million for the 30-room model, ¥6.0-8.8 million for the 79-room model, ¥16.7-25.9 million for the 149-room model, ¥24.7-37.7 million for the 249-room model, and ¥49.9-77.2 million for the 533-room model. For large properties, statutory inspection costs alone can produce an appraisal difference on the order of ¥70 million.
What deserves emphasis is that most of this swing arises from how the assumptions are set, not from the quality of the property. For the same building, viewing the periodic investigation of designated buildings on a three-year cycle versus annually, or setting inspection unit rates at major-firm levels versus local levels, moves NOI by hundreds of thousands of yen a year. Rounding inspection costs to “roughly ¥500,000 a year” early in an acquisition review leaves a gap against the actual figure of up to about ¥670,000 a year in the 149-room model — about ¥14.8 million once converted to asset value.
Issues for Multi-Property Owners — Room for Bundled Procurement, and Cycle Differences Between Buildings
As the number of buildings grows, two structural opportunities open up in this cost line.
The first is room to negotiate unit rates. For inspection agencies and facility management firms, statutory inspection and reporting work carries heavy travel and set-up costs. Ordering across several buildings at once allows report preparation to be standardized, licensed staff to be levelled across the schedule, and the annual calendar to be designed as a whole — which creates room to bring unit rates down. Per-unit rates for elevators, per-leaf rates for fire doors, and per-visit rates for air environment measurement are all quantity-based build-ups, and quantity is exactly what lets you step down the rate table.
Assume a portfolio of ten of the 149-room, 4,209 m² model (about ¥1.17 million a year per property in the high case). A 10% reduction in unit rates saves about ¥1.17 million a year in total, or about ¥800 per room. At a 4.5% cap rate that amounts to roughly ¥26 million of asset value created. At 15% it is about ¥1.75 million a year and about ¥39 million of asset value; at 20%, about ¥2.33 million a year and about ¥52 million.
| Unit-rate reduction from bundled procurement | Annual savings (ten properties) |
Annual savings per room |
Asset value at a 4.5% cap rate |
|---|---|---|---|
| 10% | approx. ¥1.17mn | approx. ¥800 | approx. ¥26mn |
| 15% | approx. ¥1.75mn | approx. ¥1,200 | approx. ¥39mn |
| 20% | approx. ¥2.33mn | approx. ¥1,600 | approx. ¥52mn |
Based on ten properties of the 149-room, 4,209 m² model (high case, ¥1,166,795 per property per year). Source: compiled by MetroEngines Research & Consulting
The second is concurrent appointment of the Building Environmental Sanitation Manager. Since April 2022, the Ministry of Health, Labour and Welfare has revised its treatment so that a single manager may oversee multiple designated buildings at the same time, provided the building owner has confirmed that this will not impede proper performance of the work. Where several nearby buildings are held that fall under the Building Sanitation Act, this concurrent appointment can change the cost structure of the role itself. Our estimates place the manager appointment cost at ¥180,000 to ¥600,000 a year in the high case, and where the property layout allows concurrent appointment, this is where the largest compression is available.
On top of that, a multi-property portfolio faces an operational issue: regulatory cycles do not line up across buildings. Properties in Tokyo face the periodic investigation of designated buildings every year, while properties under other designated administrative agencies face it once every three years — so reporting cycles are mixed even within a single company’s holdings. When several buildings “spike only once every three years,” annual Opex waves irregularly across budget years. Across a portfolio, deliberately staggering the investigation years of buildings on different cycles makes it possible to smooth cash flow between years.
The same point applies at the acquisition stage. Checking which designated administrative agency has jurisdiction over a target’s location, and when the most recent periodic report was filed, tells you whether an investigation year lands in the first year of ownership. A property whose three-year investigation year coincides with year one will see Opex spike in that year alone. It is worth capturing as a due diligence item. On the broader theme of local regulation moving post-acquisition returns, our analysis of accelerated depreciation of 48% and three-year property tax exemptions in depopulated, island and peninsula areas covers the regional differences in tax incentives.
Conclusion — Three Numbers to Hold On To in an Appraisal
The cost of the inspections and reports required to keep a property legally operable is ¥3,400 to ¥12,600 per room per year. At 0.09% to 0.38% of annual room revenue, it is small in absolute terms. Divided by a 4.5% cap rate, however, it equates to ¥76,000 to ¥280,000 of asset value per room, and for the 533-room model it produces an appraisal difference of ¥50-77 million on a single property.
Three numbers are worth holding on to in practice.
First, 3,000 m² of total floor area. Whether or not a building qualifies as a designated building under the Building Sanitation Act changes total statutory inspection costs by roughly 1.8x to 2.2x. Where it does qualify, Building Sanitation Act items alone account for 45.6% to 54.3% of the total. The test is total floor area, not room count, and the threshold is reached at about 112 rooms for a business hotel, about 30 for a city hotel or ryokan, and about 23 for a deluxe property. Because the threshold differs by nearly fivefold across categories, inference from room count does not hold.
Second, the cycle difference between designated administrative agencies. Tokyo requires the periodic investigation of designated buildings every year for large hotels and ryokan; many other designated administrative agencies require it once every three years. For the same building, that assumption alone moves the annual per-room figure by about 1.5x, which in the 149-room model is a difference of about ¥9.2 million once converted to asset value.
Third, the conversion factor ¥10,000 per room per year equals ¥220,000 of asset value (at a 4.5% cap rate). It serves as a common yardstick for pricing any permanent Opex item into an appraisal, not just statutory inspection. The smaller the line item, the more it takes this multiplier to bring it into view at the order of magnitude a decision actually requires.
This is not a line item to compete on cutting. Not performing the work is not a legal option, and failure to report is subject to a fine of up to ¥300,000 or detention under Article 44 of the Fire Service Act. Even so, room for design remains: how unit rates are set, how orders are bundled, whether managers hold concurrent appointments, and how investigation years are staggered. The defining feature of this line is that design decisions worth hundreds of thousands of yen a year come back, under income capitalization, as value in the tens of millions.
Assumptions and Limitations of the Estimates
- All statutory inspection and reporting costs in this article are estimates. Actual quotations vary widely with the building’s number of storeys, structure, equipment specification, location, and the provider engaged. Always obtain actual quotations when applying this to an individual property appraisal.
- Total floor area assumptions: observed medians from the 787 properties in our lodging facility master with a recorded total floor area (10 rooms or more; total floor area divided by room count between 10 and 300 m²). Properties with a recorded total floor area skew relatively large, so band-level medians may be overstated.
- Unit rate assumptions: the hotel and ryokan classifications of published price lists were used for the periodic investigation of designated buildings and the periodic inspection of building equipment. Above 5,000 m², figures are extrapolated as area to the power of 0.52 using an observed case (¥235,000 excluding tax for the periodic inspection of building equipment at a hotel of 18,140 m²). The periodic inspection of fire-prevention equipment is built up from a base fee plus per-leaf rates for fire doors and similar (assuming one location per 300 m² or 400 m² of floor area), with declining unit rates applied above 50 locations. Elevators are assumed at one unit per 80 guest rooms.
- Frequency assumptions: the high case treats the periodic investigation of designated buildings as annual and the low case as once every three years, apportioned to an annual figure. Building Sanitation Act items are counted as air environment measurement six times a year, water storage tank cleaning twice, water quality testing three times, drainage tank cleaning three times, and pest control six times. Actual frequencies vary with the guidance of the designated administrative agency and public health centre.
- Items out of scope: maintenance contracts for elevators, air conditioning, substation equipment and the like; repair and renewal costs arising from inspection findings; fire equipment refurbishment; and voluntary inspection and BCP-related costs are excluded. These are treated as Capex or as separate cost lines.
- Tax basis difference: costs are tax-included while ADR is a tax-excluded equivalent, so revenue shares are marginally overstated. Read them as approximations intended to convey direction.
- Status of the OCC figures: OCC by room-count band is the median of property-level results disclosed by five listed hotel REITs (June to July 2026, 166 properties), so the population is limited to REIT-held properties. It does not represent all lodging facilities nationwide.
- Regulatory revisions: the periodic reporting system was revised with effect from July 1, 2025. Confirm the latest coverage criteria and reporting timing with the competent designated administrative agency.
Also Read
- Hotel Water & Sewer Costs Vary 2.1x by Municipality: ¥7.85mn NOI Gap
- Hotel Acquisition Costs 7.1%: A 6.5% Gross Yield Becomes 4.65% Net
References and Sources
■ Data sources
Our lodging facility master (787 properties with a recorded total floor area; 14,491 operating properties and 1,138,460 rooms), estimated settled ADR (1,120 hotel and ryokan properties, most recent 12 months), property-level monthly operating results disclosed by five listed hotel REITs (June to July 2026, 166 properties in total), and regulatory materials from MLIT, the Tokyo Metropolitan Government, the Tokyo Fire Department and the Ministry of Health, Labour and Welfare together with published price lists from inspection agencies.
■ Estimation assumptions
An observed median total floor area was set for each room-count band; two cases were built up from published rate tables — a high case (annual periodic investigation of designated buildings, higher unit rates) and a low case (three-year cycle, lower unit rates) — and divided by room count to give the annual figure per room. Above 5,000 m², figures are extrapolated as area to the power of 0.52 based on observed cases. Asset value conversion is a simple application of the income capitalization approach (annual amount divided by cap rate), with cap rates of 4.0% to 5.5% shown side by side.
■ Limitations and caveats
All amounts are estimates, and actual quotations vary with the number of storeys, structure, equipment specification, location and provider. Properties with a recorded total floor area skew relatively large, so band-level medians may be overstated. Costs are tax-included while ADR is a tax-excluded equivalent, so revenue shares are marginally overstated. The OCC population is limited to REIT-held properties and does not represent all lodging facilities nationwide. Maintenance contracts for elevators, air conditioning and similar, and repair and renewal costs arising from inspection findings, are out of scope. The periodic reporting system was revised with effect from July 1, 2025, and the latest coverage criteria should be confirmed with the competent designated administrative agency.
■ Market data
- MetroEngines Research & Consulting — estimated settled ADR (by room-count band, 1,120 properties), total floor area in the lodging facility master (787 properties), and room-count distribution (14,491 properties, 1,138,460 rooms)
■ Laws and administrative materials
- Ministry of Land, Infrastructure, Transport and Tourism, “On the Periodic Reporting System under the Building Standards Act”
- Tokyo Metropolitan Government Bureau of Urban Development, “List of Buildings and Building Equipment Subject to Periodic Reporting and Reporting Timing”
- Tokyo Fire Department, “Fire-Fighting Equipment Inspection and Reporting System (Fire Service Act, Article 17-3-3)”
- Tokyo Metropolitan Institute of Public Health, “Sanitation Management Standards for Designated Buildings”
- Ministry of Health, Labour and Welfare, “On Building Environmental Sanitation Managers”
- Osaka Prefecture, “On Designated Buildings”
■ Unit rate and market-rate materials
- Bureau Veritas Japan, “Periodic Investigation of Designated Buildings: Costs and Price List”
- Bureau Veritas Japan, “Periodic Inspection of Building Equipment: Costs and Price List”
- Bureau Veritas Japan, “Tokyo Periodic Reporting (Article 12 Inspection): Covered Buildings, Reporting Timing and Process”
- Bousaiya, “What Is Covered by the Periodic Investigation of Designated Buildings? Market Rates Too”
- Zenkoku Shobo Tenken.com, “Fire Equipment Inspection for Hotels, Ryokan and Other Lodging Facilities”
- Towa Sogo Service, “How Much Does the Periodic Inspection of Building Equipment Cost? Four Quotation Examples”
- Towa Sogo Service, “What Does the Periodic Inspection of Fire-Prevention Equipment Cost? Market Rates and Four Points for Choosing a Good Provider”
- Re-Products, “What Is Air Environment Measurement? Required Items, Methods and Costs”
- Towa Sogo Service, “The Basics of Water Storage Tank Cleaning: What Should Managers Do, When, and at What Cost?”
■ REIT monthly disclosures
- Invincible Investment Corporation, “Monthly Operating Status for July 2026”
- Ichigo Hotel REIT Investment Corporation, “Monthly Operating Status for July 2026”
- Japan Hotel REIT Investment Corporation, “Monthly Operating Status”
- Listed hotel REITs referenced in this article: Ichigo Hotel REIT Investment Corporation (3463), Invincible Investment Corporation (8963), Nippon Hotel & Residential Investment Corporation (3472), Japan Hotel REIT Investment Corporation (8985), Hoshino Resorts REIT (3287), Mori Trust REIT Investment Corporation (8961), and Kasumigaseki Hotel REIT Investment Corporation (401A)