

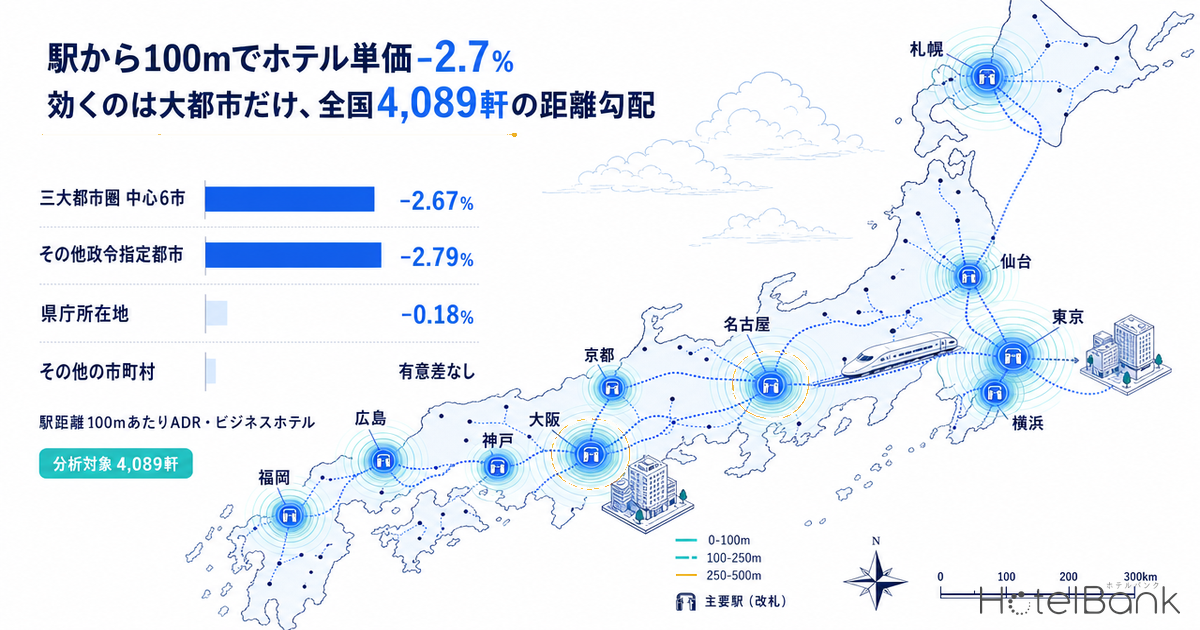
The closer a hotel is to a station, the higher its room rate — the industry treats this as self-evident, yet almost no one has quantified it at national scale. Trade-area reports that zoom in on individual stations are plentiful, but no one has measured a gradient that uses distance band itself as the axis, stratifies by city size, and controls for hotel type. This article uses 1,221 major stations across Japan as reference points, assigns 7,960 lodging facilities to distance bands, and derives the “price of station distance” from the estimated settled ADR of 4,089 business hotels and 754 city hotels. Using the same distance bands, we also aggregate 4,576 commercial-land price points from the official land price survey (Chika Koji) and test whether the land-price premium near stations can be recovered through room rates.
Metric Definitions Used in This Article
- ADR (Average Daily Rate): An estimated settled rate (tax-excluded equivalent), calculated by applying a hotel-type-specific adjustment factor to the lowest published plan price on OTAs and other channels (per room, 2 guests, tax-included). Cross-checked against property-level results disclosed by listed hotel REITs (91 properties, most recent 3 months), the median error is about 7%. These are estimates and differ from each property’s actual settled prices and accounting figures. ADR by distance band or area is the median of the facilities in scope (the level of a typical facility in that segment).
- Period: The three months of June, July and August 2026. All months are calculated on a closed historical basis; forward months with a different estimation basis are not mixed in.
- Station distance: Straight-line distance from each facility to its nearest “target station.” Each facility is assigned only to its single nearest station, with no double counting across overlapping station areas.
- Data sources: MetroEngines Research & Consulting (lodging prices); Ministry of Land, Infrastructure, Transport and Tourism (MLIT) Real Estate Information Library (station ridership and official land prices)
- — Business hotels’ estimated settled ADR falls -2.67% per 100m of station distance in the 6 core cities of Japan’s three major metro areas, and -2.79% in other designated cities. The gradient remains significant after controlling for room count (June–August 2026, 0–2km, n=1,036 / 536).
- — In prefectural capitals the figure is -0.18% and in other municipalities -0.17%, neither statistically significant. Outside the big cities, room count (log-rooms coefficient 0.12–0.15), not station distance, explains rates.
- — Measured on the same distance bands, commercial land prices decay about 3–9 times faster than ADR. In the 6 core cities, moving from 0–250m to 500m–1km cuts land prices by 47.4% but ADR by only 17.6%.
- — The per-night land cost gap for a station-front site in the 6 core cities is ¥461, against an ADR gap of ¥1,941 — a 4.2x recovery multiple. Flexing cap rates 4.0–5.5% and occupancy 70–82% keeps it within 3.1–5.0x; the conclusion does not depend on the assumptions.
- — The highest-rate band is not 0–250m right above the ticket gates but 250–500m. In the 6 core cities, land prices in that band are also 14.5% above the 0–250m band, so ADR and land prices point the same way.
Conclusion: Distance Matters Only in Big Cities — Elsewhere, Room Count Sets the Rate
Source: MetroEngines Research & Consulting (business hotels, June–August 2026, 0–2km from station, log-linear regression controlling for room count)
The bottom line first. Regressing business hotels’ estimated settled ADR on station distance reveals a clear gradient: in the 6 core cities of the three major metro areas, ADR falls -2.67% for every 100m farther from the station, and -2.79% in other designated cities. Both remain statistically significant after controlling for each property’s room count. In prefectural capitals, however, the figure shrinks to -0.18%, and in other municipalities to -0.17%, neither reaching significance. The smaller the city, the less “distance from the station” is priced in — and the more explanatory power room count gains. The coefficient on log room count was 0.154 (t=8.97) in prefectural capitals and 0.124 (t=12.12) in other municipalities, both stronger explanatory variables than station distance.
This asymmetry feeds straight into site-selection practice. In big cities, the reason to pay extra for station-front land shows up in room rates. In regional cities, by contrast, the data show almost no rate penalty for choosing a site farther from the station, leaving room to cut acquisition costs accordingly. Below, we walk through the numbers along with the aggregation method.
Method: 1,221 Stations Nationwide as Anchors, 7,960 Hotels Each Assigned to One Nearest Station
Reference stations were drawn from station ridership data in MLIT’s Real Estate Information Library. Where several railway operators serve the same station, the data record each operator separately, so points within a 500m radius were merged into a single station cluster with combined ridership. We then defined 1,221 “target stations”: clusters with at least 20,000 daily passengers, plus the largest cluster in each municipality with a meaningful number of lodging facilities. By tier, that is 516 stations in the 6 core cities of the three major metros, 147 in other designated cities, 41 in prefectural capitals and 517 in other municipalities.
Next, for the 16,583 active lodging facilities with latitude/longitude data, we computed great-circle distance to the target stations. The key point is that each facility is assigned only to its nearest station, even when it falls inside several station areas. In central Tokyo and other dense cores, stations are tightly packed, so simply summing in-radius counts would count the same property many times and overstate station-front density. Unique assignment makes each distance band’s facility count and rate an independent population. In the end, 7,960 facilities fell within 5km of a target station, and the 6,066 with available price data were aggregated.
Nationwide distribution of the 1,221 target stations (circle size = ridership, color = city-size tier)
Source: Compiled by MetroEngines Research & Consulting from MLIT “Station Ridership” (Real Estate Information Library)
Business Hotels: In the Major Metros, ¥11,020 at 0–250m Falls to ¥9,079 at 500m–1km
The table below cross-tabulates distance band by city-size tier. Figures are the median estimated settled ADR of business hotels in each cell, with the number of facilities in parentheses. Cells with fewer than 20 facilities are not reported and marked “n too small.”
| City-size tier | 0-250m | 250-500m | 500m-1km | 1-2km | 2-3km | 3-5km |
|---|---|---|---|---|---|---|
| 6 core cities (3 major metros) | ¥11,020 (n=322) | ¥10,604 (n=541) | ¥9,079 (n=155) | n too small (n=18) | n too small (n=2) | n too small (n=1) |
| Other designated cities | ¥9,770 (n=115) | ¥10,198 (n=229) | ¥8,600 (n=134) | ¥7,179 (n=58) | n too small (n=11) | ¥6,840 (n=21) |
| Prefectural capitals (excl. designated cities) | ¥7,357 (n=110) | ¥7,366 (n=161) | ¥6,871 (n=143) | ¥6,473 (n=151) | ¥5,956 (n=69) | ¥6,486 (n=47) |
| Other municipalities | ¥7,159 (n=500) | ¥6,894 (n=461) | ¥6,613 (n=277) | ¥6,562 (n=247) | ¥7,131 (n=127) | ¥6,735 (n=189) |
Source: MetroEngines Research & Consulting (4,089 business hotels, June–August 2026)
In the 6 core cities of the three major metros, the 0–250m band’s ¥11,020 compares with ¥9,079 at 500m–1km — a gap of ¥1,941, or 17.6%. Beyond 1km, cells fall short of 20 facilities and are not reported. That is not because supply is thin, but because stations are so dense at this tier that lodging “more than 1km from the nearest station” barely exists. In fact, 84.7% of the 189,305 business hotel rooms in the 6 core cities sit within 0–500m.
In other designated cities, rates step down clearly from ¥9,770 at 0–250m to ¥6,840 at 3–5km. Prefectural capitals decline gently from ¥7,357 to ¥5,956, and in other municipalities the gap virtually disappears: ¥7,159 at 0–250m versus ¥7,131 at 2–3km.
One more point is easy to miss in practice. In both the 6 core cities and other designated cities, the peak is not in the 0–250m band but close to the 250–500m band. In designated cities, the 250–500m band’s ¥10,198 actually exceeds the 0–250m band’s ¥9,770. There are stretches where rates are higher one block away on the entertainment-district side than directly in front of the ticket gates. Chasing only “right next to the station” when acquiring land risks skipping over the band where rates are in fact higher. How the same distance decay plays out at individual stations is broken down station by station in Station Premium Ends at an 8-Minute Walk: 8 Stations, 1,012 Hotels.
Figure 1: Estimated settled ADR by distance band (business hotels, by city-size tier)
Source: MetroEngines Research & Consulting (4,089 business hotels; cells with n<20 hidden)
Control for Room Count and the Regional Distance Gradient Disappears
Medians by distance band still carry one confounder: properties closer to stations tend to be larger. In the 6 core cities, the median room count is 118 in the 0–250m band versus 86 at 500m–1km. Larger properties are more likely to offer premium room types and on-site facilities, which pushes rates up. As long as distance effects and size effects are mixed, the gradient cannot be read as “the price of station distance.”
We therefore regressed log estimated settled ADR on station distance (in 100m units) and log room count, estimating the distance coefficient net of size for each city-size tier. The sample is business hotels within 0–2km of a station.
| City-size tier | Distance only | Controlling for room count | t-value | Log room count coefficient | n |
|---|---|---|---|---|---|
| 6 core cities (3 major metros) | -3.03%/100m | -2.67%/100m | -4.24 | 0.071 | 1,036 |
| Other designated cities | -2.94%/100m | -2.79%/100m | -7.62 | 0.122 | 536 |
| Prefectural capitals | -0.80%/100m | -0.18%/100m | -0.61 | 0.154 | 565 |
| Other municipalities | -0.37%/100m | -0.17%/100m | -1.01 | 0.124 | 1,485 |
| Japan total | -1.92%/100m | -1.50%/100m | -9.72 | 0.149 | 3,622 |
Source: MetroEngines Research & Consulting (coefficients are treated as statistically significant when the absolute t-value exceeds roughly 2)
In the 6 core cities, -2.67%/100m survives the size control, so station distance itself moves rates. Designated cities show -2.79%/100m with a t-value of -7.62, the most stable gradient of all. In prefectural capitals and other municipalities, by contrast, the controlled coefficient shrinks to around -0.2% with t-values near 1. Most of the gentle decline visible in the distance-band medians turns out to be explained by the size distribution — large properties clustering in front of stations.
This does not mean station-front locations in regional cities are worthless. It means that, viewed through the single lens of room rates, no station-distance premium is observable. Lodging demand in regional cities relies far more on car travel, so parking availability and access to arterial roads likely substitute for walking minutes. From a site-selection standpoint, choosing a plot that can accommodate more rooms is more directly tied to rates than paying for a station-front address.
Figure 2: ADR elasticity to station distance (per 100m, business hotels)
Source: MetroEngines Research & Consulting (0–2km, n=3,622)
City Hotels: -1.34%/100m Nationally — The More Upscale, the Less Distance Matters
City hotels were aggregated using the same procedure. Because the population is smaller than for business hotels, more distance band × city-size cells fall below 20 facilities.
| City-size tier | 0-250m | 250-500m | 500m-1km | 1-2km | 2-3km | 3-5km |
|---|---|---|---|---|---|---|
| 6 core cities (3 major metros) | ¥16,130 (n=63) | ¥16,411 (n=91) | ¥14,260 (n=40) | n too small (n=4) | n too small (n=1) | n too small (n=0) |
| Other designated cities | ¥15,324 (n=35) | ¥14,158 (n=41) | ¥10,190 (n=23) | n too small (n=19) | n too small (n=3) | n too small (n=4) |
| Prefectural capitals (excl. designated cities) | ¥11,226 (n=24) | n too small (n=15) | ¥8,306 (n=41) | ¥9,827 (n=41) | n too small (n=12) | n too small (n=8) |
| Other municipalities | ¥8,489 (n=77) | ¥8,147 (n=61) | ¥8,481 (n=57) | ¥7,976 (n=55) | n too small (n=16) | ¥9,258 (n=23) |
Source: MetroEngines Research & Consulting (754 city hotels, June–August 2026)
In the 6 core cities, rates are ¥16,130 at 0–250m, ¥16,411 at 250–500m and ¥14,260 at 500m–1km. In designated cities they fall from ¥15,324 at 0–250m to ¥10,190 at 500m–1km, a steeper drop than for business hotels. The regression also confirms a significant nationwide gradient of -1.34%/100m (t=-3.14, n=687). Sensitivity is nonetheless lower than for business hotels in the big metros (-2.67%/100m). The more the purpose of a trip is the stay itself, the less weight walking minutes from the station carry in the choice. This pattern becomes even more extreme for ryokan, covered next.
Without Controlling for Hotel Type the Sign Flips: Ryokan Get Pricier Farther From Stations
Mix hotel types when aggregating by distance band and the conclusion reverses. Ryokan estimated settled ADR is ¥8,504 at 0–250m, ¥11,753 at 500m–1km and reaches ¥13,964 at 2–3km. The regression also shows a clearly positive gradient of +1.38%/100m (t=3.51, n=785). This is only natural, since the location logic of hot-spring towns and scenic destinations differs entirely from that of station-front urban districts.
This sign reversal is the single biggest pitfall in designing the aggregation. If you present ADR by distance band with all hotel types pooled, ryokan and resort hotels concentrate in the distant bands and produce the spurious result that “the farther from the station, the more expensive.” Any discussion of distance gradients must control for hotel type first. That is why this article separates business hotels and city hotels from the outset.
Figure 3: Distance gradient by hotel type (index, 0–250m band = 100, Japan total)
Source: MetroEngines Research & Consulting (4,089 business / 754 city hotels / 1,072 ryokan)
Land Prices Decay 3–9 Times Faster Than ADR — Commercial Land Measured on the Same Distance Bands
Now to the land side. We took commercial-land point prices from the 2026 official land price survey (Reiwa 8 Chika Koji) published by MLIT in March 2026, computed each point’s distance to the nearest target station using exactly the same procedure as for lodging facilities, and assigned it to the same distance bands. The sample is 4,576 points. Nationally, the survey showed a 2.8% rise across all uses and 4.3% for commercial land — the fifth straight year of gains and the strongest growth since the bubble era.
| City-size tier | 0-250m | 250-500m | 500m-1km | 1-2km | 2-3km | 3-5km |
|---|---|---|---|---|---|---|
| 6 core cities (3 major metros) | ¥1,520,000 FAR 500% / n=421 | ¥1,740,000 FAR 500% / n=455 | ¥799,000 FAR 400% / n=313 | ¥344,000 FAR 300% / n=129 | ¥213,000 FAR 300% / n=20 | n too small (n=16) |
| Other designated cities | ¥753,000 FAR 400% / n=118 | ¥797,500 FAR 400% / n=134 | ¥487,000 FAR 400% / n=163 | ¥244,000 FAR 300% / n=168 | ¥152,500 FAR 200% / n=78 | ¥120,000 FAR 200% / n=68 |
| Prefectural capitals (excl. designated cities) | ¥308,000 FAR 600% / n=41 | ¥175,000 FAR 400% / n=53 | ¥134,000 FAR 400% / n=119 | ¥116,000 FAR 400% / n=156 | ¥93,750 FAR 200% / n=106 | ¥75,300 FAR 200% / n=111 |
| Other municipalities | ¥337,000 FAR 400% / n=392 | ¥164,000 FAR 400% / n=304 | ¥113,000 FAR 350% / n=372 | ¥89,800 FAR 200% / n=378 | ¥76,300 FAR 200% / n=229 | ¥68,400 FAR 200% / n=232 |
Source: Compiled by MetroEngines Research & Consulting from MLIT “2026 Official Land Prices” (Real Estate Information Library) (4,576 commercial-land points as of January 1, 2026; cells with n<20 hidden)
In the 6 core cities, land costs ¥1,520,000/㎡ at 0–250m versus ¥799,000/㎡ at 500m–1km, a 47.4% drop. ADR over the same stretch fell 17.6%. Other municipalities are even more extreme: land prices drop 66.5%, from ¥337,000 to ¥113,000, while ADR falls just 7.6%. Land prices decay roughly 3 to 9 times faster than ADR.
In the 6 core cities and designated cities, the land price peak was also in the 250–500m band rather than 0–250m. In the 6 core cities, the 250–500m band’s ¥1,740,000/㎡ is 14.5% above the 0–250m band. The general structure of land prices — the highest values forming at the heart of the commercial district adjacent to the station rather than at the station itself — holds here too. It points the same way as the ADR peak we saw around the 250–500m band.
Figure 4: Decay of ADR vs. commercial land prices (index, 0–250m band = 100)
Source: MetroEngines Research & Consulting / MLIT “2026 Official Land Prices” and “Station Ridership” (Real Estate Information Library)
Recovering the Station-Front Land Premium — Per-Night Land Cost Gap Is a Few Hundred Yen, ADR Gap 2–6x That
We now know land prices and ADR decay at different speeds. But can the extra paid for station-front land be recovered through room rates? Price per ㎡ alone cannot answer that. Station-front sites also carry higher floor area ratios, so the same per-㎡ price gap translates into a smaller land burden per room (for an analysis that back-solves development capacity itself from FAR and land prices, see Hotel Development Capacity 2026: Zoning, FAR & Land Price in 5 Markets).
We therefore assumed 28㎡ of gross floor area per room for a limited-service hotel (15–16㎡ guest room plus common areas), divided by the median designated FAR in each distance band to get the required site area per room, and multiplied by the official land price to estimate land acquisition cost per room. We converted that to an annual figure at a 4.5% yield and divided by 78% occupancy (modeling assumption, full-year basis, 285 room-nights per year) to get land cost per night. All of these are modeling assumptions; actual business plans will vary with design efficiency, acquisition terms and construction costs.
| City-size tier | Land price gap (per ㎡) |
Land cost gap per room |
Land cost gap per night |
ADR gap | Recovery multiple |
|---|---|---|---|---|---|
| 6 core cities (3 major metros) | +90.2% | +¥2,919,000 (+52.2%) | +¥461 | +¥1,941 | 4.2x |
| Other designated cities | +54.6% | +¥1,862,000 (+54.6%) | +¥294 | +¥1,170 | 4.0x |
| Prefectural capitals | +129.9% | +¥499,000 (+53.2%) | +¥79 | +¥486 | Reference only |
| Other municipalities | +198.2% | +¥1,455,000 (+161.0%) | +¥230 | +¥546 | Reference only |
Source: MetroEngines Research & Consulting / MLIT “2026 Official Land Prices” and “Station Ridership” (Real Estate Information Library) (estimates assuming 28㎡ gross floor area per room, 4.5% yield, 285 room-nights per year)
In the 6 core cities, the additional per-night burden of choosing a 0–250m site is estimated at ¥461. The ADR gap, by contrast, is ¥1,941 — roughly 4.2 times larger. Designated cities show ¥294 against ¥1,170, or 4.0x. Station-front land that is 90% pricier per ㎡ sees its per-room land cost gap compressed to 52% by the higher FAR, and restated per night, the gap is on the order of a few hundred yen. In the big metros, the station-front land premium is structurally recoverable through room rates.
Prefectural capitals and other municipalities are shown as reference only because, in these tiers, the ADR gap itself loses statistical significance once size is controlled for. Their land cost gaps of ¥79–¥230 are small; the difference in land burden between station-front and 500m–1km sites is simply not large enough to swing project feasibility. What separates decisions at this tier is not station distance but the size and shape of the plot, which feeds into rates through room count.
How Far Can the Assumptions Move Before the Recovery Multiple Breaks? — 3 Scenarios and a 2-Axis Sensitivity
The ¥461 and 4.2x figures above rest on three assumptions: 28㎡ gross floor area per room, a 4.5% yield and 78% occupancy. The two that swing most in real business plans are the acquisition yield and occupancy, so we check whether the conclusion holds when those two axes move. Per-night land cost gap = per-room land cost gap × yield ÷ (365 × occupancy), and the ADR gap is fixed at the distance-band figure, so the recovery multiple can be recalculated from these two axes alone.
| Scenario | Yield / Occupancy | 6 core cities (3 major metros) | Other designated cities | Assumption |
|---|---|---|---|---|
| Downside | 5.5% / 70% | ¥628 3.1x | ¥401 2.9x | High acquisition yield and occupancy below plan |
| Base (article assumption) | 4.5% / 78% | ¥461 4.2x | ¥294 4.0x | 28㎡ gross floor area per room, 4.5% yield, 285 room-nights/year |
| Upside | 4.0% / 82% | ¥390 5.0x | ¥249 4.7x | Acquired at a low yield, with occupancy above plan |
Source: MetroEngines Research & Consulting / MLIT “2026 Official Land Prices” and “Station Ridership” (Real Estate Information Library) (estimates using the same per-room land cost gap and ADR gap as Table 5, varying only yield and occupancy; top = per-night land cost gap, bottom = recovery multiple against the ADR gap)
| Occupancy 70% | Occupancy 74% | Occupancy 78% | Occupancy 82% | |
|---|---|---|---|---|
| Yield 4.0% | ¥457 4.2x | ¥432 4.5x | ¥410 4.7x | ¥390 5.0x |
| Yield 4.5% | ¥514 3.8x | ¥486 4.0x | ¥461 4.2x | ¥439 4.4x |
| Yield 5.0% | ¥571 3.4x | ¥540 3.6x | ¥513 3.8x | ¥488 4.0x |
| Yield 5.5% | ¥628 3.1x | ¥594 3.3x | ¥564 3.4x | ¥536 3.6x |
Source: MetroEngines Research & Consulting / MLIT “2026 Official Land Prices” (Real Estate Information Library) (shaded cell = article base case; estimates holding the per-room land cost gap of +¥2,919,000 and ADR gap of +¥1,941 fixed while varying yield and occupancy)
In the 6 core cities, even the harshest combination (5.5% yield, 70% occupancy) keeps the per-night land cost gap at ¥628, leaving a 3.1x multiple against the ¥1,941 ADR gap. The most favorable combination (4.0% yield, 82% occupancy) yields ¥390 and 5.0x, so the full plausible range stays within 3.1–5.0x. Designated cities span 2.9–4.7x on the same ranges. In other words, the conclusion that “in big cities, the station-front land premium can be recovered through room rates” does not change sign whichever way yield or occupancy moves. Conversely, what would break this judgment is not assumption risk but a shrinking ADR gap itself — namely, if further station-front supply erodes the rate advantage of the 0–250m band.
Figure 5: Per-night land cost gap vs. ADR gap (0–250m band vs. 500m–1km band)
Source: MetroEngines Research & Consulting / MLIT “2026 Official Land Prices” and “Station Ridership” (Real Estate Information Library)
Where Supply Sits — 84.7% Within 500m in the 6 Core Cities, More Dispersed in Regional Markets
Finally, the supply-side distribution. Tallying business hotel rooms by distance band produces completely different shapes depending on city size.
Figure 6: Share of business hotel rooms by distance band (by city-size tier)
Source: MetroEngines Research & Consulting (total rooms: 6 core cities 189,305 / designated cities 96,464 / prefectural capitals 90,261 / other 194,067)
In the 6 core cities, 84.7% of the 189,305 rooms are concentrated within 0–500m, and just 1.3% lie beyond 1km. The 0–500m share is 64.4% in designated cities, 45.5% in prefectural capitals and 55.4% in other municipalities, dispersing as city size falls. In prefectural capitals, 34.2% of rooms are beyond 1km, and as shown earlier, no clear ADR decline is observed in that band either.
That is where the opportunity lies. Sites away from the station cost one-half to one-third as much to acquire on an official land price basis. What they demand in return is a reason to visit other than walking minutes: substitutes for access such as shuttle service and parking, room scale that makes use of a larger plot, and the on-site facilities that scale enables, such as breakfast venues and large communal baths. Indeed, in prefectural capitals and other municipalities the log room count coefficient is high, around 0.15, and the numbers show that properties able to secure scale are rewarded in rates. Giving up on a station-front site is not the same as giving up on rate — that is the most practical takeaway from this analysis.
Conversely, in the cores of the three major metros and in designated cities, station distance ties directly to rates. Competition for land is fierce, but with the per-night land cost gap only about a quarter of the ADR gap, the decision to go after station-adjacent sites has numbers behind it. The fact that the highest-rate band sits not directly above the ticket gates but at 250–500m should also help narrow down acquisition candidates.
Methodology and Caveats
- Lodging prices are aggregated within the coverage of MetroEngines Research & Consulting; facilities with no confirmed activity on OTAs are excluded. Of roughly 168,000 facilities tracked in Japan, about 27,000 with confirmed activity form the analysis population.
- Estimated settled ADR uses each facility’s median value across June, July and August 2026, all calculated on a closed historical basis. Forward months with a different estimation basis are not mixed in.
- Distance band × city-size cells with fewer than 20 facilities are not reported and are marked “n too small.” The 600% designated FAR in the 0–250m band for prefectural capitals is a median of 41 points; note the thinner sample compared with other tiers.
- Station distance is straight-line, not road distance. Actual walking time varies by route.
- Official land prices are as of January 1, 2026 and lodging prices cover June–August 2026, so the timing does not match exactly.
- The regression is a log-linear model limited to 0–2km from the station, estimated separately for business hotels, city hotels and ryokan. Factors other than room count (building age, brand, facility level) are not controlled for.
Related Articles
- Station Premium Ends at an 8-Minute Walk: 8 Stations, 1,012 Hotels
- Hotel Development Capacity 2026: Zoning, FAR & Land Price in 5 Markets
- Policy Rate 1.00%: Break-Even ADR Across Japan’s 8 Hotel Markets
- Hotel vs Condo Land Rivalry: ADR-Implied Feasible Land Price Map
- Tokyo Business Hotel ADR 12-Month Trend: 30% Central vs Outer Ward Gap
References and Sources
■ Data Sources
Lodging prices are MetroEngines Research & Consulting estimated settled ADR (June, July and August 2026, closed historical basis, per-facility median), covering 4,089 business hotels, 754 city hotels and 1,072 ryokan. Station coordinates and ridership, as well as commercial-land official prices and designated FAR, were obtained from MLIT’s Real Estate Information Library; stations within a 500m radius were merged into single clusters, yielding 1,221 target stations. Official land prices cover 4,576 commercial-land points (as of January 1, 2026).
■ Modeling Assumptions
Distance is straight-line rather than road distance, and each facility is assigned only to its single nearest station (no double counting). Elasticities come from log-linear regressions limited to 0–2km from the station, with log room count as a control variable, estimated separately by hotel type (business / city / ryokan). Coefficients are treated as significant when the absolute t-value exceeds roughly 2. Land cost per room uses a base case of 28㎡ gross floor area, 4.5% yield and 78% occupancy (285 room-nights per year), with sensitivity checked across yields of 4.0–5.5% and occupancy of 70–82% (Tables 6 and 7).
■ Limitations and Caveats
Estimated settled ADR applies hotel-type adjustments to published prices and differs from each facility’s actual settled prices and accounting figures (median error of about 7% against property-level disclosures by listed hotel REITs). Cells with fewer than 20 facilities are marked “n too small” and not reported. Factors other than room count (building age, brand, facility level) are not controlled for. Official land prices are as of January 1, 2026 and lodging prices cover June–August 2026, so timing does not match exactly. The recovery multiple covers land acquisition cost only and excludes construction costs, design efficiency and acquisition terms.
■ Market Data
- MetroEngines Research & Consulting — Estimated settled ADR (4,089 business hotels / 754 city hotels / 1,072 ryokan, June–August 2026); facility location and room count master (16,583 active facilities)
■ Government Statistics and Public Data
- MLIT “2026 (Reiwa 8) Official Land Prices” (4,576 commercial-land points aggregated, as of January 1, 2026)
- MLIT press release: “Nationwide land prices rise for 5th straight year on an all-use average — 2026 Official Land Prices” (Japanese)
- MLIT “Overview of the 2026 Official Land Prices” (March 2026, Japanese)
- MLIT Real Estate Information Library — station ridership (1,221 stations extracted), official land prices, zoning and designated FAR
■ Reference and Related Information
- How high are hotel construction costs per tsubo? [2025 edition] (Japanese) (used to check assumptions for the per-room land cost estimate)
- MLIT “Statistics on Building Starts”