

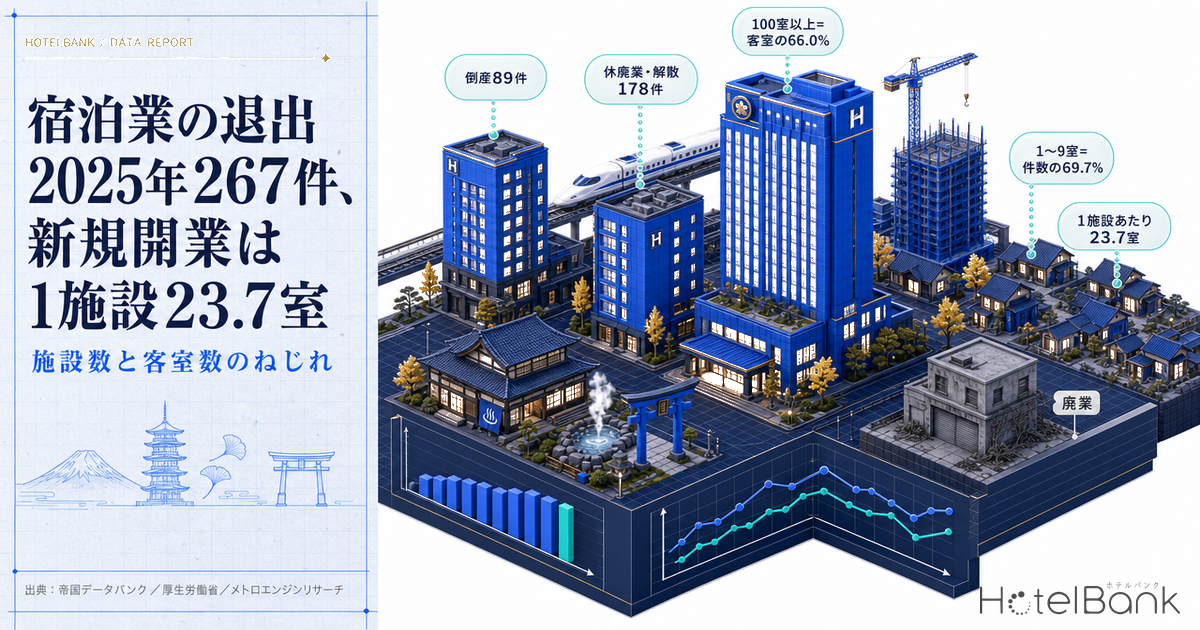
There is more than one way for a lodging operator to leave the market. In 2025, 89 lodging businesses in Japan went bankrupt and a further 178 closed or dissolved voluntarily — 267 exits in total (Teikoku Databank). At the same time, new properties keep opening, and on a facility-count basis supply is still growing. Rebuild the same picture on a room-count basis, however, and a completely different image emerges. This article cross-references official statistics with opening data to break down, in numbers, a structure in which the facility count holds up while the room count grows only slowly.
Terms and Data Definitions Used in This Article
- Bankruptcy (倒産): legal insolvency proceedings involving liabilities of ¥10 million or more (Teikoku Databank’s tabulation definition). Tokyo Shoko Research includes out-of-court workouts as well as legal proceedings.
- Closure / dissolution (休廃業・解散): companies that ceased business activity for reasons other than bankruptcy, plus dissolutions recorded in the commercial register. The population and the determination method both differ from bankruptcy, and the figure obtained by adding the two together is defined differently by each research house.
- Business terminations (営業廃止件数): notifications of the termination of an operating licence under the Ryokan Business Act (facility basis, within the fiscal year). The unit differs from company-basis bankruptcies and closures.
- New openings (OTA-listing-confirmed basis): annual opening counts tabulated from the establishment dates of properties among the lodging facilities in Japan tracked by MetroEngines Research whose operation could be confirmed on OTA platforms. Only properties located in Japan are covered; lodging facilities not listed on OTAs are excluded.
- Data sources: Ministry of Health, Labour and Welfare “Report on Public Health Administration and Services”; Teikoku Databank; Tokyo Shoko Research; Ministry of Land, Infrastructure, Transport and Tourism “Statistical Survey on Building Construction Starts”; MetroEngines Research
- — Lodging-industry exits in 2025 totalled 267 (89 bankruptcies plus 178 closures/dissolutions, Teikoku Databank). This is a company-basis figure, drawn from a different population than the 2,817 facility-basis business terminations.
- — New openings shrank from 41.5 rooms per property in 2019 to 23.7 rooms in 2025, a 42.9% decline. The number of properties fell only 16.0%, while the room count fell 52.0%.
- — Among 2026 openings, properties of 1–9 rooms account for 69.7% of the count but only 5.6% of rooms, while properties of 100 rooms or more account for 8.7% of the count and 66.0% of rooms. Room supply is determined by the number of large projects alone.
- — The same holds for the national stock: from FY2021 to FY2024 the facility count rose 4.8% while the room count rose 1.4%. Counts and rooms have to be read as two separate indicators.
Three Exit Routes — Bankruptcy, Closure/Dissolution and Transfer Are Not the Same Thing
What looks like a lodging facility “disappearing” splits into at least three distinct routes. The first is bankruptcy, which involves legal insolvency proceedings (liquidation, civil rehabilitation and so on). The second is closure or dissolution, in which the business stops operating, or is dissolved on the register, without a formal debt workout. The third is transfer or rebranding: the corporate entity may vanish, but the building and its rooms remain in the market under a different operator.
The third route matters. Transfers and rebrandings are sometimes counted statistically as “exits,” yet nothing is lost from the room stock. A decline in the number of companies and a decline in the number of rooms simply cannot be measured on the same scale. The table below sets out the distinction before we go further.
| Route | Definition / compiling body | Impact on room stock |
|---|---|---|
| Bankruptcy | Legal insolvency with liabilities of ¥10 million or more (Teikoku Databank) / legal proceedings plus out-of-court workouts (Tokyo Shoko Research) | Rooms survive under a sponsor-led restructuring; they are lost in a liquidation |
| Closure / dissolution | Companies that ceased business activity other than through bankruptcy, plus dissolutions in the commercial register | If the building remains, there is room for reopening or conversion to another use |
| Transfer / rebranding | M&A and business succession. Frequently not captured in either of the statistics above | Rooms are retained as they are; only the operator changes |
| Business termination (Ryokan Business Act) | Notification to the public health centre terminating an operating licence (facility basis, MHLW) | Extinguishes the licence; does not necessarily mean the building has been demolished |
Source: compiled by the HotelBank Editorial Team from the published definitions of each compiling body
267 Exits in 2025 — but the Direction Reverses Depending on Who Is Counting
According to Teikoku Databank’s survey of bankruptcies, closures and dissolutions in the lodging industry for 2025, released on 6 February 2026, there were 89 lodging-industry bankruptcies in 2025 — 11 more than the previous year’s 78, a 14.1% increase and the second consecutive annual rise. Adding the 178 closures and dissolutions gives the 267 exits recorded for the year. By region, 75.3% occurred outside the three major metropolitan areas, close to the pre-pandemic 2019 level of 77.2%.
Teikoku Databank also breaks down the causes of bankruptcy. The share of cases whose causes include “ageing,” “repairs” or “breakdowns” rose from 6.0% in 2006–2010 to 14.6% in 2021–2025. In other words, current exits are tied more tightly to the building and equipment renewal cycle than to the demand environment. Lodging is a capital-intensive business that assumes renovation every five to ten years, so a change of ownership or operator at that renewal point is a natural phenomenon in itself.
Source: compiled by the HotelBank Editorial Team from Teikoku Databank, “Bankruptcy, Closure and Dissolution Trends in the Lodging Industry (2025),” released 6 February 2026
One caveat deserves attention here: for all industries combined, even the direction of the closure/dissolution total differs by compiling body. Teikoku Databank puts 2025 at 67,949 cases, down 1.6% from the previous year’s 69,019. Tokyo Shoko Research puts 2025 at 67,210 cases, up 7.2% year on year. The levels are almost identical, yet the sign of the change is reversed. Tokyo Shoko Research partially revised its methodology in 2024 to incorporate public-notice information into its dissolution determination, and definitional changes of that kind carry through into year-on-year comparisons. So rather than saying flatly that “closures rose” or “closures fell,” one has to state which compiling body and which definition is being read.
Alongside the company-basis statistics, it is worth looking at the facility-basis numbers. The Ministry of Health, Labour and Welfare’s “Report on Public Health Administration and Services” (FY2024 edition, released 21 October 2025) records 2,817 business terminations and 7,720 operating licences granted for ryokan and hotel businesses during FY2024. The gap between 267 on a company basis and 2,817 on a facility basis is more than tenfold, but this reflects different populations rather than a contradiction. Cases where one company owns several facilities, businesses run as sole proprietorships, and re-licensing that accompanies the succession or structural alteration of a licence all push up the facility-basis count. Stacking the difference between licences and terminations by prefecture also reveals prefectures where rooms declined on a net basis, which is broken down in detail in 98,338 Lodging Facilities: 30 of 47 Prefectures Lost Rooms in FY2024.
New Openings Fell from 41.5 Rooms per Property to 23.7 — Scale Shrank Before Volume Did
So how is the supply side moving? Tabulating by year of establishment those properties, among the facilities in Japan tracked by MetroEngines Research, whose operation could be confirmed on OTA platforms, the number of new openings and their room counts have moved as follows.
| Opening year | Properties | Rooms | Per property | Properties of 100+ rooms |
|---|---|---|---|---|
| 2019 | 2,077 | 86,295 | 41.5 rooms | 294 |
| 2020 | 2,259 | 79,110 | 35.0 rooms | — |
| 2021 | 1,821 | 59,126 | 32.5 rooms | 222 |
| 2022 | 1,685 | 49,482 | 29.4 rooms | — |
| 2023 | 2,018 | 43,758 | 21.7 rooms | 136 |
| 2024 | 1,983 | 39,070 | 19.7 rooms | 110 |
| 2025 | 1,744 | 41,393 | 23.7 rooms | 137 |
| 2026 (capture in progress) | 1,420 | 36,818 | 25.9 rooms | 124 |
Source: MetroEngines Research & Consulting (OTA-listing-confirmed basis, properties located in Japan only. N = 2,077 properties / 86,295 rooms for 2019; 1,744 properties / 41,393 rooms for 2025; 1,420 properties / 36,818 rooms for 2026, capture in progress)
The number of properties fell from 2,077 in 2019 to 1,744 in 2025 — a decline of just 16.0%. Rooms, however, fell from 86,295 to 41,393, a drop of 52.0%. Average scale shrank from 41.5 rooms to 23.7 rooms per property, down 42.9%. The rate of decline in counts and the rate of decline in rooms diverge by more than a factor of three. This is the “twist” at the core of this article.
Source: MetroEngines Research & Consulting (OTA-listing-confirmed basis, properties located in Japan only. N = 2,077 properties / 86,295 rooms for 2019; 1,744 properties / 41,393 rooms for 2025)
The twist comes from the mix of property types. Looking at 2026 openings by type, the largest counts are vacation rentals at 680 properties, business hotels at 188, hostels at 106 and resort hotels at 83. Sort by rooms instead and business hotels (19,235 rooms), resort hotels (6,924) and city hotels (4,851) together account for 84.2% of the total, while vacation rentals — first by property count with 680 — contribute just 1,111 rooms (1.6 rooms per property). The ranking by count and the ranking by rooms are almost entirely different lists (for a reading of the same type-by-type breakdown from a revenue-management perspective, see Japan 2026: 1,242 Openings, 33,749 Rooms — 47% Villas, 42% Business).
| Property type (2026 openings) | Properties | Rooms | Per property | Share of rooms |
|---|---|---|---|---|
| Business hotel | 188 | 19,235 | 102.3 rooms | 52.2% |
| Resort hotel | 83 | 6,924 | 83.4 rooms | 18.8% |
| City hotel | 42 | 4,851 | 115.5 rooms | 13.2% |
| Hostel | 106 | 1,981 | 18.7 rooms | 5.4% |
| Vacation rental | 680 | 1,111 | 1.6 rooms | 3.0% |
| Ryokan | 49 | 731 | 14.9 rooms | 2.0% |
| Cottage | 64 | 624 | 9.8 rooms | 1.7% |
Source: MetroEngines Research & Consulting (OTA-listing-confirmed basis, 2026, N = 1,420 properties / 36,818 rooms, capture in progress)
Breaking It Down by Size Band — 70% of Properties Hold 6% of Rooms, and the 100+ Room Tenth Holds Two-Thirds
Size band is an even more direct cut than property type. Split openings into four room-count ranges and put the share of properties next to the share of rooms, and the twist is visible at a glance.
Source: MetroEngines Research & Consulting (OTA-listing-confirmed basis; 2026 capture in progress. N = 2,077 properties for 2019 / 1,983 for 2024 / 1,420 for 2026)
| Size band | 2019 properties / rooms share | 2024 properties / rooms share | 2026 properties / rooms share |
|---|---|---|---|
| 1–9 rooms | 53.2% / 4.0% | 76.4% / 8.3% | 69.7% / 5.6% |
| 10–29 rooms | 20.2% / 8.2% | 10.3% / 8.6% | 11.3% / 7.3% |
| 30–99 rooms | 12.4% / 17.3% | 7.7% / 22.4% | 10.3% / 21.1% |
| 100 rooms or more | 14.2% / 70.5% | 5.5% / 60.7% | 8.7% / 66.0% |
Source: MetroEngines Research & Consulting (OTA-listing-confirmed basis, properties located in Japan only. N = 2,077 properties / 86,295 rooms for 2019; 1,983 properties / 39,070 rooms for 2024; 1,420 properties / 36,818 rooms for 2026, capture in progress)
Among 2026 openings, small properties of 1–9 rooms make up 69.7% of the count but only 5.6% of rooms. Conversely, properties of 100 rooms or more are 8.7% of the count (124 properties) yet supply 66.0% of the rooms (24,315). In other words, changes in room stock are decided almost entirely by the number of large projects, and that number shrank from 294 in 2019 to 110 in 2024 before recovering to 137 in 2025 and 124 in 2026 (in progress). Watching count-based opening statistics alone, none of this movement is visible. The regulatory background to small properties driving the count this hard is worth noting separately: since the 2018 amendment to the Ryokan Business Act removed the minimum-room-count requirement, a lodging licence can be obtained for a property with a single room, and roughly half of 2026 openings are at that scale.
Note that rooms per property in 2026 (25.9) exceeds the 2024 figure (19.7) partly because of an apparent upward pull created by small properties appearing in listings later. As the note in the next section explains, this figure may move downward as capture continues.
The National Stock Shows the Same Pattern — Facilities +4.8% Against Rooms +1.4%
Everything so far has concerned the flow of openings. The same directional twist can be confirmed on the stock side. In the ryokan and hotel business category of the MHLW’s “Report on Public Health Administration and Services,” the 50,523 facilities and 1,757,557 rooms recorded at the end of FY2021 had become 52,946 facilities and 1,782,232 rooms by the end of FY2024. That is +2,423 facilities (+4.8%) against +24,675 rooms (+1.4%) — a growth-rate gap of more than three times. Rooms per facility contracted from 34.8 to 33.7, a fall of 1.1 rooms.
Source: compiled by the HotelBank Editorial Team from the Ministry of Health, Labour and Welfare “Report on Public Health Administration and Services” (e-Stat). Fiscal years for which facility and room counts are available in the same table are shown
On a longer scale, the facility count for ryokan and hotel businesses fell consistently from 54,540 in FY2012 to 49,024 in FY2017, then recovered to 52,946 by FY2024. Rooms, meanwhile, rose 14.5% over the period, from 1,555,961 in FY2012 to 1,782,232 in FY2024, without ever falling sharply. Rooms were increasing even in the years when facilities were declining. Equating a change in facility count with a change in supply volume has therefore not held for well over a decade.
Licensing activity during FY2024 is also instructive. There were 7,720 operating licences granted for ryokan and hotel businesses against 2,817 terminations — 2.7 licences for every termination. Operating licences can, however, include re-licensing that accompanies succession or structural alteration of a facility, so this is not a pure count of new entrants. In practice the net increase in facilities was only +1,908 year on year (from 51,038 to 52,946). The gap between the licence count and the net increase is precisely the territory in which buildings and rooms are retained while the operator changes hands.
A note on the 2026 data: new-opening tabulations are based on confirmation of OTA listings, and listings begin to appear several months before opening, so both the property and room counts for recent and later months are expected to rise as further listings are reflected. In the monthly breakdown for 2026, January to July run at 155–241 properties per month, then drop sharply to 21 in September and 7 in November — this indicates that observation has not caught up, not that supply is thinning. Treat the annual figures (1,420 properties, 36,818 rooms) as a floor at the present time.
Source: MetroEngines Research & Consulting (OTA-listing-confirmed basis, properties located in Japan only. N = 1,420 properties / 36,818 rooms for 2026, capture in progress)
How the Receiving Side Should Read This — Which Size Band of Stock Is Actually Moving
Let us reorder the figures above from the perspective of those taking the stock on: investors, operating chains and local business successors.
First, the stock that is moving is concentrated in the small and mid-size bands. As noted above, 75.3% of the 267 company-basis exits occurred outside the three major metropolitan areas, which indicates that ryokan and small hotels with few rooms sit at the centre of the population. At the same time, the fact that the 1–9 room band accounts for roughly 70% of new openings means that old and new are being swapped within the same size band in parallel. Buildings that exit are not simply lost; there is room here for them to return to the market under a different operator or in a different format.
Second, what governs the change in room stock is the number of projects of 100 rooms or more. In 2026, 124 such properties supply 24,315 rooms, or 66.0% of the annual room total. Put the other way round, a swing of a few dozen projects in this band a year shifts national room supply by thousands of rooms. Plan-stage pipeline data from the MLIT “Statistical Survey on Building Construction Starts” (properties of 30 rooms or more) shows 24 projects and 4,940 rooms for 2026, 20 projects and 3,891 rooms for 2027, and 9 projects and 1,473 rooms for 2028. Because building confirmation applications are normally filed one to two years before opening, the counts for 2028 onward are expected to grow as further applications come in, and should be read as a floor for the confirmed pipeline at this point in time.
Third, the timing of renewal investment is the trigger for a change of operator. The share of bankruptcies whose causes include “ageing,” “repairs” or “breakdowns” stands at 14.6% for 2021–2025, 2.4 times the 6.0% of 2006–2010. In a capital-intensive business requiring renovation every five to ten years, which party bears that renewal investment becomes the fork in the road for the ownership and operating structure. Seen from the other side, for a buyer able to fund renovation this is a moment when a property whose location and structural frame already exist can be returned to the market on a shorter lead time than new construction. Teikoku Databank likewise notes that there are real cases of properties with distinctive local cuisine or unique demand-generating assets being rehabilitated under a sponsor.
Fourth, there is room for conversion between property types. In 2026 openings, vacation rentals lead the count with 680 properties while ryokan number only 49. This asymmetry is consistent with a flow in which existing ryokan buildings are refurbished and return to the market in a different format. On the same land and in the same building, reorganising the room mix and the operating model reaches a different demand segment. Whether one reads the turnover of stock as “replacement within the same format” or as “reallocation between formats” changes the way acquisition candidates look considerably.
Conclusion — Read Counts and Rooms Separately
To summarise the figures confirmed in this article: lodging-industry exits in 2025 totalled 267, comprising 89 bankruptcies and 178 closures/dissolutions (Teikoku Databank). For all industries combined, even the sign of the 2025 change in closures and dissolutions reverses depending on the compiling body, so the definition and the source must always be checked before reading. On a facility basis, FY2024 saw 2,817 business terminations and 7,720 operating licences (MHLW).
On the supply side, the number of new openings fell only 16.0% between 2019 and 2025 while rooms fell 52.0%, and the average per property contracted from 41.5 rooms to 23.7. The 2026 cohort follows the same shape: the 1–9 room band takes 69.7% of the count but 5.6% of rooms, while properties of 100 rooms or more take 8.7% of the count and 66.0% of rooms. The national stock shows the same twist, with facilities up 4.8% against rooms up 1.4% between the end of FY2021 and the end of FY2024.
Measuring supply pressure in the market therefore requires building up from rooms rather than counts, and any discussion of exits has to keep the company basis and the facility basis apart. Moreover, the buildings and the locations of properties that exit remain in place in most cases. What the numbers show is not a contraction of supply but a turnover in who holds it and in how it is distributed across size bands.
Related Reading
References and Sources
■ Exit trends (private research)
- Teikoku Databank, “Bankruptcy, Closure and Dissolution Trends in the Lodging Industry (2025)” (released 6 February 2026)
- Teikoku Databank, “National Survey of Corporate Closures and Dissolutions (2025)” (released 9 January 2026)
- Tokyo Shoko Research, “Closures and Dissolutions Hit a Record 62,600 Companies in 2024” (released 11 January 2025; definition of closures and dissolutions)
- Tokyo Shoko Research, “Closures and Dissolutions Reached a Record 67,200 in 2025; 47.2% of Companies Loss-Making”
■ Government statistics
- Ministry of Health, Labour and Welfare, “Report on Public Health Administration and Services, FY2024” (released 21 October 2025) — Table 8: facilities and rooms in the ryokan and hotel business, and facilities, licences, terminations and dispositions for simple lodging and boarding-house businesses
- e-Stat, “Report on Public Health Administration and Services, appended table: lodging businesses by year, FY1997 onward” (statistical table IDs 0004026910 / 0004048085)
- Ministry of Health, Labour and Welfare, “Report on Public Health Administration and Services, FY2023” — fiscal-year series for ryokan and hotel business facilities
- Ministry of Land, Infrastructure, Transport and Tourism, “Statistical Survey on Building Construction Starts” — plan-stage lodging pipeline
■ Market data
- MetroEngines Research & Consulting — new openings by property count, room count, property type and size band (OTA-listing-confirmed basis, properties located in Japan only, 2019–2026)