

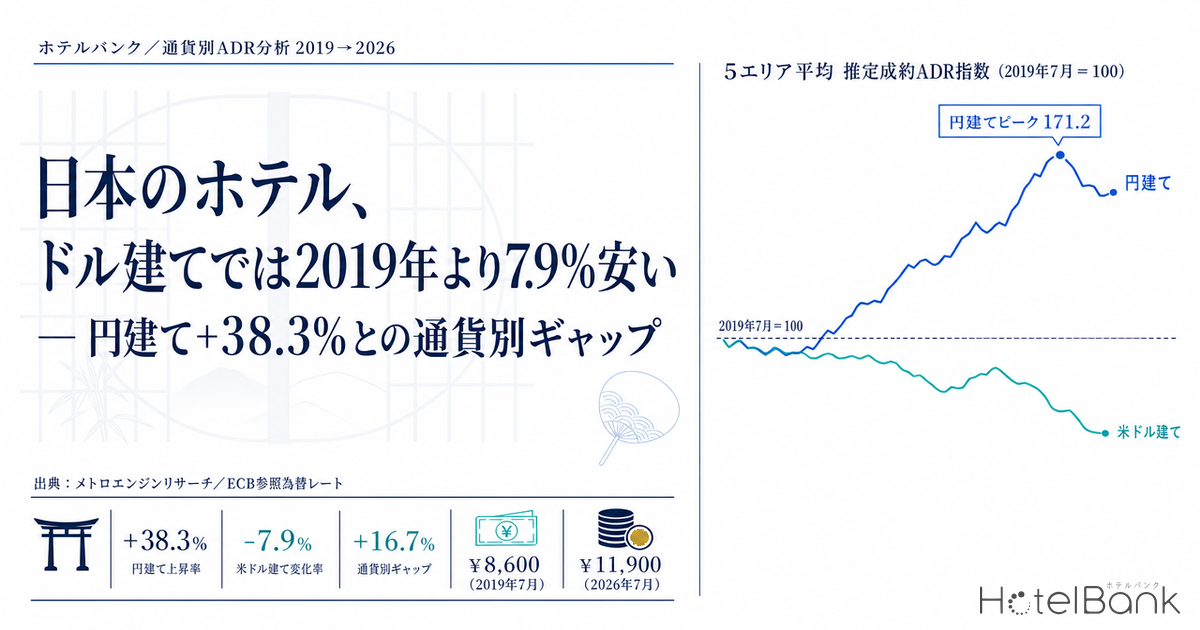
The same guest room can be either a room that has become 40% more expensive in seven years or a room that is cheaper than it was seven years ago, depending on the currency you look at it in. Comparing MetroEngines Research data on estimated settled ADR across five major areas (Tokyo, Kyoto, Osaka, Hokkaido and Okinawa) between July 2019 and July 2026, the figure is +38.3% in yen terms — but -7.9% in US dollars and -9.2% in Chinese yuan, both below pre-pandemic levels. Only the Korean won reading is higher, at +16.7%. This article quantifies that currency-by-currency gap using actual monthly average exchange rates.
Metric Definitions Used in This Article
- ADR (average daily rate): The lowest published plan rate each property lists on OTAs and other booking sites (double occupancy, per room, tax included), adjusted by a property-type correction factor to derive an estimated settled rate (tax-excluded equivalent). Median error versus property-level actuals disclosed by listed hotel REITs is roughly 7%. These are estimates and differ from each property’s actual transacted rates or accounting figures. Area-level ADR is the median across covered properties (the level of a typical property in that area).
- Five-area average: The simple, equally weighted average of the median estimated settled ADR for Tokyo, Kyoto, Osaka, Hokkaido and Okinawa. No weighting by lodging demand volume is applied.
- Foreign-currency conversion: Values divided by each month’s monthly average exchange rate. For the US dollar, Korean won, Chinese yuan and Australian dollar we use the monthly average of the European Central Bank (ECB) daily reference rates; the Taiwan dollar is derived from the Central Bank of the Republic of China (Taiwan) monthly average interbank closing rate for NTD against USD together with the monthly average USD/JPY rate.
- Data source: MetroEngines Research
- — +38.3% in yen / -7.9% in US dollars — The five-area average estimated settled ADR went from ¥8,593 in July 2019 to ¥11,888 in July 2026. The same room carries the opposite sign depending on currency.
- — The Korean won is the only currency above 2019 (+16.7%) — The yen fell 18.5% against the won, far less than 50.2% against the US dollar and 52.4% against the yuan, so rate increases land almost fully on Korean travelers.
- — Tokyo is the only area above 2019 in US dollar terms (+3.7%) — Kyoto -16.4%, Osaka -15.8% and Okinawa -9.7% all became cheaper in foreign currency despite yen increases of 20-30%.
- — Osaka’s -30.7% is Expo payback — July 2026’s ¥8,761 is just -1.3% versus July 2024, before the Expo, so it reads as normalization to the pre-Expo level.
- — The discount comes from FX, not from pricing policy — The US dollar index went from 121.4 in April 2025 to 92.1 in July 2026. Holding yen rates flat, a return to ¥130/USD would lift it back to 115.2.
+38% in Yen, -8% in Dollars — The Same Room Shows Opposite Faces by Currency
Start with the overall picture. The five-area average estimated settled ADR was ¥8,600 in July 2019 and ¥11,900 in July 2026. In yen that is +38.3% — roughly a 40% increase over seven years. On that number alone, there is no doubt that Japanese hotels have pushed price increases through.
Yet the picture reverses when the same two months are restated in the currencies inbound travelers actually pay in. In US dollars it moved from $79.4 to $73.2, or -7.9%, and in Chinese yuan from CNY 546 to CNY 496, or -9.2%. In Australian dollars it is -7.6% and in Taiwan dollars -4.6%. None of these reach the July 2019 level, because the yen’s decline has outpaced the size of the increases made in yen.
The one exception is the Korean won. From ₩93,451 to ₩109,073, or +16.7%, meaning that only for travelers from Korea are Japanese hotels “more expensive than seven years ago.” The reason is discussed below, but the won itself also weakened against the US dollar, so Korea has captured less of the weak-yen benefit than other markets.
Figure 1: Estimated settled ADR index for the five-area average (July 2019 = 100) — by currency
Source: MetroEngines Research; compiled by the HotelBank Editorial Team (covered properties: N=3,318 in July 2019 / N=3,847 in July 2026)
Figure 1 traces the index with July 2019 set to 100. The yen series (navy) accelerated from the second half of 2022 and peaked at 171.2 in November 2025. The dollar series (blue) sank to 60.3 in June 2022 and, even after recovering, stands at just 92.1 as of July 2026. A price that rose 70% in yen over seven years is still 8 points below its 2019 level in dollars.
The dollar index was above 100 only briefly, in the spring of 2025. The five-area average dollar index hit a high of 121.4 in April 2025, then gave that back to 92.1 in a little over a year as the yen weakened further. The sense overseas that “Japan has become expensive” did not last, because it was FX rather than pricing that pushed the level back down.
The Yen Fell 52% Against the Yuan and 50% Against the Dollar — but Only 19% Against the Won
The differences between currencies come down entirely to how far the yen fell against each one. Comparing monthly average rates for July 2019 and July 2026, the yen fell 52.4% against the Chinese yuan, 50.2% against the US dollar, 49.7% against the Australian dollar and 44.9% against the Taiwan dollar. Against the Korean won, the decline was just 18.5%.
Figure 2: Decline in the yen (July 2019 → July 2026, monthly average rates)
Source: European Central Bank (ECB) reference exchange rates and the Central Bank of the Republic of China (Taiwan) closing interbank rate for NTD against USD; compiled by the HotelBank Editorial Team
| Currency | July 2019 | July 2026 | Yen decline |
|---|---|---|---|
| US dollar | ¥108.2098 | ¥162.4868 | +50.2% |
| Taiwan dollar | ¥3.4806 | ¥5.0451 | +44.9% |
| Korean won | ¥0.092 | ¥0.109 | +18.5% |
| Chinese yuan | ¥15.736 | ¥23.9801 | +52.4% |
| Australian dollar | ¥75.5932 | ¥113.1667 | +49.7% |
Source: European Central Bank (ECB) reference exchange rates and the Central Bank of the Republic of China (Taiwan) closing interbank rate for NTD against USD; compiled by the HotelBank Editorial Team
The won is the exception because the won itself fell against the US dollar. USD/KRW moved from a monthly average of ₩1,176.8 per dollar in July 2019 to ₩1,490.8 in July 2026 — a 21.1% weakening on the won side. Because both the yen and the won fell against the dollar, only an 18.5% decline remains in the yen-won cross. As a result, the Korean market alone absorbs close to the full extent of Japanese hotel rate increases.
This structure is hard to dismiss given that Korea is one of Japan’s largest inbound markets. According to the Japan National Tourism Organization (JNTO), 3,148,600 international visitors arrived in June 2026 (-6.8% year on year), bringing the first-half total to 21,084,800, with 15 markets including Taiwan, Korea and the US posting record Junes. Even in markets where volume is growing, how price feels differs widely by market. Holiday demand in the Korean market is covered in our article on Chuseok and the second wave after Silver Week.
By Area, Tokyo Is the Only One Above 2019 in Dollar Terms
Looking at the five areas individually, every one exceeds its July 2019 level in yen terms, but only Tokyo clears 2019 in dollars.
| Area | July 2019 (JPY) | July 2026 (JPY) | Yen | US dollar | Taiwan dollar | Korean won | Chinese yuan | Australian dollar | Covered properties 2019/2026 |
|---|---|---|---|---|---|---|---|---|---|
| Tokyo | ¥8,120 | ¥12,642 | +55.7% | +3.7% | +7.4% | +31.3% | +2.2% | +4.0% | 998 / 1,136 |
| Kyoto | ¥9,686 | ¥12,161 | +25.6% | -16.4% | -13.4% | +5.9% | -17.6% | -16.1% | 474 / 604 |
| Osaka | ¥6,928 | ¥8,761 | +26.5% | -15.8% | -12.8% | +6.7% | -17.0% | -15.5% | 575 / 647 |
| Hokkaido | ¥8,111 | ¥12,156 | +49.9% | -0.2% | +3.4% | +26.4% | -1.7% | +0.1% | 835 / 952 |
| Okinawa | ¥10,120 | ¥13,722 | +35.6% | -9.7% | -6.5% | +14.4% | -11.0% | -9.4% | 436 / 508 |
| Five-area average | ¥8,593 | ¥11,888 | +38.3% | -7.9% | -4.6% | +16.7% | -9.2% | -7.6% | 3,318 / 3,847 |
Source: MetroEngines Research; compiled by the HotelBank Editorial Team
Tokyo rose from ¥8,100 to ¥12,600, up 55.7% — the largest gain among the five areas — and edged above 2019 in dollars as well, from $75.0 to $77.8 (+3.7%). Hokkaido was +49.9% in yen and -0.2% in dollars, essentially flat. Kyoto (-16.4% in dollars), Osaka (-15.8%) and Okinawa (-9.7%) sit clearly below 2019 in dollar terms even though they raised yen rates by 20% to more than 30%.
Figure 3: Rate of change by area (yen / US dollar / Korean won)
Source: MetroEngines Research; compiled by the HotelBank Editorial Team (covered properties: N=3,318 in July 2019 / N=3,847 in July 2026)
Figure 3 shows how the sign flips by currency within the same area. Kyoto is +25.6% in yen against -16.4% in dollars — a 42-point spread. The smaller the yen increase in an area, the deeper the discount in foreign currency. Put the other way, only Tokyo and Hokkaido, which delivered yen increases above 50%, held their 2019 level on a foreign-currency basis.
Osaka Is Mid-Payback From the Expo — July 2026 Is Back at the Pre-Expo Level
Reading Osaka’s numbers requires separating out the payback from Expo 2025 Osaka, Kansai. The Expo ran for 184 days, from April 13 to October 13, 2025, drawing 29.02 million cumulative visitors (25.58 million excluding AD-pass entries). Osaka’s estimated settled ADR was lifted substantially while it was open.
Figure 4: Monthly estimated settled ADR for Osaka (year overlay)
Source: MetroEngines Research; compiled by the HotelBank Editorial Team (Osaka covered properties: N=575 in July 2019 / N=647 in July 2026)
The April-October average during the Expo period was ¥13,100 in 2025 against ¥9,200 in the same months of 2024 — roughly 43% higher while the Expo was running. July 2026 came in at ¥8,800, down 30.7% from ¥12,600 a year earlier. Against July 2024, before the Expo, the gap is only -1.3%. In other words, Osaka’s “decline” is best read as normalization to the pre-Expo level.
Osaka’s -15.8% in dollars in Table 2 therefore combines the FX effect with the trough of the post-Expo payback. Even excluding Osaka, the four-area average dollar index for July 2026 is 93.7 — still below 2019 — so the conclusion that prices have become cheaper in foreign-currency terms holds with or without Osaka.
Tokyo’s Seasonality — Peaks in April and November, a Trough in June-July, and the Shape Has Not Changed
The seven-year comparison is July against July, so seasonality does not distort it. Still, it is worth noting that the impression changes depending on which month you take. Overlaying Tokyo’s monthly series by year shows price levels stepping up each year while the shape of the year stays almost constant.
Figure 5: Monthly estimated settled ADR for Tokyo (year overlay)
Source: MetroEngines Research; compiled by the HotelBank Editorial Team (Tokyo covered properties: N=998 in July 2019 / N=1,136 in July 2026)
Peaks in April and November with a trough from June into July have been consistent since 2023. April 2026 was ¥17,800, the yearly high, and June was ¥12,100, the yearly low — a 47% spread within a single year. July sits among the lowest months of the year, which makes a July-to-July comparison one taken at the most conservative point in the calendar.
Markets Where Price Is Not a Constraint, and Markets Where It Is Becoming One
Organizing the numbers so far from an operator’s perspective shows that the issues worth examining differ by market.
In the US dollar, Chinese yuan, Australian dollar and Taiwan dollar blocs, Japanese hotel prices sit roughly 5-9% below their 2019 level (from -4.6% in Taiwan dollars to -9.2% in Chinese yuan). For these travelers, price is unlikely to be what constrains a visit. Arrivals from China were roughly halved year on year in March 2026, but JNTO cites travel advisories and reduced flight capacity as the background, so that needs to be kept separate from price. In yuan terms Japanese hotels are 9.2% cheaper than in 2019, so the price hurdle is low whenever demand returns.
The Korean market is the one market where price has clearly become heavier in practice. It is +16.7% in won, and for Tokyo alone ₩88,307 to ₩115,987, or +31.3% — a gain of more than 30% in seven years. Given the short-haul, high-frequency, short-stay profile of Korean travel, higher rates tend to show up as shorter stays or a downward shift in property grade. This is where there is room for plan design that accounts for price elasticity.
The Japan Tourism Agency’s inbound consumption survey puts travel spending at ¥244,000 per person for the April-June 2026 quarter (+3.3% year on year), with lodging the largest expense category. Total lodging spend is growing, but whether that growth reflects higher rates or changes in nights and party size differs by market. The distance between consumption totals and ADR is set out in our article comparing April-June lodging spend with real-world ADR.
The other point worth holding onto is that this discount is produced by FX rather than by anything Japanese operators have done. The dollar index in Figure 1 climbed to 121.4 in April 2025 and returned to 92.1 in a little over a year. If the yen strengthens, foreign-currency prices rise without operators in Japan doing anything at all. The current foreign-currency discount is best treated as a temporary state tied to the FX regime, not as structural competitiveness. The effect of a USD/JPY level near 160 on the top of the rate spectrum is examined in our article on ultra-high-rate ryokan demand.
FX Sensitivity — Even With Yen Rates Held Flat, ¥130/USD Puts the Dollar Index Back Above 2019
This “it depends on FX” quality can be shown as a range by substituting the conversion mechanically. Holding the five-area average estimated settled ADR at its July 2026 level of ¥11,888 and moving only the exchange rate gives the following. The base is $79.4 in July 2019 (¥8,593 at ¥108.2098/USD), indexed to 100.
| Five-area average yen ADR \ per USD | ¥130 | ¥145 | ¥162.5 | ¥175 | ¥190 |
|---|---|---|---|---|---|
| ¥10,700 | 103.6 | 92.9 | 82.9 | 77.0 | 70.9 |
| ¥11,300 | 109.5 | 98.1 | 87.6 | 81.3 | 74.9 |
| ¥11,888 July 2026 actual | 115.2 | 103.2 | 92.1 | 85.5 | 78.8 |
| ¥12,500 | 121.1 | 108.6 | 96.9 | 89.9 | 82.8 |
| ¥13,100 | 126.9 | 113.8 | 101.5 | 94.3 | 86.8 |
Source: MetroEngines Research; compiled by the HotelBank Editorial Team. Index = (yen ADR / yen per USD) / $79.4 x 100. Shaded cells are 100 or above (at or above the July 2019 level); the outlined cell is the July 2026 actual.
The 92.1 in the middle of the outlined area is the July 2026 actual. Even a 10% increase in yen ADR (to ¥13,100) reaches only 101.5 at ¥162.5/USD — barely back to the 2019 level. Conversely, holding yen rates flat while the rate returns to ¥130/USD lifts the index to 115.2. The size of that range is what shows the foreign-currency discount depends far more on FX than on pricing policy. Note that this table is a mechanical combination of yen ADR and FX levels; it is neither an FX forecast nor a price forecast, and it does not incorporate demand-side responses such as changes in length of stay or property grade.
Methodology and Caveats
The estimated settled ADR in this article is calculated from those properties, among roughly 168,000 domestic properties tracked by MetroEngines Research, whose activity can be confirmed on OTAs and other booking sites. Covered properties total 3,318 across the five areas in July 2019 and 3,847 in July 2026. Area-level values are the median of each property’s daily average price, not a simple mean.
Across the 85 months from July 2019 to July 2026, none of the five areas showed missing months or extreme drops in covered property counts (the minimum monthly count for each area is at least 85% of its median). All months are settled past months; no estimates based on forward listed prices are included.
The “yen decline” used here is calculated as the rate of increase in the yen price of one unit of foreign currency (how many percent more yen are needed to obtain the same amount of foreign currency). Note that this differs in definition from the loss in the yen’s own value as seen from the foreign currency (33.4% against the US dollar). All FX conversion uses monthly average rates. Because the rates travelers actually receive when exchanging money or paying include fees, the discount or premium they perceive will not match the figures here. This article also covers room rates only; it is not a comparison of total trip cost including airfare and on-the-ground spending. The area average is an equally weighted simple average of the five areas with no weighting by lodging demand volume, so it differs from a national average for Japan.
Frequently Asked Questions
Q. How different are Japanese hotel prices in yen versus in US dollars?
A. The five-area average estimated settled ADR (Tokyo, Kyoto, Osaka, Hokkaido, Okinawa) rose 38.3% in yen terms, from ¥8,593 in July 2019 to ¥11,888 in July 2026. Converting the same two months into US dollars gives $79.4 to $73.2, or -7.9%; in Chinese yuan -9.2%, in Australian dollars -7.6% and in Taiwan dollars -4.6% — all below the July 2019 level. The yen’s decline has outpaced the size of the increases made in yen.
Q. Why is the Korean won the only currency showing an increase?
A. Because the yen fell by different amounts against different currencies. Comparing monthly average rates for July 2019 and July 2026, the yen fell 52.4% against the Chinese yuan, 50.2% against the US dollar, 49.7% against the Australian dollar and 44.9% against the Taiwan dollar, but only 18.5% against the Korean won. The won itself also weakened 21.1% against the US dollar, offsetting the weak-yen effect. The result in won terms is ₩93,451 to ₩109,073, or +16.7%, so the Korean market alone absorbs close to the full rate increase.
Q. Which areas are above their 2019 level in US dollar terms?
A. Tokyo alone among the five major areas. Tokyo went from ¥8,120 to ¥12,642 in yen (+55.7%) and from $75.0 to $77.8 in US dollars (+3.7%), above July 2019. Hokkaido is -0.2% in dollars, essentially flat, while Kyoto -16.4%, Osaka -15.8% and Okinawa -9.7% remain below 2019 in dollars even though yen rates rose 20-30%.
Q. Does Osaka’s decline mean rates were cut?
A. It is better read as normalization to the pre-Expo level. During the Expo 2025 Osaka, Kansai run (April 13 – October 13, 2025), Osaka’s average estimated settled ADR for April-October was ¥13,100 in 2025, roughly 43% above the ¥9,200 of the same months a year earlier. July 2026’s ¥8,761 is -30.7% year on year, but only -1.3% against July 2024, before the Expo.
Q. How much do foreign-currency prices move when FX moves?
A. Holding yen ADR at its July 2026 level of ¥11,888, the index is 92.1 at ¥162.4868/USD (July 2019 = 100), 115.2 at ¥130/USD and 78.8 at ¥190/USD. Even a 10% yen increase (to ¥13,100) reaches only 101.5 at ¥162.5/USD, barely back to the 2019 level. This calculation is a mechanical combination of yen ADR and FX levels; it is neither an FX forecast nor a price forecast.
Q. What exactly is the estimated settled ADR used here?
A. It is an estimated settled rate (tax-excluded equivalent), derived from the lowest published plan rate each property lists on OTAs and other booking sites (double occupancy, per room, tax included) with a property-type correction factor applied. Median error versus property-level actuals disclosed by listed hotel REITs is roughly 7%. Area-level values are the median across covered properties; as of July 2026 the five areas cover N=3,847 properties.
Related Reading
- USD/JPY Nears 160 x Japan Summer 2026 Inbound: Tipping Point for Ultra-Luxury Ryokan Demand
- Lodging Is 37% of Japan’s ¥2.51T Inbound Spend: ¥10,446 vs Real ADR
- Summer Resort 3-Region Comparison 2026: Niseko, Okinawa, Karuizawa ADR & FX Sensitivity
- US Now Tops Japan Inbound at 13.5% — Prefecture Host Map 2026
References and Sources
■ Data sources
Monthly estimated settled ADR series for the five major areas (Tokyo, Kyoto, Osaka, Hokkaido, Okinawa) from July 2019 to July 2026 (85 months), taken from lodging price data covering roughly 168,000 domestic properties tracked by MetroEngines Research. Covered properties: N=3,318 in July 2019 and N=3,847 in July 2026. FX is the monthly average of European Central Bank (ECB) daily reference rates; the Taiwan dollar is derived from the Central Bank of the Republic of China (Taiwan) monthly average against the US dollar combined with the monthly average USD/JPY rate.
■ Calculation assumptions
The area average is an equally weighted simple average of the five areas’ median estimated settled ADR (no weighting by lodging demand volume). All foreign-currency conversion uses monthly average rates, and the index is set to July 2019 = 100. The sensitivity in Table 3 is a mechanical combination of yen ADR and FX levels — neither an FX forecast nor a price forecast — and does not incorporate demand-side responses.
■ Limitations and caveats
Estimated settled ADR is an estimate derived by applying property-type correction factors to prices published on OTAs and other sites; median error against property-level actuals disclosed by listed hotel REITs is roughly 7%, and it differs from each property’s actual transacted rates or accounting figures. Exchange and payment fees are excluded, so it will not match what travelers experience. Only room rates are covered; this is not a comparison of total trip cost including airfare and on-the-ground spending. Osaka’s figures include the payback phase following Expo 2025 Osaka, Kansai (April 13 – October 13, 2025).
■ Lodging price data
- MetroEngines Research — Monthly estimated settled ADR series for the five major areas (July 2019 – July 2026; N=3,847 covered properties as of July 2026)
■ Exchange rates
- European Central Bank (ECB) Euro foreign exchange reference rates — Monthly averages calculated from daily reference rates for the US dollar, Korean won, Chinese yuan and Australian dollar
- Central Bank of the Republic of China (Taiwan), “Closing Interbank Rate of NTD against USD — Monthly,” 2019(July 2019 monthly average 31.089 NTD/USD)
- Central Bank of the Republic of China (Taiwan), “Closing Interbank Rate of NTD against USD — Monthly,” 2026(July 2026 monthly average 32.207 NTD/USD)
■ Government statistics and public data
- Japan National Tourism Organization (JNTO), “Foreign Visitors to Japan (June 2026 estimate)”
- Japan National Tourism Organization (JNTO), “Foreign Visitors to Japan (March 2026 estimate)”
- Japan Tourism Agency, “Consumption Trend Survey for Foreigners Visiting Japan, April-June 2026 (First Preliminary Report)”
- EXPO 2025 Osaka, Kansai official site, “Looking Back at Expo 2025 Through Data”