

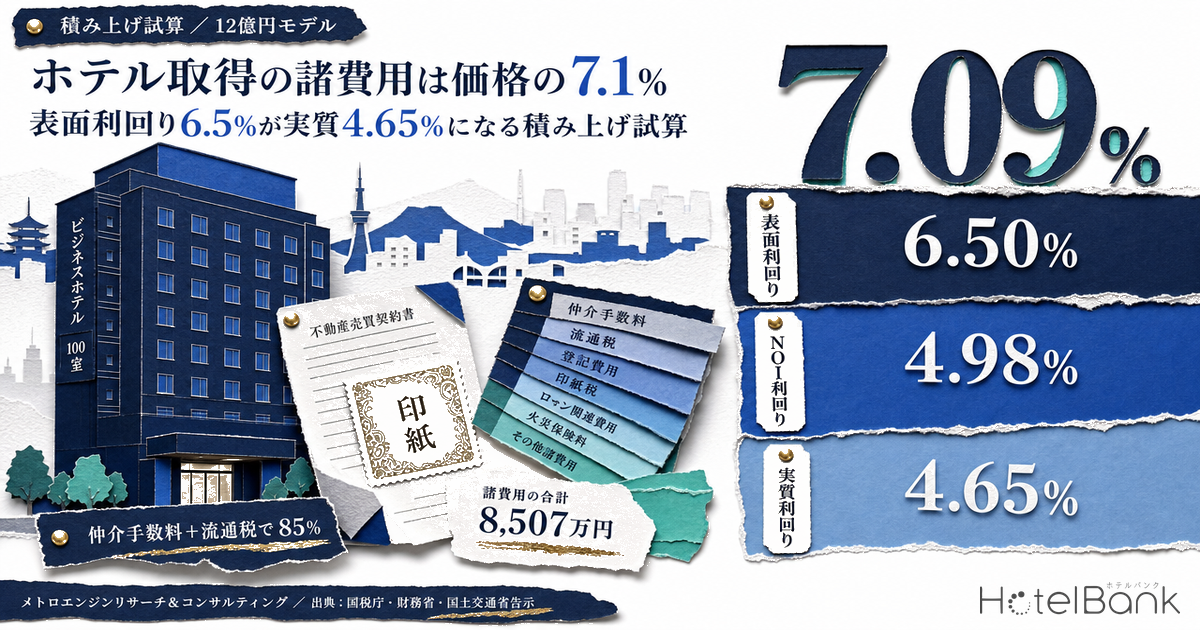
When you buy a hotel, the figure written into the purchase agreement is not the total you pay. Brokerage commission, real estate acquisition tax, registration and licence tax, stamp duty, judicial scrivener fees, due diligence costs, financing fees — these line items stack up outside the price, and for a ¥1.2bn limited-service hotel they total ¥85.07mn, or 7.09% of the price. That amount equals 1.42 years of first-year NOI.
This article builds those acquisition costs up one by one from primary sources (National Tax Agency, Ministry of Finance, prefectural tax ordinances, MLIT public notices), then breaks down how a property advertised at a “6.50% gross yield” is whittled down to a 4.98% NOI yield and a 4.65% net yield once acquisition costs enter the denominator. It also calculates the holding period at which converting to a trust beneficiary interest — which compresses transfer taxes — stops paying for itself.
Metric Definitions Used in This Article
- Gross yield: Annual rental income ÷ property price. The crudest yield measure — neither operating expenses nor acquisition costs are deducted. This is normally the figure quoted in property listings.
- NOI yield: NOI ÷ property price. NOI (Net Operating Income) = annual rental income less operating expenses such as fixed asset tax and city planning tax, insurance premiums, asset management / property management fees, and reserves for FF&E (furniture, fixtures and equipment) and major repairs. Before depreciation and before tax.
- Net yield (including acquisition costs): NOI ÷ (property price + acquisition costs). The ratio of annual net income to the total amount actually invested.
- ADR (average daily rate): An estimated settled rate (tax-exclusive equivalent) derived by applying category-specific adjustment factors to the lowest published plan rate each property posts on OTAs and similar channels (double occupancy, per-room rate, tax-inclusive). Cross-checked against property-level results disclosed by listed hotel REITs (91 properties, most recent three months), the median error is roughly 7%. These are estimates and differ from each property’s actual transacted rates or accounting figures. Area-level ADR is the median across the target properties (the level of a typical property in that area).
- Data sources: MetroEngines Research & Consulting / National Tax Agency, Ministry of Finance, Ministry of Internal Affairs and Communications, prefectural tax ordinances, MLIT public notices / Japan Real Estate Institute / individual REIT official IR disclosures
- — Acquisition costs run 7.09% of the property price. For a ¥1.2bn limited-service hotel that is ¥85.07mn — 1.42 years of the ¥59.77mn first-year NOI.
- — 85% of that is brokerage commission at 3.31% and transfer taxes at 2.69%. Scaling the deal from ¥300mn to ¥3.0bn moves the ratio only from 7.66% to 6.95% — less than one point.
- — Hotels do not qualify for residential tax reductions. Acquisition tax on the building is the statutory 4% and the ownership transfer registration is the statutory 2.0%. Borrowing rates from residential guides produces an under-estimate.
- — The advertised 6.50% gross yield falls to 4.98% once operating expenses are deducted, and to 4.65% once acquisition costs enter the denominator.
- — Converting to a trust beneficiary interest erases ¥32.22mn of transfer taxes but adds an annual trust fee. At ¥4mn a year, the break-even against a direct real estate purchase is roughly 8.1 years.
The Conclusion — ¥85.07mn Outside the Price on a ¥1.2bn Hotel, or 1.42 Years of First-Year NOI
The figures come from this article’s model property — a limited-service hotel in a regional core city, 100 rooms, purchase price ¥1.2bn, LTV 70%. Every assumption is set out in “Calculation Assumptions” at the end of the article. Three structural points matter here.
First, the breakdown of acquisition costs is essentially decided by brokerage commission and transfer taxes. In the ¥1.2bn model, brokerage commission is 3.31% and transfer taxes — real estate acquisition tax plus registration and licence tax on the ownership transfer — are 2.69%. Those two alone come to 6.00%, which is 85% of the ¥85.07mn total. The line items that appear on quotations, such as due diligence and judicial scrivener fees, are small in absolute terms. A small amount does not mean a small consequence, though. Misreading the legal form of a hot spring source in a ryokan acquisition, for instance, moves the valuation itself — a structure covered in detail in Who Owns the Hot Spring? Water Rights and Ryokan Valuation.
Second, the erosion barely changes across price bands. Across the three cases discussed below — ¥300mn, ¥1.2bn and ¥3.0bn — the cost ratio lands at 7.66%, 7.09% and 6.95%, a spread of less than one point. The main line items scale with price; the difference comes only from the relatively heavier weight of fixed-ish items such as due diligence and scrivener fees on smaller deals. On the acquisition-cost side, “buying bigger makes you more efficient” is a limited effect.
Third, transfer taxes can be compressed through a trust beneficiary interest, but not for free. Acquire the trust beneficiary interest rather than the real estate itself and no acquisition tax applies, while registration and licence tax is just ¥1,000 per property for the change-of-beneficiary registration. In the ¥1.2bn model that is a ¥32.22mn saving. Against that, a trust fee runs for the whole holding period: at ¥4mn a year it consumes the saving in about eight years. Short hold favours the beneficiary interest; long hold favours direct ownership.
Terminology — Gross, NOI and Net Yield: What Has Been Subtracted from Each
The usual stumbling block in a first hotel investment review is that the single word “yield” refers to three or more different calculations. If a property memorandum says only “yield 6.5%”, comparing it without first establishing what has been deducted makes any real investment judgement impossible.
| Metric | Formula | What is deducted | Model value |
|---|---|---|---|
| Gross yield Gross basis | Annual rental income ÷ property price | Nothing. Neither vacancy loss, operating expenses nor acquisition costs are reflected | 6.50% |
| NOI yield Net basis | NOI ÷ property price | Operating expenses — property and city planning tax, insurance, AM/PM fees, FF&E reserves (before depreciation) | 4.98% |
| Net yield Incl. acquisition costs | NOI ÷ (property price + acquisition costs) | Operating expenses, plus acquisition costs added to the denominator | 4.65% |
| Expected yield Capitalisation rate | NOI ÷ market price | The return investors require from the asset. The discount rate used when backing out a price | Tokyo 4.1% |
Of these, the one investors use as common ground is the NOI yield. The “expected yield” published in the Japan Real Estate Institute’s investor survey likewise refers to single-year net operating income divided by price. Comparing “a property at 6.5% gross” against “a market at 4.5% expected yield” is therefore meaningless. To put them on the same footing you first have to deduct operating expenses and move to an NOI basis.
And this article’s subject lies one step beyond that. The NOI yield adjusts the numerator for operating expenses, but the amount actually invested is not the property price — it is the property price plus acquisition costs. How far the yield moves when the denominator is replaced with the real outlay is the true measure of what acquisition costs do to investment performance.
Build-Up 1: The Full Breakdown — ¥85.07mn on a ¥1.2bn Hotel
The model property is a 100-room limited-service hotel in a regional core city at a purchase price of ¥1.2bn (¥12mn per room). Land and building are split 35% / 65%, and debt is ¥840mn at 70% LTV. On these assumptions, here is everything that stacks up outside the price.
| Item | Basis of calculation | Amount | % of price |
|---|---|---|---|
| Brokerage commission | (¥1.2bn × 3% + ¥60,000) × 1.1 | ¥39.67mn | 3.31% |
| Acquisition tax (land) | Assessed value ¥294mn × 1/2 × 3% | ¥4.41mn | 0.37% |
| Acquisition tax (building) | Assessed value ¥390mn × 4% | ¥15.60mn | 1.30% |
| Registration & licence tax (land, ownership transfer) | Assessed value ¥294mn × 1.5% | ¥4.41mn | 0.37% |
| Registration & licence tax (building, ownership transfer) | Assessed value ¥390mn × 2.0% | ¥7.80mn | 0.65% |
| Registration & licence tax (mortgage creation) | Debt ¥840mn × 0.4% | ¥3.36mn | 0.28% |
| Stamp duty (purchase agreement) | Over ¥1bn up to ¥5bn, after reduction | ¥0.32mn | 0.03% |
| Stamp duty (loan agreement) | Over ¥500mn up to ¥1bn, no reduction | ¥0.20mn | 0.02% |
| Loan arrangement fee | Debt ¥840mn × 0.5% | ¥4.20mn | 0.35% |
| Judicial scrivener fees | Practical benchmark (varies with number of registrations) | ¥0.60mn | 0.05% |
| Due diligence | Building condition survey, appraisal, environmental, legal / financial | ¥4.50mn | 0.38% |
| Total | — | ¥85.066mn | 7.09% |
Brokerage commission at 3.31% and transfer taxes at 2.69% (acquisition tax 1.67% + ownership transfer registration 1.02%) account for 6.00% — 85% of total acquisition costs. Put the other way round: know the level of these two items and you can, in practice, forecast almost the whole acquisition cost.
Brokerage commission is capped by an MLIT public notice issued under the Real Estate Brokerage Act. On the portion of the price above ¥4mn, the cap is “sale price × 3% + ¥60,000” (consumption tax additional). At ¥1.2bn that is ¥36.06mn, or ¥39.67mn including consumption tax. A notice amendment dated 21 June 2024 raised the special cap for low-value vacant properties (¥8mn or less) to ¥330,000 including tax, but that virtually never applies to hotel deals. Because it is a cap rather than a fixed amount, whether the seller or the buyer bears the commission — and whether the agent works one side or both — is a matter for individual negotiation.
Real estate acquisition tax is a prefectural tax, and for a hotel the key point is that the rate splits between land and building. Land acquired on or before 31 March 2027 is taxed at 3% (statutory 4%), and for residential-zoned land the tax base is further compressed to half the fixed asset tax assessed value. Buildings, by contrast, qualify for the 3% concession only where they count as “residential” — hotels and ryokan are non-residential structures and are taxed at the full statutory 4%. That asymmetry is why the ¥15.60mn of acquisition tax on the building in the model is 3.5 times the ¥4.41mn on the land.
Build-Up 2: The Rates from Primary Sources — Statutory Rates, Concessions and Expiry Dates
The easiest mistake when estimating acquisition costs is applying residential concessions to a hotel. Take the rates straight from an explainer written for individual homebuyers and you will under-estimate the building’s acquisition tax by 1 point and its registration and licence tax by as much as 1.7 points. Below are the rates and expiry dates that actually apply to a hotel acquisition.
| Tax | Subject | Statutory | Concession | Expiry | Available to hotels |
|---|---|---|---|---|---|
| Real estate acquisition tax | Land | 4% | 3% | 31 March 2027 | Available |
| Building (residential) | 4% | 3% | 31 March 2027 | — | |
| Building (non-residential) | 4% | None | — | Statutory 4% applies | |
| Tax base (residential-zoned land) | Assessed value | Assessed value × 1/2 | 31 March 2027 | Available | |
| Registration & licence tax | Land, ownership transfer by sale | 2.0% | 1.5% | 31 March 2029 | Available |
| Building, ownership transfer by sale | 2.0% | 0.3% for residential buildings only | 31 March 2027 | Statutory 2.0% applies | |
| Mortgage creation | 0.4% | 0.1% for residential buildings only | 31 March 2027 | Statutory 0.4% applies | |
| Land, registration of trust of ownership | 0.4% | 0.3% | 31 March 2029 | Applies on trust creation | |
| Registration of change of trust beneficiary | ¥1,000 per property | — | — | Applies on transfer of the interest | |
| Stamp duty | Real estate transfer agreement (over ¥1bn up to ¥5bn) | ¥400,000 | ¥320,000 | 31 March 2027 | Available |
| Loan agreement (over ¥500mn up to ¥1bn) | ¥200,000 | None | — | Statutory rate applies |
Two points on timing deserve attention. First, the land concession on registration and licence tax (2.0% → 1.5%) has been extended by three years to 31 March 2029. The extension came with the fiscal 2026 tax reform and covers both ownership transfer registration on land sales and registration of a trust of land ownership. Second, the 3% land rate for real estate acquisition tax and the half-value tax base for residential-zoned land both expire on 31 March 2027. Whether they are extended is not yet settled. If both lapsed, acquisition tax on the model property’s land would rise from ¥4.41mn to ¥11.76mn — an increase of ¥7.35mn. For deals whose completion straddles spring 2027, that gap is worth carrying as a schedule risk.
The other point commonly missed in practice is that there is no reduction for stamp duty on loan agreements. The stamp duty concession is limited to real estate transfer agreements and construction contracts; financing agreements are taxed at the statutory amount. The sums are not large, but budgeting on the assumption that “stamp duty is always reduced” creates a discrepancy.
Build-Up 3: By Deal Size — 7.66% at ¥300mn, 6.95% at ¥3.0bn. Little Room to Optimise
To answer “does buying a bigger property improve acquisition-cost efficiency?” with numbers, here are three cases on identical assumptions: ¥300mn (30 rooms), ¥1.2bn (100 rooms) and ¥3.0bn (150 rooms).
| Item | Case A ¥300mn 30 rooms · ¥10mn per room | Case B ¥1.2bn 100 rooms · ¥12mn per room | Case C ¥3.0bn 150 rooms · ¥20mn per room |
|---|---|---|---|
| Brokerage commission | ¥9.97mn | ¥39.67mn | ¥99.07mn |
| Real estate acquisition tax | ¥5.00mn | ¥20.01mn | ¥50.03mn |
| Registration & licence tax (transfer + mortgage) | ¥3.89mn | ¥15.57mn | ¥38.93mn |
| Stamp duty (purchase + loan) | ¥0.16mn | ¥0.52mn | ¥0.72mn |
| Loan arrangement fee | ¥1.05mn | ¥4.20mn | ¥10.50mn |
| Judicial scrivener fees | ¥0.40mn | ¥0.60mn | ¥0.90mn |
| Due diligence | ¥2.50mn | ¥4.50mn | ¥8.50mn |
| Total acquisition costs | ¥22.97mn | ¥85.07mn | ¥208.64mn |
| % of property price | 7.66% | 7.09% | 6.95% |
| Total invested | ¥322.97mn | ¥1,285.07mn | ¥3,208.64mn |
The three cases differ by only 0.71 points. The gap comes mainly from due diligence and judicial scrivener fees — items that do not scale with price and therefore weigh more heavily on smaller deals.
What this shows is that acquisition costs are hard to compress by changing deal size. Brokerage commission and transfer taxes, the dominant items, are both linear in price, so the ratio barely moves: 7.66% on a ¥300mn deal, 6.95% on a ¥3.0bn one. Economies of scale work on the operating expense side, not on acquisition cost.
Conversely, the levers that genuinely move acquisition cost are few. One is negotiating the brokerage commission (including off-market and direct-from-seller deals); the second is compressing transfer taxes through a trust beneficiary interest, discussed below; the third is the land / building allocation ratio. The allocation must be defensible for tax purposes and cannot be set arbitrarily, but its effect is not negligible. Comparing a 20% land share with a 65% one, the model property’s cost ratio moves from 7.22% to 6.82% — 0.40 points. The reason is that the building alone carries the statutory 4% acquisition tax and the statutory 2.0% transfer registration, while land is taxed at 3% on half the assessed value — an effective 0.75%.
How the Yield Is Eroded — from 6.50% Gross to 4.98% NOI to 4.65% Net
Now translate the figures so far into yields. The model property assumes a master lease to an operator on a fixed rent, with annual rental income of ¥78.0mn. Across 100 rooms that is ¥780,000 per room per year, or about ¥2,137 per room per day.
It is worth checking that rent level against market data. According to MetroEngines Research, the estimated settled ADR for business hotels in Fukuoka averaged ¥10,815 over the 13 months from July 2025 to July 2026 (N=329–341 properties per month, monthly median basis). At 80% occupancy (same period, July 2025–July 2026; this article’s assumption), RevPAR works out at roughly ¥8,600. Rent of ¥2,137 is about 25% of that — an unremarkable rent ratio for a limited-service master lease. Whether the lease is struck on a fixed or a variable rent changes both the volatility of income and how risk is shared with the operator, but that choice sits outside the acquisition-cost question and is not modelled here.
| Item | Annual | Detail |
|---|---|---|
| Annual rental income | ¥78.00mn | Fixed rent under a master lease |
| Fixed asset tax & city planning tax | −¥10.13mn | Fixed asset tax 1.4% + city planning tax 0.3% |
| Insurance premiums | −¥0.90mn | Fire, earthquake and liability |
| AM / PM fees | −¥2.50mn | Asset and property management |
| FF&E and major repair reserves | −¥4.70mn | Equivalent to 6% of rent |
| NOI (net operating income) | ¥59.77mn | Before depreciation, before tax |
From a 6.50% gross yield, deducting operating expenses gives a 4.98% NOI yield (−1.52 points); adding the ¥85.07mn of acquisition costs to the denominator gives a 4.65% net yield (−0.33 points). Acquisition costs alone shave 6.6% off the yield.
0.33 points may look small. Seen from another angle the impression changes: ¥85.07mn of acquisition costs equals 1.42 years of the ¥59.77mn first-year NOI. Before you are handed the keys, cash equivalent to one year and five months of net income has already left the building.
Spread the burden across the holding period and the effect becomes clear. Assuming a three-year hold, the annualised acquisition cost is ¥28.36mn, or 47.4% of NOI; over five years ¥17.01mn and 28.5%; over ten years ¥8.51mn and 14.2%. The shorter the intended hold, the harder acquisition costs press on total return.
| Holding period | Annualised acquisition costs | As % of first-year NOI |
|---|---|---|
| 3 years | ¥28.36mn | 47.4% |
| 5 years | ¥17.01mn | 28.5% |
| 7 years | ¥12.15mn | 20.3% |
| 10 years | ¥8.51mn | 14.2% |
Note that for tax purposes, real estate acquisition tax, registration and licence tax and stamp duty need not be capitalised into the acquisition cost of the fixed asset and may instead be expensed in the fiscal year in which they are paid (Corporation Tax Basic Circular 7-3-3-2). They are post-acquisition costs of a transfer-tax character, and a company may choose between capitalising them and expensing them. Brokerage commission, by contrast, is in principle capitalised as a cost directly required for the acquisition, and the land portion is not depreciated. Even within “acquisition costs”, the speed at which cash is recovered differs by line item.
Sensitivity — Assessed Value Alone Moves Costs from 6.70% to 7.87%
The largest source of uncertainty in the calculations so far is the level of the fixed asset tax assessed value. Both real estate acquisition tax and registration and licence tax are levied on the assessed value, not on the purchase price. The actual figure can only be confirmed from the property’s fixed asset valuation certificate, but at the pre-deal review stage an assumption is unavoidable.
| Building assessed value (as % of the allocated building amount) | Acquisition tax | Registration & licence tax | Total acquisition costs | % of price |
|---|---|---|---|---|
| 40% | ¥16.89mn | ¥14.01mn | ¥80.39mn | 6.70% |
| 50% (this article’s assumption) | ¥20.01mn | ¥15.57mn | ¥85.07mn | 7.09% |
| 60% | ¥23.13mn | ¥17.13mn | ¥89.75mn | 7.48% |
| 70% | ¥26.25mn | ¥18.69mn | ¥94.43mn | 7.87% |
| Building assessment ratio \ Land share | 20% | 35% | 50% | 65% |
|---|---|---|---|---|
| 40% | 6.74% | 6.70% | 6.65% | 6.61% |
| 50% | 7.22% | 7.09% This article’s assumption | 6.95% | 6.82% |
| 60% | 7.70% | 7.48% | 7.25% | 7.03% |
| 70% | 8.18% | 7.87% | 7.55% | 7.24% |
Across both axes the cost ratio moves within a 1.57-point band, from 6.61% to 8.18%. The effect is asymmetric: moving the building assessment ratio from 40% to 70% swings the result by 1.17 points at a 35% land share — roughly three times the 0.40-point swing from moving the land share from 20% to 65% at a 50% assessment ratio. Only the building side carries the statutory 4% acquisition tax and the statutory 2.0% transfer registration; the land side is taxed at 3% on half the assessed value, so its effective burden is lighter. In pre-deal review, the building’s assessed value deserves more attention than the allocation negotiation.
The higher the building’s assessed value, the heavier the costs. Newer buildings, with less depreciation adjustment for age, carry larger acquisition and registration taxes — in other words, the newer the building, the heavier the tax burden at acquisition. Between 40% and 70%, the cost ratio moves 1.17 points, more than the 0.71-point difference between a ¥300mn and a ¥3.0bn deal. At the review stage, understanding the assessed value should take priority over deal size. How to think about building age and the timing of renovation capital is covered in Hotels at Year 10: The Renovation Gap Is +13.6% Below 100 Rooms.
Trust Beneficiary Interests — ¥32.22mn of Transfer Taxes Disappear, but a Trust Fee Arrives Every Year
The one element of acquisition cost that can be cut structurally is transfer tax. Rather than buying the real estate itself, taking assignment of the beneficiary interest in real estate held in trust by a trust bank changes the tax treatment substantially.
First, no real estate acquisition tax is levied. The transfer of trust property from settlor to trustee is a formal transfer of ownership and is exempt under Article 73-7(3) of the Local Tax Act. And because assignment of the beneficiary interest is not itself an acquisition of real estate, a change of beneficiary does not trigger acquisition tax.
Second, no ownership transfer registration arises, so registration and licence tax largely disappears. What is required is a change-of-beneficiary registration in the trust register, at ¥1,000 per property. For three land parcels and one building, that is ¥4,000 — two or more orders of magnitude below a direct transaction that pays 1.5% on land and 2.0% on the building.
| Item | Acquired as real estate | Acquired as trust beneficiary interest | Difference |
|---|---|---|---|
| Real estate acquisition tax (land + building) | ¥20.01mn | ¥0 | −¥20.01mn |
| Registration & licence tax (ownership transfer / change of beneficiary) | ¥12.21mn | ¥0.004mn | −¥12.21mn |
| Other (brokerage, stamp duty, financing, DD, etc.) | ¥52.85mn | ¥52.85mn | — |
| Total acquisition costs | ¥85.07mn | ¥52.85mn | −¥32.22mn |
| % of property price | 7.09% | 4.40% | −2.69pt |
This is not, however, free tax planning. Holding through a trust beneficiary interest means a trust fee payable to the trust bank for the entire holding period. The amount depends on property size and the terms of the trust agreement; this article models three levels — ¥3mn, ¥4mn and ¥5mn a year.
| Annual trust fee (assumed) | Cumulative-cost break-even | NOI on beneficiary-interest acquisition | Net yield on beneficiary-interest acquisition |
|---|---|---|---|
| ¥3mn | 10.7 years | ¥56.77mn | 4.53% |
| ¥4mn (mid case) | 8.1 years | ¥55.77mn | 4.45% |
| ¥5mn | 6.4 years | ¥54.77mn | 4.37% |
| For reference: net yield on direct acquisition | 4.65% | ||
In the mid case (¥4mn a year), the break-even is about eight years. Sell within eight years and the trust beneficiary interest wins; hold beyond that and cumulative cost on direct ownership is lower.
What is interesting is that on a single-year yield measure the trust beneficiary interest looks worse. Cutting transfer taxes lowers the initial outlay (the denominator) once, whereas the trust fee reduces NOI (the numerator) every year. The mid case gives a net yield of 4.45%, 0.20 points below the 4.65% on direct acquisition. Judge on yield alone and you will misread which option is better on cash flow.
A few practical points are worth noting. Trading a trust beneficiary interest is a securities transaction under the Financial Instruments and Exchange Act, and any intermediary must be registered for Type II financial instruments business. The buyer does not need registration, but instead of the important-matters explanation required under the Real Estate Brokerage Act, it receives a pre-contract disclosure document under the Financial Instruments and Exchange Act — the procedural architecture changes. Listed REITs and private funds commonly hold in beneficiary-interest form, so if the exit is to a similar investor, staying in that form has advantages beyond the tax saved at acquisition.
Note also that placing physical real estate into a new trust incurs its own registration and licence tax on the registration of trust of ownership: 0.3% for land until 31 March 2029 (statutory 0.4%) and 0.4% for buildings, which for the model property is ¥0.88mn on the land and ¥1.56mn on the building, ¥2.44mn in total. Where the property is already in trust, that cost was borne by the seller in the past.
The Easily Missed Item — ¥70.91mn of Consumption Tax on the Building, and Bridging It
It rarely appears on an acquisition-cost schedule, but the largest single cash-flow item is consumption tax. Transfers of land are exempt, but transfers of buildings are taxable. In the model property the allocated building amount of ¥780mn (tax-inclusive) breaks down into a base price of ¥709.09mn and consumption tax of ¥70.91mn — 5.91% of the ¥1.2bn property price.
What matters to a hotel-acquiring business is that this consumption tax is in principle creditable as input tax. Input tax credit is restricted for “residential rental buildings” acquired on or after 1 October 2020 (Article 30(10) of the Consumption Tax Act), but that restriction excludes buildings clearly not to be used for residential letting, and ryokan and hotels fall into that exclusion. A taxable enterprise can therefore take the credit.
The credit or refund is only realised when the return for the taxable period is filed, however, while ¥70.91mn must be paid in cash on the completion date. How to bridge the gap between completion and refund is always an issue on a first acquisition. Tax-exempt enterprises and those using the simplified taxation regime cannot take the credit at all, so this 5.91% is added directly to acquisition cost. It is a point to confirm particularly on acquisitions by high-net-worth individuals.
Taxable enterprise (standard method)
The ¥70.91mn is creditable as input tax; hotels sit outside the residential-rental-building restriction. The only issue is bridging finance between completion and refund.
Tax-exempt / simplified taxation
No credit is available, so the ¥70.91mn is effectively added to acquisition cost. Combined with acquisition costs of 7.09%, that is about 13.0% of the price.
Land / building allocation
The higher the building share, the larger both the consumption tax and the acquisition tax. The allocation must follow a defensible basis such as the ratio of fixed asset tax assessed values, and cannot be chosen at will.
Market Context — In a World of 4.1–5.3% Expected Yields, How Far Does the Net Figure Fall?
Now set the build-up against market levels. According to the Japan Real Estate Institute’s 54th Japanese Real Estate Investor Survey (as of April 2026), expected yields for limited-service hotels are 4.1% in Tokyo, 4.5% in Kyoto, 4.5% in Osaka, 4.9% in Nagoya, 4.7% in Fukuoka, 5.0% in Sapporo, 5.0% in Naha and 5.3% in Sendai. Against the previous survey (the 53rd, as of October 2025), four districts — Tokyo, Nagoya, Kyoto and Fukuoka — fell by 0.1 points, while the rest were unchanged.
Expected yield is the ratio of NOI to property price and excludes acquisition costs. Layering on the same 7.09% used in this article’s ¥1.2bn model takes Tokyo from 4.1% to 3.83%, and even Sendai from 5.3% to 4.95%.
A falling expected yield means investors are willing to pay a higher price for the same NOI. And because both transfer taxes and brokerage commission scale with price, a rising market inflates the absolute amount of acquisition costs at the same time. Limited-service hotels in Tokyo had compressed to 4.1% as of April 2026; on a net basis including costs that is 3.83% — well below the nominal expected yield in regional core cities. For the ADR level at which new development becomes viable as funding costs rise, Policy Rate 1.00%: Break-Even ADR Across Japan’s 8 Hotel Markets works the calculation backwards across eight major markets.
So what do hotels actually trade for? Aggregating the property data disclosed by six listed hotel REITs (285 domestic properties, ownership master as of 17 August 2026), the median acquisition price per room is ¥23.11mn. The first quartile is ¥11.92mn and the third quartile ¥39.60mn — a spread of more than three times. The median acquisition price itself was ¥3.10bn.
The six investment corporations covered: Hoshino Resorts REIT, Ichigo Hotel REIT, Japan Hotel & Residential REIT, Japan Hotel REIT, Mori Trust REIT and Invincible Investment Corporation.
For a first-time hotel buyer this distribution is a set of coordinates. This article’s model property (¥12mn per room) sits near the first quartile, Case C (¥20mn per room) near the median, and Case A (¥10mn per room) in the bottom quartile. Work back from acquisition price per room to deal size, then add roughly 7% of acquisition costs on top — that is the first step of a funding plan. The procedure for backing out deal size from room count is also covered in Own a Hotel from ¥100,000 — Security Tokens Open a Third Funding Route.
Summary — Seven Numbers to Hold On To at the Review Stage
1. Acquisition costs run about 7% of price
7.66% at ¥300mn, 7.09% at ¥1.2bn, 6.95% at ¥3.0bn. Changing deal size barely moves the ratio. Reserve 7% of the price as an upfront cost in the business plan.
2. 85% of it is commission and transfer taxes
Brokerage commission 3.31%, acquisition tax 1.67%, ownership transfer registration 1.02% — 6.00% across the three. Only the commission is negotiable.
3. Hotels get no residential relief
Acquisition tax on the building is the statutory 4%, ownership transfer registration the statutory 2.0%, mortgage creation the statutory 0.4%. Borrowing residential rates produces an under-estimate.
4. 31 March 2027 is the pivot
The 3% land rate for acquisition tax and the half-value tax base for residential-zoned land both expire. If they lapse, land tax on the ¥1.2bn model rises from ¥4.41mn to ¥11.76mn.
5. The tax base is assessed value, not price
Whether the building is assessed at 40% or 70% moves the cost ratio from 6.70% to 7.87% — 1.17 points. Understanding the assessed value matters more than deal size.
6. Trust interests break even at about 8 years
They cut ¥32.22mn of transfer taxes, but a trust fee accrues every year. At ¥4mn a year the saving is offset in 8.1 years. Short hold: beneficiary interest. Long hold: direct ownership.
7. Bridging the 5.91% building consumption tax
Hotels sit outside the residential-rental-building credit restriction and can claim it, but the full amount is paid in cash at completion. Tax-exempt or simplified filers add it to acquisition cost.
How to compare properly
Always establish whether the “yield” in a property memorandum is gross, NOI or net. To compare against market expected yields, put everything on an NOI basis.
Reading the payback
Acquisition costs equal 1.42 years of first-year NOI: 47.4% of NOI on a three-year hold, 14.2% on a ten-year hold. The shorter the hold, the harder they press on total return.
Calculation Assumptions
| Item | Assumption |
|---|---|
| Model property | Regional core city, limited-service hotel, 100 rooms, purchase price ¥1.2bn (¥12mn per room) |
| Land / building allocation | Land 35% / building 65% |
| Fixed asset tax assessed value | Land = 70% and building = 50% of the allocated amount (in practice this must be confirmed from the fixed asset valuation certificate) |
| Debt terms | LTV 70% (debt ¥840mn); loan arrangement fee 0.5% of the loan amount |
| Judicial scrivener fees | ¥0.60mn (practical benchmark, varies with the number of registrations) |
| Due diligence | ¥4.50mn (indicative total for building condition survey, appraisal, environmental and legal / financial review) |
| Annual rental income | ¥78.0mn (fixed rent under a master lease to an operator) |
| Fixed asset tax & city planning tax | ¥10.13mn per year (fixed asset tax standard rate 1.4% + city planning tax maximum rate 0.3%; for land, the tax base is assumed at 70% of assessed value reflecting the burden adjustment for commercial land) |
| Other operating expenses | Insurance ¥0.90mn, AM / PM fees ¥2.50mn, FF&E and major repair reserves ¥4.70mn (6% of rent) |
| Trust fee | Three levels: ¥3mn / ¥4mn / ¥5mn per year (¥4mn as the mid case) |
| Change-of-beneficiary registration | Four properties (three land parcels, one building) × ¥1,000 |
| Excluded | Brokerage commission and capital gains tax on disposal, interest, the cash-flow impact of consumption tax, the cost of creating a pledge over the beneficiary interest as security, and prepaid fire insurance premiums |
Note on rates and concessions: The rates and expiry dates stated in this article are based on laws and circulars published as of August 2026. The 3% land rate for real estate acquisition tax and the half-value tax base for residential-zoned land expire on 31 March 2027; the stamp duty concession for real estate transfer agreements expires on 31 March 2027; and the land concession for registration and licence tax expires on 31 March 2029. These may change under future tax reform. For actual application, please confirm the law in force at the time of acquisition and the relevant prefectural ordinance.
Related Reading
- Own a Hotel from ¥100,000 — Security Tokens Open a Third Funding Route
- Who Owns the Hot Spring? Water Rights and Ryokan Valuation
- Japan’s Second Cities: 21 Prefectures Where the Capital Isn’t #1
- Hotels at Year 10: The Renovation Gap Is +13.6% Below 100 Rooms
- Hotel Supply Pressure Ranking 2026-2027: Ozu Kumamoto Tops at 30.8%
- Station Premium Ends at an 8-Minute Walk: 8 Stations, 1,012 Hotels
- Policy Rate 1.00%: Break-Even ADR Across Japan’s 8 Hotel Markets
- Corporate Retreat Conversions: 8.27% GOP Yield Across 5 Onsen Areas
References and Sources
Data sources
Tax rates, tax bases and expiry dates are primary-source information from National Tax Agency Tax Answers (No.7191 / No.7108 / No.7140), the Ministry of Finance (“Materials on Registration and Licence Tax”), Article 72 of the Act on Special Measures Concerning Taxation, the Local Tax Act, and the prefectural tax ordinances of Osaka, Tokyo and Aichi. The cap on brokerage commission follows the MLIT public notice (Ministry of Construction Notice No. 1552, as amended by MLIT Notice No. 949 of 21 June 2024). Market expected yields are from the Japan Real Estate Institute’s 54th Japanese Real Estate Investor Survey (as of April 2026; the prior-period comparison uses the 53rd survey, as of October 2025). Estimated settled ADR (business hotels in Fukuoka, July 2025–July 2026, N=329–341 properties per month) and the listed hotel REIT property data (285 domestic properties, as of 17 August 2026) are aggregated by MetroEngines Research & Consulting.
Taxation (national)
- National Tax Agency, “No.7191 Registration and Licence Tax Rate Table”
- National Tax Agency, “No.7108 Reduction of Stamp Duty on Real Estate Transfer Agreements”
- National Tax Agency, “No.7140 Stamp Duty Rate Table (1) — Documents Nos. 1 to 4”
- National Tax Agency, “Notice on Reduced Rates of Registration and Licence Tax (FY2026 Tax Reform)”
- National Tax Agency, “Corporation Tax Basic Circular, Section 1: Acquisition Cost of Fixed Assets (7-3-3-2, Examples of Expenses That Need Not Be Included in the Acquisition Cost of Fixed Assets)”
- Ministry of Finance, “Materials on Registration and Licence Tax”
- Act on Special Measures Concerning Taxation, Article 72 (reduced rate for registration of transfer of ownership of land by sale)
- Registration and Licence Tax Act, Appended Table 1 (registration of change of trust beneficiary); Consumption Tax Act, Article 30(10) (restriction on input tax credit for residential rental buildings)
Taxation (local and prefectural ordinances)
- Ministry of Internal Affairs and Communications, “Local Tax System — Real Estate Acquisition Tax”
- Osaka Prefecture, “Real Estate Acquisition Tax” (rates, special measures and expiry dates)
- Tokyo Metropolitan Bureau of Taxation, “Real Estate Acquisition Tax”
- Aichi Prefecture, “Real Estate Acquisition Tax”
- City of Nagoya, “Worked Examples of Fixed Asset Tax and City Planning Tax (Land and Buildings)”
- Local Tax Act, Article 73-7 (exemption from real estate acquisition tax for formal transfers of ownership)
Brokerage remuneration (MLIT public notice)
Market data
- Japan Real Estate Institute, “The 54th Japanese Real Estate Investor Survey” (as of April 2026)
- Japan Real Estate Institute, “The 53rd Japanese Real Estate Investor Survey” (as of October 2025)
- MetroEngines Research & Consulting — estimated settled ADR (business hotels in Fukuoka, July 2025–July 2026, N=329–341 properties per month) and listed hotel REIT property data (285 domestic properties, as of 17 August 2026)
- Hoshino Resorts REIT official IR / Ichigo Hotel REIT official IR / Japan Hotel REIT property list / Invincible Investment Corporation official IR / Mori Trust REIT official IR / Japan Hotel & Residential REIT official IR
Limitations and caveats
The amounts in this article are simplified calculations built on a model property (regional core city, 100-room limited-service hotel, purchase price ¥1.2bn, LTV 70%). The actual tax base for real estate acquisition tax and registration and licence tax must be confirmed from each property’s fixed asset valuation certificate. Judicial scrivener fees, due diligence costs, the loan arrangement fee and the trust fee are assumed values drawn from practical benchmark ranges and vary by deal. Brokerage commission and capital gains tax on disposal, interest, the cost of capital until a consumption tax refund, and the cost of creating a pledge over the beneficiary interest as security are excluded. Rates and the expiry dates of concessions are based on laws and circulars published as of August 2026 and may change under future tax reform. Estimated settled ADR is inferred from published rates and differs from each property’s actual transacted rates or accounting figures. Individual investment and tax decisions require property-specific due diligence and review by tax and legal professionals.