

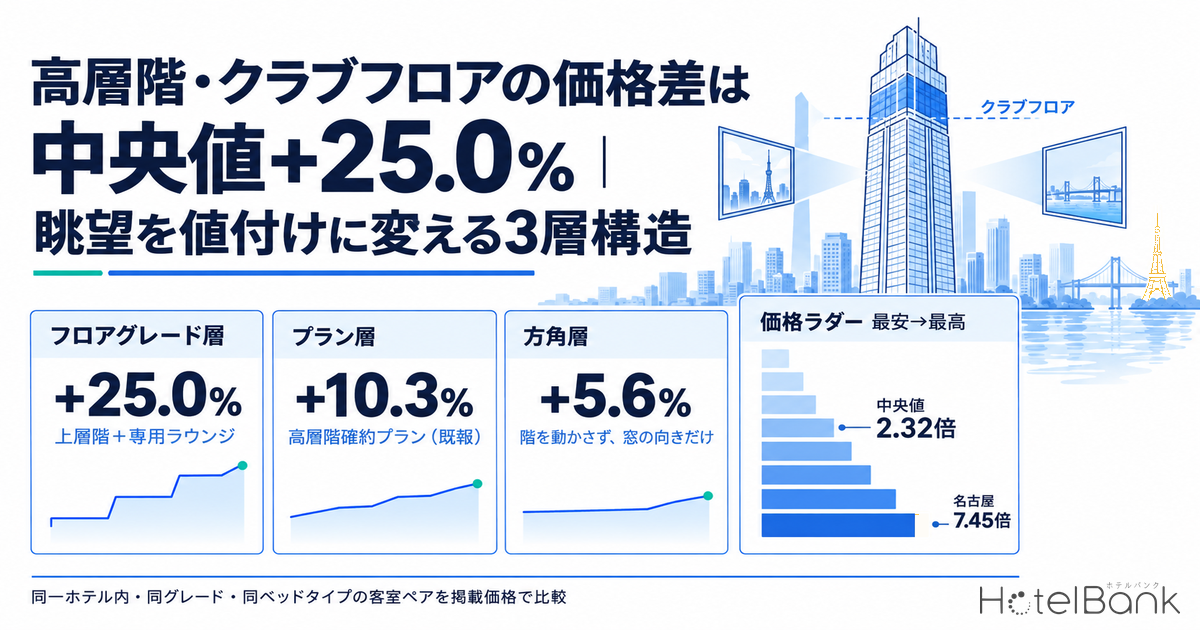
At the same hotel, a room of the same size with the same bed type sells for roughly 40% more purely because it is on a different floor. A view is not “scenery” — it is a way of dividing up inventory so that a price gap can exist, and once the actual sales data is opened up, that division sorts into three layers. This article matches room-type listed prices across nine supertall hotels and measures how much uplift upper-floor room types are actually capturing.
Metric Definitions Used in This Article
- Listed price: the selling price published on OTAs and similar channels. Per-room rate for two guests in one room (tax included). Every room-type comparison and premium rate in this article is on this listed-price basis and matches room types against each other within the same hotel (it is not used to compare levels between hotels).
- ADR (average daily rate): an estimated settled rate (tax-excluded equivalent) derived by applying a segment-specific adjustment coefficient to the cheapest published plan level each property shows on OTAs and similar channels (two guests in one room, per-room rate, tax included). Cross-checked against property-level results disclosed by listed hotel REITs (91 properties, most recent three months), the median error is about 7%. It is an estimate and differs from each property’s actual transacted prices and accounting figures. Area-level ADR is the median of the properties covered (the level of a typical property in that area). The room-type premiums in this article use listed prices, not this estimated settled ADR; the granularity and the basis differ, so the two are not compared directly.
- Floor grade: an upper-floor room category within a single hotel that bundles placement on higher floors with privileges such as an exclusive lounge (marketed as a club floor, concierge floor, special floor and similar names).
- Building height, floor count and the floors the hotel occupies: only figures confirmable in primary sources — developer press releases, official building and hotel websites, and material published by local authorities.
- Data source: MetroEngines Research
- — Median +25.0% — the uplift on a floor grade that bundles upper floors with an exclusive lounge. 15 pairs across 5 properties, range +11.1% to +47.3%.
- — Median +5.5% — the orientation premium captured without moving up a single floor, purely on which way the room faces. 6 pairs across 2 properties, range +4.5% to +7.6%.
- — The three layers stack — the rate-plan layer (median +10.3%, reported earlier), the orientation layer (+5.5%) and the floor-grade layer (+25.0%) are independent charging axes, so the same “view” is priced three times over.
- — The price ladder spans a median of 2.32x — the gap between a hotel’s cheapest and most expensive room type. The widest is Nagoya Marriott Associa Hotel at 7.45x, stacking 17 room types.
- — It works at hotels with no height at all — the orientation layer does not require upper floors. Corner rooms, a specific compass direction or an unobstructed sightline alone leave room to design in roughly +5%.
The view premium splits into three layers
Saying “high floors cost more” is far too crude for practical work. There are at least three routes by which height is converted into price on a booking page, and the uplift each one carries differs by an order of magnitude.
The first is the rate-plan layer. The same room type is sold under a separate plan carrying a condition such as “guaranteed high floor” or “high-floor assignment,” with no split of the underlying inventory. An earlier HotelBank study aggregated this layer’s uplift across 13 properties and found a median of +10.3%.
The second is the orientation layer. The floor does not change; rooms on the same floor are priced differently according to which way the window faces. Labels such as “Tower View,” “Bay View” and “Park View” belong here.
And the third is the floor-grade layer. Rooms are grouped on upper floors, privileges such as an exclusive lounge and private check-in are bundled in, and the result is sold as an independent room type. It appears under names such as club floor, concierge floor and special floor.
What this article newly measures is the latter two layers. Unlike the rate-plan layer, the floor-grade and orientation layers separate the room type itself, so rooms of the same grade and the same bed type can be matched one-to-one within a single hotel. Reading the price of an added benefit from the gap between two products the same hotel sells side by side is the same approach used in our comparison of business-hotel breakfast premiums across 10 prefectures. The results follow.
Source: compiled by HotelBank Editorial Team from MetroEngines Research (floor-grade layer N=15 pairs / orientation layer N=6 pairs / rate-plan layer from earlier reporting, N=13 properties)
Measuring the floor-grade layer — 15 pairs across 5 properties, median +25.0%
Start with the floor-grade layer, which carries the largest uplift. The sample is restricted to combinations where a single hotel has both standard and upper floors and the two are sold side by side at the same room grade and the same bed type. Only pairs that match on everything except the floor category — “Deluxe Twin” against “Club Deluxe Twin,” for example — are picked up.
Across 5 properties and 15 pairs the result is a median of +25.0%, a mean of +26.8% and a range from +11.1% to +47.3%. Against the rate-plan layer’s +10.3%, that is roughly 2.4 times the uplift.
Source: compiled by HotelBank Editorial Team from MetroEngines Research (N=5 properties, 15 pairs; observed average of per-room listed prices for two guests in one room, tax included)
The spread by property is wide. The largest uplift was at Nagoya Marriott Associa Hotel (名古屋マリオットアソシアホテル), with a median of +41.0% across three pairs. The hotel occupies the hotel wing of JR Central Towers (226.0m, 53 storeys), and its standard room category already advertises that every room is on the 20th floor or above. A concierge floor is layered on top of that, so even though the standard side is already high up, a further 40% uplift still holds — which is what makes the case interesting.
The Prince Gallery Tokyo Kioicho (ザ・プリンスギャラリー 東京紀尾井町) (floors 30–36 of Kioi Tower, 250 rooms) posts a median of +25.0%, but the spread within its pairs is wide, reaching +47.3% on the Superior King. The step up is largest when moving from the lowest grade on the standard side to an upper floor — a design that sets the entry point of the price ladder low and recovers on the upper floors.
The Westin Sendai (ウェスティンホテル仙台) (Sendai Trust Tower, 180m; guest rooms on floors 28–36, 292 rooms) lands all three pairs neatly in the +20% band, for a median of +25.2%. It is an example of a property turning its position — the upper part of the tallest building in the Tohoku region — into a floor category with a consistent spread.
The Ritz-Carlton, Tokyo (ザ・リッツ・カールトン東京) (Tokyo Midtown Tower, 248.1m; guest rooms on floors 47–53), by contrast, shows a relatively small median of +15.8%. That is not because the uplift is modest, but because the listed price on the standard side already sits at ¥190,000–¥210,000; in absolute terms the Deluxe Twin pair alone carries a gap of about ¥58,000. It is a textbook case of how the picture changes depending on whether you design in percentages or in yen. The special floor at Swissôtel Nankai Osaka (スイスホテル南海大阪) also posts a median of +16.6%, putting it in the same range as a percentage.
| Property | Room pair compared | Standard floor | Upper floor | Uplift |
|---|---|---|---|---|
| Nagoya Marriott Associa Hotel | Standard Double | ¥51,229 | ¥74,017 | +44.5% |
| Nagoya Marriott Associa Hotel | Deluxe Double | ¥59,634 | ¥84,067 | +41.0% |
| Nagoya Marriott Associa Hotel | Deluxe Twin | ¥59,631 | ¥83,779 | +40.5% |
| The Prince Gallery Tokyo Kioicho | Superior King | ¥135,954 | ¥200,219 | +47.3% |
| The Prince Gallery Tokyo Kioicho | Deluxe Twin | ¥156,261 | ¥195,333 | +25.0% |
| The Prince Gallery Tokyo Kioicho | Deluxe King | ¥156,221 | ¥195,176 | +24.9% |
| The Westin Sendai | Deluxe King | ¥58,395 | ¥74,112 | +26.9% |
| The Westin Sendai | Deluxe Twin | ¥57,902 | ¥72,508 | +25.2% |
| The Westin Sendai | Superior Twin | ¥77,973 | ¥93,767 | +20.3% |
| The Ritz-Carlton, Tokyo | Deluxe Twin | ¥192,586 | ¥251,068 | +30.4% |
| The Ritz-Carlton, Tokyo | Deluxe King | ¥211,706 | ¥249,663 | +17.9% |
| The Ritz-Carlton, Tokyo | Executive Suite | ¥412,167 | ¥469,114 | +13.8% |
| The Ritz-Carlton, Tokyo | Carlton Suite | ¥546,880 | ¥607,388 | +11.1% |
| Swissôtel Nankai Osaka | Twin (Select → special floor) | ¥54,637 | ¥64,013 | +17.2% |
| Swissôtel Nankai Osaka | King (Select → special floor) | ¥52,462 | ¥60,801 | +15.9% |
A note on interpretation: what is measured here is not “the effect of floor number alone.” Club floors, concierge floors and special floors are designed as a package in which placement on upper floors comes together with privileges such as an exclusive lounge and private check-in, so the uplift includes the value of those privileges. Isolating the effect of height on its own would require a sales category conditioned on the floor alone — a “floor 45 or above guaranteed” type — but no property in this observation window offered both at room-type level, so that case falls outside the scope of this article.
Measuring the orientation layer — +4.5% to +7.6% without moving a floor
Next, the orientation layer. Room types differing only in which way the window faces, within the same band of floors, were compared against each other. The sample is 6 pairs across 2 properties, with a median of +5.5% and a range from +4.5% to +7.6%.
Andaz Tokyo (アンダーズ 東京) holds 164 rooms on floors 47–52 of Toranomon Hills Mori Tower (247.0m, 52 storeys). It opened in June 2014 and offers room types in three orientations — Park View, Bay View and Tower View (source: Hyatt Japan, “Press material, April 2026”). Taking Park View as the base, Bay View carries +4.5% and Tower View +7.3% to +7.6%. The highest price attaches to the direction from which Tokyo Tower is visible, which shows the subject of the view itself being priced as a brand asset.
The contrast is Hotel Toranomon Hills, The Unbound Collection by Hyatt (ホテル虎ノ門ヒルズ アンバウンド コレクション by Hyatt) (205 rooms, opened December 2023 / source: as above). Toranomon Hills Station Tower, which houses the hotel, stands about 266m over 49 storeys — among the taller buildings in this article — yet its guest rooms sit on floors 11–14. The upper part is given over to offices and an information hub, and the hotel takes a mid-to-low placement that prioritises direct station access. Even so, City View to Tower View carries +6.2%, Deluxe to Premium +4.8%, and Premium to Premium City View +4.6%: orientation-layer pricing holds without upper floors at all.
This carries an important practical implication. The orientation-layer premium does not presuppose building height. As long as you can draw a line between the side with an open sightline and the side without one, the same logic works at a ten-storey hotel or a two-storey ryokan. Trends in room-view ratings themselves are covered in our analysis of properties where room-view ratings are rising.
| Property (guest-room floors) | Orientation pair compared | Base | Higher | Uplift |
|---|---|---|---|---|
| Andaz Tokyo (floors 47–52) | Park View → Tower View (King) | ¥197,768 | ¥212,845 | +7.6% |
| Andaz Tokyo (floors 47–52) | Park View → Tower View (Twin) | ¥196,917 | ¥211,377 | +7.3% |
| Andaz Tokyo (floors 47–52) | Park View → Bay View (King) | ¥197,768 | ¥206,734 | +4.5% |
| Hotel Toranomon Hills (floors 11–14) | City View → Tower View | ¥122,181 | ¥129,771 | +6.2% |
| Hotel Toranomon Hills (floors 11–14) | Deluxe → Premium | ¥132,301 | ¥138,625 | +4.8% |
| Hotel Toranomon Hills (floors 11–14) | Premium → Premium City View | ¥138,625 | ¥144,951 | +4.6% |
Stack the three layers and the price ladder widens to a median of 2.32x
The layers described so far are independent of one another. You can divide by floor grade, split that by orientation, and then slice it further by plan condition. As a result, the price range across a single hotel’s room types becomes quite wide.
The chart below lines up the cheapest and most expensive listed prices among the room types on sale at nine supertall hotels. The median multiple is 2.32x.
Source: compiled by HotelBank Editorial Team from MetroEngines Research (N=9 properties; observed average of room-type listed prices at each property. Left end of the bar = cheapest type, right end = most expensive type)
The widest is Nagoya Marriott Associa Hotel at 7.45x (¥51,200–¥381,900), with 17 observable room types. It stacks everything from the basic type on the standard floors up to a concierge-floor suite inside one building, and its 774 rooms — among the largest of Japan’s supertall hotels — are what make that many rungs possible. Its position directly above Nagoya Station is as described on the Nagoya city tourism information site.
Next come The Prince Gallery Tokyo Kioicho at 3.46x (11 types) and The Ritz-Carlton, Tokyo at 3.15x (12 types). Andaz Tokyo, at 1.36x (7 types), is the narrowest. Its orientation layer is cleanly built out across three directions, but it has no floor-grade layer and moves straight to suites at the top. Against a room count of 164, that reads as a design that limits the number of rungs and keeps inventory per type thick.
In other words, the width of the ladder is also a function of scale. If a property with a room count in the low hundreds cut a 7x range, each type would hold a dozen or so rooms and daily inventory allocation would become difficult. Before adding rungs, you need to confirm that the inventory behind each type works as a unit of sale.
“The building is tall” and “the uplift can be captured” are two different things
What matters to note here is that every premium measured in this article is a relative gap within the same hotel. What sets the level between hotels is not the height of the building.
In fact, looking at the relationship between the height of the building a hotel occupies and its property-level listed price across 18 properties, the correlation coefficient stops at r=0.229. Height explains roughly 5% of the variance in price — almost no explanatory power. Measured by the topmost guest-room floor it is not much different, at r=0.266. An earlier HotelBank ranking of Japan’s tallest hotels tested the same point on an estimated settled ADR basis and reached the same conclusion.
Bundling by location category makes the picture easier to read. The median listed price of the 9 properties in central business districts was about ¥142,700; the 4 in waterfront and airport locations about ¥126,000; the 3 in entertainment and tourist-draw districts about ¥79,700; and the 2 in regional core cities about ¥59,400. Median heights were 226m for central business districts, 201m for waterfront and airport, 225m for entertainment and tourism, and 176m for regional core cities — so the ranking by height and the ranking by price do not line up. What is working is the area and the brand tier.
Source: compiled by HotelBank Editorial Team from MetroEngines Research (N=18 properties; aggregated by location category from monthly median listed prices, September 2025 to August 2026)
That is exactly why productising a view is not a question of “acquiring height” but of “how you slice the height you already have.” Occupy a 300m building and no uplift appears unless you slice it; sit on floors 11–14 and slicing still captures +4.6% to +6.2%.
The high-rise hotels coming to market, and the assumptions behind their design
Over the next few years, a cluster of large projects placing guest rooms on upper floors will come online. They are worth setting out as reference points for design.
Torch Tower, in front of Tokyo Station, stands about 385m over 62 storeys, with a hotel planned for floors 53–58 and an observation facility on floor 61 and above. Mitsubishi Estate has announced completion at the end of June 2028, with the hotel at a scale of around 110 rooms. Against 110 rooms, the six floors from 53 to 58 work out at just under 20 rooms per floor — closer to a design that treats every room as a single upper-floor grade than one sliced by floor grade.
In the Nihonbashi 1-chome Central District redevelopment, Waldorf Astoria Tokyo Nihonbashi (197 rooms) is scheduled to open in 2027 on floors 39–47 of a 284m, 52-storey tower. Residences are planned for floors 48–51, stacking housing above the hotel. Hilton, which operates the brand, runs 9 brands and 37 properties in Japan and has announced 13 more in the pipeline, including Conrad Yokohama (272 rooms, scheduled to open in 2027) (source: Hilton, “Company profile,” updated 25 August 2026).
In Yokohama, Yokohama Royal Park Hotel closed temporarily on 31 March 2025 with its configuration intact — floors 52–67 of Yokohama Landmark Tower (296.3m), 603 rooms — and entered a large-scale renovation. According to announcements by Mitsubishi Estate and Mitsubishi Estate Hotels & Resorts, a franchise agreement has been concluded with Marriott International and the hotel is scheduled to reopen as a Luxury Collection property in fiscal 2028 (Yokohama city tourism information site). Sixteen floors from 52 to 67 across 603 rooms leaves more room to slice than any of the nine properties examined here, and the room-type design after reopening will become a reference point for the whole industry. For the development plans and price tiers across Minatomirai as a whole, see our analysis of the Yokohama Minatomirai luxury development pipeline.
Conclusion — a view can be priced three times
To sum up the measurements: against the single asset of a view, three independent charging axes are at work in the market. The floor-grade layer runs at a median of +25.0% (15 pairs across 5 properties), the rate-plan layer at a median of +10.3% in earlier reporting (13 properties), and the orientation layer at a median of +5.5% (6 pairs across 2 properties). The floor-grade layer carries by far the largest uplift, but it is a package that comes with privileges such as an exclusive lounge — it is not the effect of floor number alone, and that deserves care.
And none of the three layers presupposes building height. The orientation layer holds on an open sightline alone, and properties on floors 11–14 are in fact capturing +4.6% to +6.2%. The floor-grade layer, too, is designable as long as there is one floor where an exclusive lounge can be placed on an upper level. The fact that the correlation between building height and property-level price stops at r=0.229 means, read the other way, that the same design headroom exists at properties with no height.
What to confirm before slicing comes down to one thing: whether the inventory behind each room type works as a unit of sale. The price ladders of the nine properties opened to a median of 2.32x and a maximum of 7.45x because that inventory was there. The number of rungs is not the objective — it is determined as a consequence of inventory scale.
Related reading
- Properties Where Room-View Ratings Are Rising: National TOP 30 — The Scarcity of “Visible From the Room” in the Summer 2026 Fireworks Season
- Supertall Luxury Hotel Development Around Tokyo Station and the Tri-Pole Shift in Central Tokyo (Tokyo Station, Shinagawa, Nagoya)
- Yokohama Minatomirai Luxury Development Pipeline Investment Analysis — Price Tiers and the Upside in Mixed-Use Locations
- Business-Hotel Breakfast Premiums: Kyoto 22.0% vs Shizuoka 5.0%, a 4.4x Gap — 10 Prefectures Compared Within the Same Hotel
References and sources
■ Data sources
Room-type listed prices from MetroEngines Research (two guests in one room, per-room, tax included; observed averages). The floor-grade layer uses 15 pairs across 5 properties, the orientation layer 6 pairs across 2 properties, the price ladder 9 properties, and the height-price correlation and location categories the monthly median listed prices of 18 properties (September 2025 to August 2026). Building heights, floor counts and room counts are recorded only where confirmed in primary material from developers and operating companies.
■ Calculation assumptions
Uplift is calculated as (upper side ÷ base side − 1) for pairs within the same hotel that match on room grade and bed type, and shown as a median and a range. The rate-plan layer’s median of +10.3% (13 properties) is quoted from the aggregate in an earlier article and was not re-measured here. Correlation coefficients are Pearson product-moment.
■ Limitations and caveats
The floor-grade layer’s uplift includes the value of privileges such as an exclusive lounge and is not the effect of floor number alone. The orientation layer rests on a small sample of 6 pairs across 2 properties and should be treated as a rough guide to market levels. Listed prices move with the selling period and remaining availability, and do not match transacted prices or a property’s accounting figures.
■ Price data
- MetroEngines Research — room-type listed prices (two guests in one room, per-room, tax included) and monthly median listed prices by property (September 2025 to August 2026)
■ Primary material on brands and properties
- Hyatt Japan, “Press material, April 2026”
- Hilton, “Company profile” (updated 25 August 2026)
- Mori Building, “Toranomon Hills Mori Tower” project outline (247m, 52 storeys, completed 2014)
- Mori Building news release, “Toranomon Hills Station Tower completed” (49 storeys, approx. 266m)
- Tokyo Midtown, “The Ritz-Carlton, Tokyo” facility information (Midtown Tower, floors 45–53)
- Tokyo Garden Terrace Kioicho, “The Prince Gallery Tokyo Kioicho” (Kioi Tower, floors 30–36, 250 rooms)
- Mori Trust, “Sendai Trust Tower” (180m)
- Mitsubishi Estate, “Yokohama Royal Park Hotel begins large-scale renovation work” (31 March 2025)
- Mitsubishi Estate, “TOKYO TORCH / Torch Tower construction begins”
- Mitsui Fudosan Residential and Hilton press announcement (25 September 2025 / Nihonbashi 1-chome Central District)
- Tokyu Kabukicho Tower, “BELLUSTAR TOKYO, A Pan Pacific Hotel” (floors 39–47)
- Shinjuku Park Tower building outline (52 storeys, approx. 235m, completed April 1994)
- Nagoya Prince Hotel Sky Tower official site (140m, floors 31–36)
- Abeno Harukas floor guide (300m)
■ Material published by local authorities
Source: Hyatt Japan, “Press material, April 2026”
Source: Hilton, “Company profile” (updated 25 August 2026)