

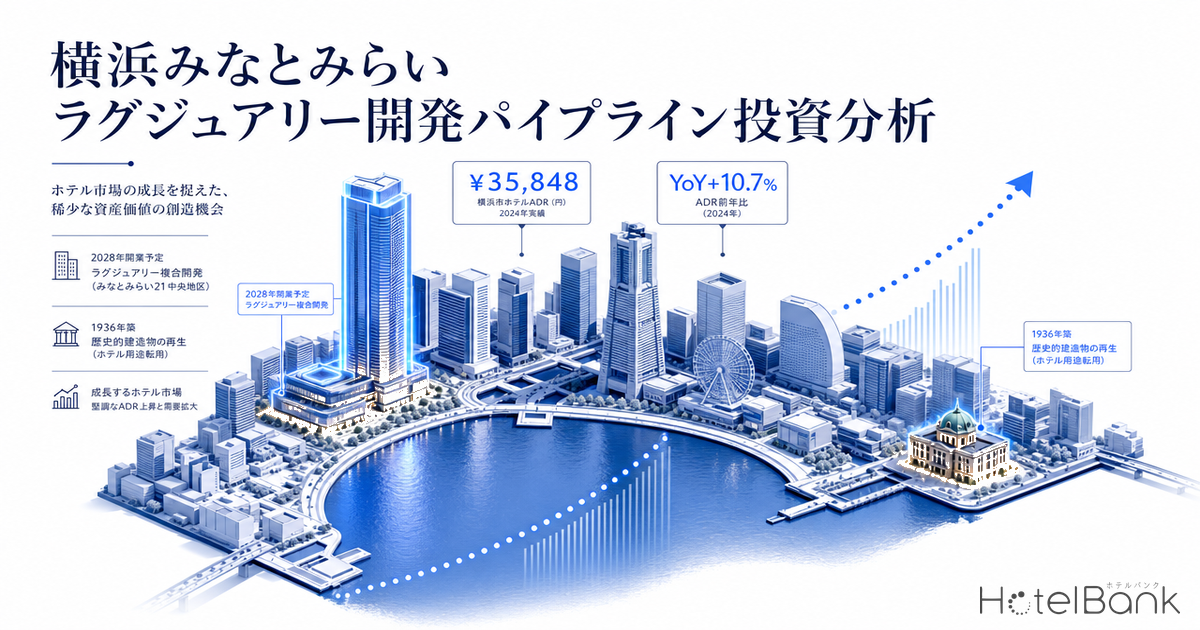
Yokohama Minatomirai 21 (MM21) has built up a luxury hotel cluster since 2020, and two more iconic hotel developments are now scheduled to open between 2027 and 2028. Starting from this pipeline, this report maps the ward-level ADR price tiers, quantifies the mixed-use location where tourism, business and residential demand overlap, and identifies the upside revealed by the price gap with central Tokyo — all from the perspective of developers and REIT investors.
Metric Definitions Used in This Article
- ADR (Average Daily Rate): Average of selling prices published on OTAs and elsewhere. This differs from actual transaction prices (cross-checked against REIT disclosure data, the public-price average tends to be +25–30% higher than the realized ADR, because unsold higher-priced plans remain on OTAs and push up the average). Per-room price (tax included) for two-person occupancy, averaged across all plans (including room-only and meal-inclusive plans).
- OCC (Occupancy): Estimated share of sold rooms against the total room inventory in the area (based on OTA-published inventory).
- Data Source: MetroEngines Research & Consulting
- — Nishi Ward ADR is ¥35,800 (June 2026, N=9), about 13% above the Tokyo Prefecture average of ¥31,700 — Yokohama’s bay area has matured into a market that rivals central Tokyo on price.
- — Within a 2km radius, the full-luxury tier above ¥60,000 is already established (Westin starts at ¥71,100). The gap between top market rates and the ward average signals room to thicken the upper tier — the “upside” zone.
- — Two pipeline projects with distinct profiles — THE MARITIME HOTEL YOKOHAMA BAY (52 rooms, in a historic building, January 2027) and the Yokohama Four Seasons mixed-use complex (with an aquarium, September 2028) — will thicken the top tier.
- — 157,000 daytime workers (36% office) within 1km, and the residential population within 1.5km is projected to grow +7.7% by 2040, so weekday-and-weekend dual demand supports stable occupancy.
- — Kanagawa Prefecture saw only 23 new openings in 2026 — a thin supply pipeline, and the luxury tier is constrained nationwide. Scarcity underpins price discipline for these two pipeline assets.
Executive Summary — A “Thin-Top” Market With Symbolic Pipeline Projects About to Land
The luxury tier in Yokohama’s Nishi Ward already houses properties above ¥60,000 such as Westin Hotel Yokohama (¥71,100), Hilton Yokohama (¥66,400) and Yokohama Bay Sheraton (¥64,200) — a ceiling that meaningfully exceeds central Tokyo (Tokyo Prefecture average ¥31,700). Yet when we step back to ward-level averages, the price tiers descend like a staircase: Nishi Ward ¥35,800, Naka Ward ¥29,300, Kanagawa Ward ¥22,500. The very fact that there is a wide gap between top market rates and the ward average tells us the upper tier is still thin, with room to layer in more inventory.
Into this market come two projects with distinct DNA: THE MARITIME HOTEL YOKOHAMA BAY (a conversion of the historic Yokohama Yusen Building — 52 rooms, every room 38㎡+, opening late January 2027), and the Yokohama Four Seasons mixed-use complex (HARBOR EDGE PROJECT, with an attached aquarium, September 2028). The former offers the scarcity value of a historic building; the latter, the magnetism of a global luxury brand. Each thickens the very top of the price tier from a different axis. Backed by a mixed-use location where tourism, business and residential demand overlap (157,000 daytime workers within 1km, and residential population set to grow even through 2040), weekday and weekend demand reinforce each other — strengthening the investment thesis.
Price Tiers — Nishi Ward ¥35,800 Tops a Staircase That Outpaces Central Tokyo
Looking at ward-level ADR across Kanagawa Prefecture (June 2026, two-person occupancy, all-plan average), Nishi Ward — home to Minatomirai and Yokohama Station West Exit — stands one rung above the rest at ¥35,800 (YoY +3.2%, N=9). Naka Ward, which covers Kannai, Yamashita-cho and Motomachi, comes in at ¥29,300 (YoY +10.7%, N=41), and Kanagawa Ward on the east side of Yokohama Station follows at ¥22,500 (YoY +32.3%, N=6). The number worth noting is that the same-month ADR for Tokyo Prefecture as a whole is ¥31,700. Nishi Ward sits about 13% above the Tokyo average — Yokohama’s bay area has grown into a market that stands shoulder-to-shoulder with central Tokyo on price, and in some segments surpasses it.
Double-digit YoY growth in Kanagawa Ward (+32.3%) and Naka Ward (+10.7%) signals that Yokohama’s overall ADR floor is rising. Nishi Ward’s milder +3.2% growth reflects the fact that its starting point is already elevated — it has not hit a ceiling so much as it is waiting for more upper-tier supply to lift the average further. Today’s pipeline of two projects fits squarely at the top of that price staircase.
Catchment Luxury — The ¥60,000+ Ceiling Is Already Set; Pipeline Adds Depth
Compiling the trailing six-month average of public prices (two-person occupancy) for major properties within a 2km radius of central MM21, the landscape splits cleanly into two layers. At the top sit Westin Hotel Yokohama ¥71,100, Hilton Yokohama ¥66,400, Yokohama Bay Sheraton ¥64,200, Yokohama Bay Hotel Tokyu ¥61,700 and Yokohama Grand InterContinental ¥56,800 — a full-luxury layer in the ¥56,000–¥71,000 band. Just below come Hyatt Regency Yokohama ¥50,500, Mitsui Garden Hotel Yokohama Minatomirai Premier ¥43,200 and OMO7 Yokohama ¥40,600 in an upper-upper-midscale layer.
This actual price distribution confirms that lodging demand above ¥60,000 already exists in Yokohama’s bay area. Into a market where high-end demand has already established itself, MARITIME HOTEL — with its scarce historic-building positioning — and Four Seasons — with global brand pull — will broaden the top-tier options and create upside as the overall price band stretches further upward. On the Hyatt side, Hyatt Hotels & Resorts Japan reports that Hyatt Regency Yokohama opened in May 2020 with 315 rooms and that the group now operates 9 brands and 22 hotels (5,066 rooms total) in Japan (Source: Hyatt Hotels & Resorts Japan, “Press release April 2026”). For a deeper look at how Hyatt-branded luxury is valued by REIT investors, our analysis of JHR’s ¥126 billion acquisition of Hyatt Regency Tokyo is a useful reference.
Development Pipeline — Two Projects, Two Distinct Profiles, Thickening the Top Tier
Both pipeline projects in MM21 and the Kannai bay area sit at the luxury tier, but the source of their value is in stark contrast. The table below organizes the two.
| Item | ① Yokohama Four Seasons Complex (HARBOR EDGE PROJECT) | ② THE MARITIME HOTEL YOKOHAMA BAY |
|---|---|---|
| Location | MM21 Central District Block 62 | Yokohama Yusen Building (Kaigan-dori) |
| Opening | September 2028 (planned hotel opening) | Late January 2027 |
| Operator / Sponsor | BMD62 (Berjaya / Marubeni / Daiwa House Industry) as planned developer; Four Seasons to operate | Plan・Do・See (operator) |
| Building / Composition | 14 floors above ground, 2 below / hotel + hotel residences + aquarium + retail | Conversion of a historic building completed in 1936 / 52 rooms, banquet hall, chapel |
| Room Features | Spa, pool, fitness on upper floors | All rooms 38㎡+, 7 room types |
| Value Source | Global brand pull + aquarium as stay driver | Scarcity of a historic building + ocean-liner cultural story |
The Four Seasons complex packages an aquarium that draws non-staying visitors and combines hotel residences alongside the hotel — a structure that captures both areal demand stimulus and long-stay residential demand. MARITIME HOTEL converts a historic building from 1936, rebuilt after the Great Kanto Earthquake with its signature 16 columns, into 52 small-format luxury rooms — a rare conversion case, and the all-rooms-38㎡+ specification points to rate-driven positioning. The two are less competitors than complementary entry points: they add two distinct doors — “scale × brand” and “scarcity × story” — into Yokohama’s bay-area luxury tier.
Quantifying the Mixed-Use Location — Tourism, Business and Residential Demand Layered Together
Centering on MM21 representative coordinates (Minatomirai Station area) and quantifying both employment and residential populations, this area is clearly neither a pure tourism district nor a pure office district — it is a true mixed-use location. Within a 1km radius, there are 4,380 business establishments and 156,886 workers, of whom 56,515 are office-sector workers — an office-worker share of 36.0% (Source: Ministry of Internal Affairs and Communications / Ministry of Economy, Trade and Industry “Economic Census – Activity Survey”). This is a thick base for weekday business demand and MICE demand.
On the residential side, the 1.5km-radius population is 72,130 in 2025. While most urban areas in Japan have entered population decline, this area is projected to grow to 75,117 by 2040 — a +7.7% increase — with a working-age population share of 72.0%. Driven by tower-condominium supply, it is maturing as a live-work neighborhood, giving a solid local base for weekend and non-business demand such as leisure, anniversaries, family visits and long stays. Note that the data here is residential population from the census basis and excludes tourist arrivals and through-traffic.
This twin-engine structure of business (weekdays) and residential / tourism (weekends) makes it easier to fill weekday demand troughs in hotel operations, which strengthens the case for luxury investment by stabilizing occupancy. Land prices around Minatomirai Station at ¥3.75M/㎡, and commercial land in Nishi Ward up +11.03% YoY (Source: MLIT Real Estate Information Library / Published Land Prices), also reflect this mixed-use thesis being priced in by the market.
Minatomirai through a Residential Mesh — Dense Population in High-Rises, Overlapping with the Business Cluster
When residential mesh data is shaded by population, residential density in Minatomirai is concentrated continuously through the high-rise residential blocks, and the area sits on the growing side of the demographic trend through 2040 (+7.7% in residents within 1.5km, with senior-share at 17.6% — as young as central Tokyo). Layered on top, within the same 1km radius, sits a business cluster of ~157,000 workers with a 36.0% office share. In other words: weekdays belong to business (workers), weekends to tourism and residents — two demand engines coexisting in the same blocks. The “mixed-use location where tourism, business and residential demand overlap” that this report identifies is borne out by geospatial data. Each info card shows residential population, senior share, and 2040 change.
Positioning — A Scale × Rate Map Reveals Upper-Tier Upside
Mapping major properties in the catchment area on a chart of room count (x-axis) × public-price average (y-axis) reveals where Yokohama bay-area luxury supply is concentrated, and where the white space lies. The 300–600-room large-format full-luxury segment (Westin, Hilton, Bay Sheraton and others) is well-stocked, while the small-format luxury band — roughly 50–120 rooms × ¥60,000+, where storytelling and rate drive value — is comparatively thin. MARITIME HOTEL’s 52 rooms target exactly this small-scale × high-rate white space.
Well-Stocked Large-Format Full Luxury
300–600 rooms × ¥56k–¥71k
Westin, Hilton, Bay Sheraton, InterContinental and others. Both brand and scale are densely covered.
Upside Small-Format Boutique Luxury
50–120 rooms × ¥60k+
White space for scarcity and storytelling. MARITIME HOTEL (52 rooms) is the first mover here.
Opportunity Mixed-Use / Stay-Experience
Large-scale × ¥70k+ × visitor-attractor anchor
The Four Seasons complex with its attached aquarium and residences opens up this new territory.
New-Supply Balance — Kanagawa’s Thin 23-Property Pipeline Sustains Upper-Tier Scarcity
On the supply side, MetroEngines Research tracks 23 new openings in Kanagawa Prefecture for 2026 (based on OTA-listed properties). Compared with Hokkaido at 70, Kyoto Prefecture at 53, Okinawa Prefecture at 52 and Tokyo Prefecture at 50, Kanagawa’s new supply is relatively limited. Furthermore, by category nationwide, vacation rentals, business hotels and guesthouses dominate the new-opening mix — meaning new luxury-tier supply is constrained nationwide as well.
The fact that Yokohama’s new supply is thin — and that luxury-tier supply nationwide is limited — heightens the scarcity of these two pipeline projects. On top of that, recent construction-cost inflation acts to suppress new supply overall, easing the competitive environment for existing and in-progress projects. In a market where supply grows only modestly, price discipline at the upper tier tends to hold, stabilizing the underwriting assumptions for investment recovery — another upside factor. The same dynamic of upper-tier supply gaps amplifying pipeline value is explored in our supply-pipeline analysis for the Sendai Station area.
Investment Implications — For Developers and REIT Investors
Synthesizing the data in this report, Yokohama MM21 and the Kannai bay area offer luxury-investment growth potential along four dimensions.
| Lens | Data | Investment Implication |
|---|---|---|
| Price-tier white space | Nishi Ward average ¥35,800 vs. top market rate ¥71,100. Nishi Ward is about 13% above the Tokyo Prefecture average of ¥31,700 | Upper tier is thin; brand and scarcity can pull the average up — upside |
| Mixed-use location | 157,000 workers (36% office) / 72,000 residents (+7.7% by 2040) | Weekday business + weekend leisure twin-engine — high occupancy stability |
| Supply scarcity | Only 23 new openings in Kanagawa Prefecture; luxury-tier supply is constrained nationwide | High scarcity for the two pipeline projects; price discipline is easier to maintain |
| Pipeline diversity | Scale × brand (Four Seasons) and scarcity × story (MARITIME) | Two different entry points broaden the luxury demand base |
From the REIT investor angle in particular, more high-quality luxury assets in the Yokohama bay area mean both geographic diversification away from a Tokyo-heavy portfolio and demand-source diversification across tourism, business and residential drivers. For Tokyo-side luxury competitive dynamics, our analysis of the Waldorf Astoria Tokyo Nihonbashi competitive map and supply impact offers a complementary view of the metropolitan-area picture. For developers, the small-format boutique-luxury band (50–120 rooms × ¥60,000+) remains as opportunity territory — making use of scarce historic buildings or waterfront locations for repositioning or new development. From a growth potential perspective, Yokohama is likely to remain a focal area for metropolitan-area luxury investment over the next several years.
Note: The pricing and location analysis in this report is market observation based on public data; individual investment decisions require detailed feasibility studies. The opening dates and composition of the two pipeline projects are as announced by the sponsors at the time of writing and are subject to change.
⚠ Note on ADR: ADR in this article reflects the average selling prices published on OTAs at the time of research, and varies by check-in date and market conditions. It differs from actual transacted prices.
Related Articles
- [Investment Analysis] Sendai Station Hotel Supply Pipeline — A White Space Above ¥40k Where Only Westin Holds the Top
- JHR’s ¥126B Acquisition of Hyatt Regency Tokyo — Largest-Ever REIT Deal and Operating Performance Analysis
- Nagoya Hotel Investment 2026 — Conrad Opening × Luxury White Space × Delayed Maglev Reshape the Scenario
- Six 2026 Luxury Hotel Openings: Market Impact from an Investor’s Perspective
References & Sources
■ Data Sources
Ward-level and catchment-area ADR is compiled from OTA public prices (MetroEngines Research & Consulting, as of June 2026, each property observed for ≥30 days). Worker and residential populations are based on the Economic Census and the MLIT National Land Numerical Information 250m-mesh projections; land prices are based on the MLIT Real Estate Information Library (Published Land Prices). Facts on the two pipeline projects are based on sponsor announcements, public tourism information and press coverage.
■ Calculation Assumptions
ADR is the average of public prices (two-person occupancy, all-plan average — tax-included, including room-only through meal-inclusive plans), with a structural +25–30% premium versus realized ADR. Catchment properties are extracted within a 2km radius from the center coordinates; workers within 1km; residents within 1.5km. Positioning was evaluated on property scale × public price.
■ Limitations and Caveats
Public prices diverge from transaction prices and vary by market conditions and check-in date. Residential population is on the census basis and excludes tourist arrivals and through-traffic. New-opening counts are based on OTA listings and may increase for recent months. The two pipeline projects’ opening dates and composition are sponsor-announced and may change; individual investment decisions require detailed feasibility studies.
■ Market Data
- MetroEngines Research & Consulting — OTA public price data (ward-level ADR and catchment-property prices, N=each property ≥30 days), catchment-property aggregation (2km radius, 151 properties)
■ Government Statistics / Public Data
- MIC / METI “Economic Census – Activity Survey” (catchment workers and establishments)
- MLIT National Land Numerical Information “250m-mesh future population projection (R6 NIPSSR)” (catchment residential population)
- MLIT Real Estate Information Library — Published Land Prices (Minatomirai Station area, Nishi Ward commercial land)
■ Hyatt
- Hyatt Hotels & Resorts Japan “Press release April 2026”
■ News / Press Releases (Pipeline Fact Verification)
- “Harbor Edge Project” at MM21 Block 62 Receives MLIT Certification (Yokohama Keizai Shimbun)
- Mixed-Use Complex Bringing Four Seasons Hotel and Aquarium to Yokohama Minatomirai (Fashion Press)
- Historic Yokohama Yusen Building to Be Reborn as “THE MARITIME HOTEL YOKOHAMA BAY” (PR TIMES)
- Yokohama Yusen Building to Be Reborn as “THE MARITIME HOTEL YOKOHAMA BAY” — Opening Late January 2027 (City of Yokohama Tourism Information)
- Published Land Prices around Minatomirai Station (Tochidai)
Source: Hyatt Hotels & Resorts Japan “Press release April 2026”