

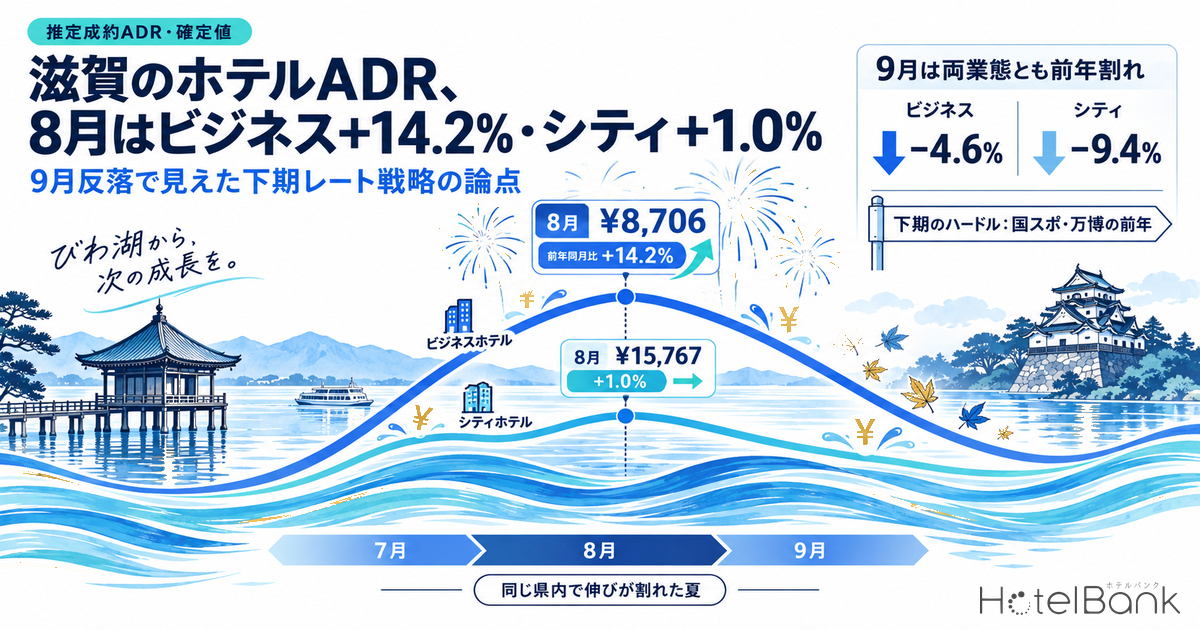
Estimated settled ADR for business hotels in Shiga Prefecture reached ¥8,706 (N=80) in August 2026, now finalized, up 14.2% year on year, while city hotels came in at ¥15,767 (N=12), up just 1.0% — a clear split within the same prefecture. September, finalized in early October, then saw both segments fall below the prior year: business hotels −4.6% and city hotels −9.4%. This article reads these three months through the property-level distribution, a city-by-city breakdown and a comparison with neighboring prefectures, and sets out the rate-strategy issues for the second half of the fiscal year, when the prior-year hurdle is high.
Scope: business hotels (N=80 properties) and city hotels (N=12 properties) in Shiga Prefecture, both finalized August 2026 figures. The price metric in this article is estimated settled ADR (the transacted price level estimated from OTA and other sales data, tax-exclusive equivalent); occupancy is an estimate based on OTA-listed inventory. Definitions are at the end of the article. Data as of October 6, 2026.
- — August: business +14.2%, city +1.0%: Finalized estimated settled ADR for Shiga Prefecture in August 2026 was ¥8,706 for business hotels (N=80 properties) and ¥15,767 for city hotels (N=12 properties), a 13.2-point gap in growth rates.
- — September: both segments below the prior year: Business −4.6% (¥7,505), city −9.4% (¥13,872). Business hotels are still +11.1% versus September 2024, so the upward trend holds.
- — 40 of 77 properties up 10% or more: On a same-property basis, more than half of business hotels posted double-digit gains in August. Ten of 12 city hotels also rose; the real split was among city hotel properties.
- — Rising while Kyoto fell 15.6% and Osaka 33.6%: In August, business hotels in Kyoto and Osaka prefectures fell well below the prior year, while Shiga moved the other way at +14.2%.
- — Last October was +18.7%: October of last year (¥7,861), when the Japan Games (Kokuspo) and the Expo overlapped, is the highest hurdle of the second half. Measure your own property against both the prior year and the same month two years ago.
July–September finalized figures — business hotels +14.2% in August, then below the prior year in September
We start with the finalized prefecture-wide figures. Business hotels came in at ¥7,425 in July, up 4.5% year on year, and ¥8,706 in August, up 14.2%, widening their gains into the peak of summer. City hotels, by contrast, were almost flat at +0.4% in July and +1.0% in August, leaving a 13.2-point gap between the two segments in August growth.
September looked different. Business hotels were ¥7,505 (−4.6%) and city hotels ¥13,872 (−9.4%), with both segments falling short of the prior year. September was the only one of the nine months from January to September 2026 in which business hotels fell below the prior year, showing that summer momentum did not simply carry into autumn. The segment trends for January–June are covered in Shiga Settled ADR H1 2026: Business Hotels +4.8%, Resort Hotels −2.9%.
| Segment | Month | 2025 | 2026 | YoY | Properties (2025 / 2026) |
|---|---|---|---|---|---|
| Business hotels | July | ¥7,108 | ¥7,425 | +4.5% | N=83 / 82 |
| Business hotels | August | ¥7,621 | ¥8,706 | +14.2% | N=82 / 80 |
| Business hotels | September | ¥7,866 | ¥7,505 | −4.6% | N=82 / 80 |
| City hotels | July | ¥12,338 | ¥12,389 | +0.4% | N=12 / 12 |
| City hotels | August | ¥15,606 | ¥15,767 | +1.0% | N=12 / 12 |
| City hotels | September | ¥15,312 | ¥13,872 | −9.4% | N=12 / 11 |
Source: Compiled by the HotelBank Editorial Team from MetroEngines Research data
Overlaying the yearly lines makes the position of this move clear. In Figure 1, business hotels raised their August level two years running: ¥7,092 in August 2024, ¥7,621 in August 2025 and ¥8,706 in August 2026. September dipped below the 2025 line (¥7,866), but it remains 11.1% above the ¥6,754 of September 2024.
Figure 1: Estimated settled ADR for Shiga business hotels (yearly overlay; all finalized; 2026 covers January–September)
Source: Compiled by the HotelBank Editorial Team from MetroEngines Research data
City hotels show a contrasting shape. As Figure 2 shows, August stayed within a narrow band for three straight years — ¥15,783 in 2024, ¥15,606 in 2025 and ¥15,767 in 2026 — so the summer ceiling has barely moved. In addition, 2026 has run below the prior year since early spring (March −6.7%, April −1.2%, May −3.3%, June −4.7%), so the small gains in July and August read less as sluggish growth and more as a return to prior-year levels.
Figure 2: Estimated settled ADR for Shiga city hotels (yearly overlay; all finalized; 2026 covers January–September)
Source: Compiled by the HotelBank Editorial Team from MetroEngines Research data
Property-level distribution — 40 of 77 business hotels up 10% or more in August; 10 of 12 city hotels also rose
The prefecture-wide median alone, however, cannot tell us whether a few properties pulled the figure up or the whole market moved. Table 2 therefore takes only properties with finalized figures for the same month in both years and lays out each property’s year-on-year change.
| Segment | Month | Properties | Property-level YoY (median) | +10% or more | 0% to under +10% | Below prior year |
|---|---|---|---|---|---|---|
| Business hotels | July | 79 | +5.7% | 26 | 30 | 23 |
| Business hotels | August | 77 | +10.3% | 40 | 22 | 15 |
| Business hotels | September | 77 | −4.5% | 12 | 15 | 50 |
| City hotels | July | 12 | +4.6% | 3 | 4 | 5 |
| City hotels | August | 12 | +7.7% | 5 | 5 | 2 |
| City hotels | September | 11 | +0.8% | 3 | 3 | 5 |
Source: Compiled by the HotelBank Editorial Team from MetroEngines Research data
For business hotels in August, 40 of 77 properties (52%) rose 10% or more, and 22 of those rose 20% or more. Only 15 properties, roughly 20%, fell below the prior year, and the property-level median reached +10.3%. In other words, the +14.2% in August was not driven by a few outliers; it reflects more than half of properties raising rates by double digits.
In September this distribution flipped. Fifty of 77 properties (65%) fell below the prior year, and 26 of those dropped 10% or more. The property-level median was −4.5%, almost identical to the prefecture-wide −4.6%.
City hotels in August need more careful reading. The prefecture-wide median is +1.0%, but at the property level 10 of 12 properties exceeded the prior year and the property-level median is +7.7%. The remaining two properties both fell 10% or more, and because the median of 12 properties is set by the two middle properties, the gainers and decliners offset each other. It is closer to reality to say not that city hotels failed to rise, but that the direction split by property and the central level did not move.
City breakdown — August gains in the south (Otsu, Kusatsu); September pullback in Nagahama, Kusatsu and Hikone
Next we break down business hotels by city. Table 3 sets out finalized figures for the eight cities with five or more properties, for August and September.
| City | Aug 2025 | Aug 2026 | YoY | Sep 2025 | Sep 2026 | YoY | Properties |
|---|---|---|---|---|---|---|---|
| Otsu | ¥8,110 | ¥10,904 | +34.5% | ¥9,117 | ¥9,002 | −1.3% | N=11–12 |
| Kusatsu | ¥8,678 | ¥9,960 | +14.8% | ¥9,906 | ¥8,473 | −14.5% | N=7 |
| Hikone | ¥8,360 | ¥9,022 | +7.9% | ¥8,520 | ¥7,699 | −9.6% | N=11–12 |
| Nagahama | ¥8,649 | ¥9,577 | +10.7% | ¥9,259 | ¥7,716 | −16.7% | N=9 |
| Omihachiman | ¥8,532 | ¥7,523 | −11.8% | ¥7,492 | ¥7,323 | −2.3% | N=8–9 |
| Koka | ¥6,750 | ¥6,737 | −0.2% | ¥6,310 | ¥6,715 | +6.4% | N=7–8 |
| Higashiomi | ¥6,898 | ¥9,130 | +32.4% | ¥7,102 | ¥7,076 | −0.4% | N=6 |
| Konan | ¥7,416 | ¥8,684 | +17.1% | ¥7,202 | ¥7,471 | +3.7% | N=5–6 |
Source: Compiled by the HotelBank Editorial Team from MetroEngines Research data
Otsu stands out in August, rising 34.5% from ¥8,110 to ¥10,904. Higashiomi (+32.4%), Konan (+17.1%) and Kusatsu (+14.8%) followed, while Omihachiman (−11.8%) and Koka (−0.2%) were flat or below the prior year. On a same-property basis as well, the four cities along the JR Biwako Line — Otsu, Kusatsu, Moriyama and Ritto (23 properties) — had a property-level median of +17.2%, with 18 properties up 10% or more. The three cities of Hikone, Nagahama and Maibara (21 properties) were +8.2% and other municipalities (33 properties) +6.2%, so the August gains were led by the southern part of the prefecture.
In September, conversely, both the areas that rose in August and the northeast of the prefecture fell. Nagahama (−16.7%), Kusatsu (−14.5%) and Hikone (−9.6%) saw the largest declines; on a same-property basis, the four cities above had a median of −6.5% (18 of 23 properties below the prior year) and the three cities of Hikone, Nagahama and Maibara −8.1% (17 of 21 below the prior year). Other municipalities held flat at +0.7%.
Cutting by price band pinpoints the pullback further. The top third by September rate last year (26 properties, at ¥9,228 or above in September 2025) had a property-level median of −15.9%, with 24 properties below the prior year. The bottom third (25 properties), by contrast, was up 3.1%, so the September decline was concentrated in properties that had posted high rates a year earlier.
Neighboring prefectures — Shiga rose in August while Kyoto and Osaka fell; in September it fell while four neighbors posted double-digit gains
Widening the view, we compare with business hotels in neighboring prefectures. Table 4 compares August and September year-on-year changes using finalized figures on the same definition.
| Prefecture | Aug 2025 | Aug 2026 | YoY | Sep 2025 | Sep 2026 | YoY | Properties (Aug / Sep 2026) |
|---|---|---|---|---|---|---|---|
| Shiga | ¥7,621 | ¥8,706 | +14.2% | ¥7,866 | ¥7,505 | −4.6% | N=80 / 80 |
| Fukui | ¥7,966 | ¥8,847 | +11.1% | ¥7,184 | ¥7,923 | +10.3% | N=45 / 46 |
| Gifu | ¥7,510 | ¥8,057 | +7.3% | ¥7,242 | ¥8,713 | +20.3% | N=122 / 122 |
| Nara | ¥8,936 | ¥9,461 | +5.9% | ¥7,888 | ¥9,035 | +14.5% | N=31 / 32 |
| Mie | ¥7,825 | ¥7,696 | −1.6% | ¥6,365 | ¥7,633 | +19.9% | N=93 / 93 |
| Kyoto | ¥11,846 | ¥9,993 | −15.6% | ¥11,992 | ¥11,701 | −2.4% | N=325 / 327 |
| Osaka | ¥13,211 | ¥8,772 | −33.6% | ¥13,450 | ¥8,872 | −34.0% | N=503 / 504 |
Source: Compiled by the HotelBank Editorial Team from MetroEngines Research data
Shiga’s +14.2% in August was the largest gain among the seven prefectures in Table 4. It came while Kyoto fell 15.6% (¥11,846 → ¥9,993) and Osaka 33.6%, and the rate gap with Kyoto narrowed from ¥4,225 last August to ¥1,287. The background to keep in mind is a one-off factor last year: Expo 2025 Osaka, Kansai ran from April 13 to October 13, 2025. Last August, during the Expo, Shiga’s growth was only +7.5% versus 2024, so the level to beat was likely not as high as in Kyoto and Osaka. How the post-Expo pullback spread in Osaka is tracked month by month in Osaka Settled ADR June 2026: City -26.3%, Business -32.8% Post-Expo.
Note that the Lake Biwa Great Fireworks Festival in early August fell in the same month in both years — August 8 (Fri) in 2025 and August 6 (Thu) in 2026 — and both years had five Saturdays and five Sundays. The gain is hard to explain by event timing or the calendar, so the natural reading is that properties in the south of the prefecture raised their summer price level itself.
In September the picture reverses. Excluding Kyoto (−2.4%) and Osaka (−34.0%), where the Expo was running a year earlier, four neighboring prefectures posted double-digit gains — Gifu +20.3%, Mie +19.9%, Nara +14.5% and Fukui +10.3% — and Shiga alone fell below the prior year at −4.6%. September 19–23, 2026 formed a five-day holiday, and estimated OCC (OTA-listed inventory basis) for Shiga business hotels filled to 98.7% on the 19th, 99.8% on the 20th and 99.6% on the 21st (45–46 properties / 4,334–4,429 rooms, based on listings on major booking sites). With occupancy that high and rates still short of the prior year, it is reasonable to read the cause as lying on the comparison side. When bookings for this holiday built up can be checked by stay date in Shiga Silver Week: Front 3 Days Settled, Sep 23 Below a Normal Thu.
In September last year, Shiga hosted the Japan Games (Kokuspo; “Wata SHIGA Kagayaku Kokuspo”). Pre-session competitions began on September 6, the main session ran from September 28 to October 8, and the opening and closing ceremonies were held in Hikone. Business hotels in September 2025 rose a sharp 16.5% versus 2024, and the prior-year level, lifted by the Games and the final weeks of the Expo, has become this year’s hurdle.
The second-half hurdle — business hotels were +18.7% last October; a phase of how much to hold rather than how much to exceed
If the September pullback stems from prior-year factors, the same pattern continues into the second half. Table 5 shows the finalized figures for the second half of the last fiscal year, which now become the comparison base, and how much each month had grown at the time.
| Month | Business: last fiscal year (finalized) | YoY at the time | City: last fiscal year (finalized) | YoY at the time |
|---|---|---|---|---|
| October | ¥7,861 (N=83) | +18.7% | ¥14,227 (N=12) | +8.3% |
| November | ¥7,859 (N=83) | +10.3% | ¥15,922 (N=12) | +2.1% |
| December | ¥7,078 (N=83) | +5.8% | ¥11,614 (N=12) | +1.5% |
| January | ¥6,984 (N=83) | +11.4% | ¥11,283 (N=12) | +2.8% |
| February | ¥6,682 (N=84) | +3.4% | ¥11,415 (N=12) | +3.7% |
| March | ¥7,337 (N=83) | +6.8% | ¥11,914 (N=12) | −6.7% |
Source: Compiled by the HotelBank Editorial Team from MetroEngines Research data
For business hotels the highest wall is October. Last October was ¥7,861, up 18.7% versus 2024 — even stronger than September’s +16.5%. The main session of the Japan Games ran until October 8 and the Expo until October 13, and the National Sports Games for Persons with Disabilities (Shospo) was held on October 25–27. As prior-year growth eases through November (¥7,859, +10.3%) and December (¥7,078, +5.8%), year-on-year comparisons may gradually improve with October as the low point.
City hotels are different: prior-year growth was small at +8.3% in October, +2.1% in November and +1.5% in December. November’s ¥15,922 was the highest monthly figure of 2025, so the focus is on how far autumn-foliage-season rates can be reproduced. That said, since September was −9.4% year on year and back to roughly the September 2024 level (¥13,867), city hotels should check the level of two years ago as well as the year-on-year figure.
Current picture in estimated OCC — weekdays beat Saturdays in August; October Saturdays around 80% at 45 days out
After price, we check the shape of occupancy. Table 6 averages estimated OCC (OTA-listed inventory basis) by day of week for business hotels in August 2026 (34–41 properties / 3,351–4,191 rooms, based on listings on major booking sites). The monthly average was 90.4%.
| Day | Days | Average | Highest day | Lowest day |
|---|---|---|---|---|
| Monday | 5 | 90.0% | Aug 10 (94.2%) | Aug 31 (80.7%) |
| Tuesday | 4 | 94.9% | Aug 4 (96.6%) | Aug 25 (92.7%) |
| Wednesday | 4 | 92.9% | Aug 19 (96.0%) | Aug 26 (90.6%) |
| Thursday | 4 | 93.5% | Aug 13 (96.8%) | Aug 27 (90.5%) |
| Friday | 4 | 87.1% | Aug 14 (95.1%) | Aug 28 (81.4%) |
| Saturday | 5 | 92.1% | Aug 22 (95.9%) | Aug 29 (86.1%) |
| Sunday | 5 | 83.9% | Aug 9 (94.6%) | Aug 30 (74.4%) |
Source: Compiled by the HotelBank Editorial Team from MetroEngines Research data
By day of week, midweek days led — Tuesday 94.9%, Thursday 93.5% and Wednesday 92.9% — all above Saturday’s 92.1%. The highest days were Thursday, August 13 (96.8%) and Tuesday, August 4 (96.6%); the lowest was Sunday, August 30 (74.4%). This suggests that weekday business demand, not just summer-holiday leisure demand, supported the base.
Next we check October booking pace with booking curves. Table 7 and Figure 3 track estimated OCC by stay date from 45 days before the stay to the latest observation.
| Stay date | 45 days out | 30 days out | Latest observation | Gain since 45 days out |
|---|---|---|---|---|
| Oct 10 (Sat, first day of 3-day weekend) | 82.0% | 90.6% | 98.4% (5 days out) | +16.4pt |
| Oct 14 (Wed) | 62.0% | 67.8% | 83.7% (9 days out) | +21.7pt |
| Oct 17 (Sat) | 82.8% | 89.8% | 93.7% (12 days out) | +10.9pt |
| Oct 21 (Wed) | 65.3% | 70.7% | 83.0% (16 days out) | +17.7pt |
| Oct 24 (Sat) | 75.6% | 85.2% | 93.3% (19 days out) | +17.7pt |
| Oct 31 (Sat) | 83.1% | 89.7% | 91.4% (26 days out) | +8.3pt |
Source: Compiled by the HotelBank Editorial Team from MetroEngines Research data
Figure 3: October booking curves by stay date (Shiga business hotels; 44 properties / 4,317 rooms; based on listings on major booking sites)
Source: Compiled by the HotelBank Editorial Team from MetroEngines Research data
Saturdays and weekdays book in clearly different ways. October Saturdays were already 75.6–83.1% filled at 45 days out, and October 10, the first day of the three-day weekend, reached 90.6% at 30 days out and 98.4% at 5 days out. Wednesdays, by contrast, started low at 62.0–65.3% at 45 days out and added 15.9 points (October 14) and 12.3 points (October 21) from 30 days out onward. Two patterns coexist: weekdays take shape in the final 30 days, while Saturdays are largely decided before the 45-day mark.
For revenue managers running business and city hotels in Shiga — implications and action plan
How should these data be applied to your own property? We organize four readings from the standpoint of operating a business or city hotel in Shiga.
1. Separate the prefecture median from your own position. Business hotels in August had a median of ¥8,706 (+14.2%), and on a same-property basis 40 of 77 properties were up 10% or more. If your own August year-on-year gain was in single digits, you landed more modestly than over half of properties, and there is room to review next summer’s pricing calendar.
2. Do not assume the September decline means weak demand. Estimated OCC in the first half of the five-day holiday (September 19–21) filled to 98.7–99.8%, and the −4.6% reads as the flip side of September last year being +16.5% versus 2024. Against September 2024 it is +11.1%; evaluate with two yardsticks side by side — the prior year and the same month two years ago.
3. October is likely to look toughest year on year. Last October was ¥7,861 (+18.7%), the strongest growth of the second half. Properties that posted high rates during last year’s Games period are more likely to see the same kind of pullback as in September (−15.9% for the top third).
4. Booking patterns differ by day of week. October Saturdays were at 75.6–83.1% at 45 days out, Wednesdays at 62.0–65.3%. Structurally, early pricing tends to drive revenue on Saturdays, and how well rates are held in the final 30 days does so on weekdays.
| Timeframe | Action | Decision trigger (figures from this article) | Aim |
|---|---|---|---|
| Today to this week | Review weekday rates for late October and consider settings that do not rush into early discounts | Market Wednesdays stood at 67.8–70.7% at 30 days out and added 12.3–15.9 points by the latest observation. If your weekdays show similar pace at 30 days out | Avoid taking the business demand that arrives in the final 30 days at lowered rates |
| Today to this week | Prepare two yardsticks for evaluating October: the prior year and the same month two years ago | Business hotels last October were ¥7,861 (+18.7%). If your October outlook is below the prior year | Separate an apparent slowdown caused by prior-year one-off factors from a change in underlying performance |
| Within 2 weeks | Lock in rates for November Saturdays and holiday weekends before they reach 45 days out | October Saturdays were already 75.6–83.1% filled at 45 days out. If your November Saturdays are inside 45 days and still at normal rates | Be in a position to take demand at a matching price before the bulk of bookings arrive |
| Within 2 weeks | Strip the Games-period portion out of last year’s September–October results to identify the normal-period base | The top third by September rate last year was −15.9% (24 of 26 properties below the prior year). If your property was at ¥9,228 or above in September last year | Prevent excessive rate swings caused by targeting non-repeatable prior-year results |
| Next month to fiscal year-end | City hotels: check November foliage-season rates against last year’s annual high | City hotels last November were ¥15,922 (+2.1%). In August, 10 of 12 properties exceeded the prior year. If your property got back to prior-year levels in August | Look for a chance to reverse the below-prior-year trend since spring in the peak month |
| Next month to fiscal year-end | Rebuild next summer’s pricing calendar from this summer’s finalized figures | Business hotels in August were ¥8,706 (+14.2%); the four cities of Otsu, Kusatsu, Moriyama and Ritto had a property-level median of +17.2%. If your August came in below market growth | Build the level the market has moved up to into next year’s starting point early |
For every action, the starting point is to match market figures against your own results for the same month and the same day of week. Market movements are one input; weigh them against your own guest mix and contract structure.
Summary — read it on three points: median, distribution and two years ago
To sum up, Shiga’s summer can be read with three yardsticks. The first is the median: business hotels rose to ¥8,706 (+14.2%) in August, while city hotels stayed at the same level for a third year at ¥15,767 (+1.0%). The second is the property-level distribution: 40 of 77 business hotels were up 10% or more and 10 of 12 city hotels also rose, so the segments did not diverge in direction as much as the gap in medians suggests; the split was rather among city hotel properties.
The third is the comparison with two years ago. In September business hotels fell 4.6% below the prior year, but against September 2024 they are up 11.1% and the upward trend holds. Last autumn, when the Japan Games and the Expo overlapped, growth reached +18.7% in October, so year-on-year figures are likely to look weak in the second half. Rather than being pulled along by the year-on-year figure alone, lining up the median, the distribution and the two-years-ago level to measure your own position will be the foundation of rate strategy for this second half.
Frequently Asked Questions
Q. What was the ADR of business hotels in Shiga Prefecture in August 2026?
A. Estimated settled ADR (tax-exclusive equivalent, finalized) was ¥8,706 (N=80), up 14.2% from ¥7,621 in the same month a year earlier. On a same-property basis, 40 of 77 properties rose 10% or more.
Q. Why did September fall below the prior year?
A. September last year rose a sharp 16.5% versus 2024, helped by the Japan Games (Kokuspo) and other factors, so the comparison base was likely high. The ¥7,505 of September 2026 is +11.1% versus September 2024.
Q. Are city hotels not growing?
A. The prefecture-wide median was +1.0% in August, but at the property level 10 of 12 properties exceeded the prior year. The median did not move because the direction split by property.
About the Data
- Definition of estimated OCC (OTA-listed inventory basis): OTA-listed-inventory occupancy = 100 − 100 × rooms remaining on OTAs ÷ total rooms. The scope is a fixed cohort of properties that list 30% or more of their total rooms on OTAs (the same set of properties for every stay date; N in this article is that number of properties). It is an estimate based on how inventory sold on OTAs is being consumed and is defined differently from actual room occupancy (it runs high because unlisted rooms are counted as sold). The months covered are August and September 2026; the booking curves cover stay dates in October 2026.
- Booking curves: based on observations from 45 days before the stay date to the latest observation.
- Definition of estimated settled ADR: the transacted price level (tax-exclusive equivalent) estimated from OTA and other sales data (lowest-plan price level × segment-specific coefficients; an ensemble across multiple channels). Past months are finalized figures; current and future months are estimates based on current sales conditions. Median error is 6.6% when checked against published operating results. All year-on-year changes in this article are calculated between finalized figures, and area values are the median of property-level values.
- Scope breakdown: Shiga business hotels N=79–84 properties (varies by month; N=80 in August 2026) and city hotels N=11–12 properties. Same-property comparisons use properties with finalized figures for the same month in both years (77–79 business hotels, 11–12 city hotels). The city table covers the eight cities with five or more properties. Booking curves and estimated OCC cover business hotels: 44 properties / 4,317 rooms for October stay dates and 34–41 properties / 3,351–4,191 rooms for August 2026 (based on listings on major booking sites).
- Data as of October 6, 2026. Sales conditions and inventory change daily, so the figures in this article are a snapshot at the time of retrieval.
References and Sources
■ Data sources
MetroEngines Research accommodation-plan sales data, and the estimated settled ADR (tax-exclusive equivalent) and OTA-listed-inventory estimated OCC derived from it. Compiled by the HotelBank Editorial Team as of October 6, 2026. The external sources in the table below were used to confirm event schedules, fireworks dates and public holidays.
■ Calculation assumptions
All year-on-year and two-year comparisons are calculated between finalized figures, and prefecture and city values are the median of property-level estimated settled ADR. Same-property comparisons are limited to properties with finalized figures for the same month in both years, and the city table lists only the eight cities with five or more properties. The October booking curves are observations from 45 days before the stay date to the latest observation, using the same set of properties (44 business hotels) for each stay date.
■ Limitations and caveats
City hotels cover only 11–12 properties, so the median moves easily with the pricing of a few properties. Estimated settled ADR is an estimate with a median error of 6.6% against published operating results. Estimated OCC runs higher than actual room occupancy because unlisted rooms are counted as sold. Figures for October stay dates may change with future sales. Prior-year event factors such as the Japan Games and the Expo are interpretations based on coinciding timing; causality has not been tested.
| Source | What was referenced |
|---|---|
| Wata SHIGA Kagayaku Kokuspo / Shospo 2025, “Kokuspo Schedule” | Japan Games session dates (September 28–October 8, 2025), start date of pre-session competitions, venue of the opening and closing ceremonies |
| Wata SHIGA Kagayaku Kokuspo / Shospo 2025, “Shospo Schedule” | Shospo session dates (October 25–27, 2025) |
| Japan Association for the 2025 World Exposition, “Overview” | Dates of Expo 2025 Osaka, Kansai (April 13–October 13, 2025) |
| Lake Biwa Great Fireworks Festival official website | 2026 date (August 6) |
| Shiga Prefecture press release, “Official ticket sales site for the Lake Biwa Great Fireworks Festival opens” | 2025 date (August 8) |
| Cabinet Office, “National Holidays” | Public holidays on September 21–23, 2026, and Sports Day on October 12 |
Related Articles
- Shiga Settled ADR H1 2026: Business Hotels +4.8%, Resort Hotels −2.9%
- Shiga Silver Week: Front 3 Days Settled, Sep 23 Below a Normal Thu
- Osaka Settled ADR June 2026: City -26.3%, Business -32.8% Post-Expo
- Kyoto Hotel ADR Falls YoY in June 2026: City -14.6%, Business -9.8%
- Fukui Settled ADR H1 2026: Business +4.4%, City +7.0%, Gains in Q2
- Shiga Hotel Development: 1.5% New Supply, ¥11-16k Whitespace, 8.0% NOI