


Within the coverage of MetroEngines Research, 73 lodging properties with 1,666 rooms opened in Kumamoto Prefecture in 2026 as of November 14, doubling the 832 rooms (38 properties) added in 2025. Eleven business hotels account for 1,058 of those rooms, or 63.5%, and their locations split almost evenly between central Kumamoto City and the Kumamoto Airport/Ozu area, where semiconductor plants are concentrated. However, two of the six largest openings, with 224 rooms, are renovations or rebrands of existing properties, so rooms added in new buildings total at most 1,442. This article sorts the 73 properties by segment and area, then overlays room-stock growth in the Airport/Ozu 5km radius and central Kumamoto, estimated settled ADR by municipality, and the 2026 official land prices to give a reading of Kumamoto supply that can be used for development and lending decisions.
• ADR (average daily rate) = an estimated settled rate (tax-excluded equivalent), calculated by applying a segment-specific adjustment factor to the lowest plan level each property publishes on OTAs (per-room rate for two guests, tax included). Compared with property-level results disclosed by listed hotel REITs (91 properties, latest three months), the median error is about 7%. These are estimates and differ from each property’s actual settled prices and accounting figures.
• Area-level ADR (prefecture or municipality) is the median of the estimated settled rates of the properties covered, representing a typical property in that area.
• References to listed prices are per-room rates for two guests, tax included.
• OCC (occupancy) = rooms sold as a share of total rooms in the area (an estimate based on OTA sales inventory).
• Source: MetroEngines Research (continuously tracks OTA public prices for about 168,000 properties in Japan, of which about 27,000 are confirmed active)
Opening counts and room counts are based on the establishment dates of properties confirmed as listed on major booking sites (OTA listing basis, N=73 properties). Because listings appear several months before opening, the 2026 figures may rise as properties opening toward year-end are listed. The opening dates and room counts of the six properties discussed individually are those confirmed from operator announcements and press reports. The survey date is November 14, 2026.
- — The most rooms in five years. The 1,666 rooms of 2026 exceed the 1,385 rooms of 2022, when large openings clustered in central Kumamoto City. The five properties with 100 or more rooms alone account for 957 rooms (57.4%).
- — Supply concentrated in two areas. The central Kumamoto 3km radius added 523 rooms and the Kumamoto Airport/Ozu 5km radius added 512, followed by Aso with 219 and Amakusa with 133.
- — Airport/Ozu 5km room stock grew 1.9x in four years. The median estimated settled ADR of seven existing properties in the radius ran −4.1% to −13.4% YoY from January to July 2026, then narrowed the gap to −7.8% in October.
- — Rates are rising in Kumamoto’s Chuo Ward. October estimated settled ADR was about ¥10,300, up 19.5% YoY (N=61). Official commercial land prices also rose 6.2%, a wider gain than the year before.
- — Net new supply is at most 1,442 rooms. Of the 1,666 rooms opened, 224 are renovations or rebrands. Growth against existing stock differs sharply: +7.3% in the central 2km radius versus +92.1% from 2022 in the Airport/Ozu 5km radius. Room for further openings is best gauged by how far rates at existing properties in each radius recover.
2026 Brought 73 Properties and 1,666 Rooms — Above 2022 and the Most in Five Years
Start with the annual trend. Confirmed openings in Kumamoto Prefecture were 45 properties with 1,385 rooms in 2022, 39 with 456 in 2023, 43 with 519 in 2024, and 38 with 832 in 2025. As of November 14, 2026 stands at 73 properties and 1,666 rooms, the highest of the five years on both measures. In 2022, openings of 180 to 380 rooms overlapped in Kumamoto City’s entertainment district, yet 2026 exceeds that year by 281 rooms.
The growth in properties and the growth in rooms have different drivers, however. Of the 73 properties, 49 have fewer than 10 rooms and total only 79 rooms between them. What lifted the room count was the five properties with 100 or more rooms, whose 957 rooms make up 57.4% of the total. In other words, 2026 in Kumamoto combined a rising number of small properties such as vacation rentals with a large room increase led by business hotels.
The breakdown by segment makes this pattern clearer. Business hotels number 11 properties with 1,058 rooms: 15.1% of properties but 63.5% of rooms. Vacation rentals, by contrast, are 39 properties, or 53.4% of the count, but only 101 rooms. Resort hotels add 5 properties and 324 rooms, centered on stay-oriented properties in the Aso area.
| Segment | Properties | Rooms | Share of Rooms | Rooms per Property |
|---|---|---|---|---|
| Business hotels | 11 | 1,058 | 63.5% | 96.2 |
| Resort hotels | 5 | 324 | 19.4% | 64.8 |
| Vacation rentals | 39 | 101 | 6.1% | 2.6 |
| Hostels | 6 | 94 | 5.6% | 15.7 |
| Ryokan | 2 | 35 | 2.1% | 17.5 |
| Other (lodges, cottages, glamping, etc.) | 10 | 54 | 3.2% | 5.4 |
| Total | 73 | 1,666 | 100.0% | 22.8 |
The Top Six Hold 1,047 Rooms — Two of Them, with 224 Rooms, Are Renovations or Rebrands
Next, look at the six largest openings individually. Together they hold 1,047 rooms, or 62.8% of the 2026 total. The point to watch is that properties counted as openings mix newly built hotels with existing buildings that were renovated and renamed. Operator announcements and press reports show that four of the six, with 823 rooms, are new builds, while two, with 224 rooms, are renovations or rebrands of existing properties.
| Property | Location | Rooms | Opening Date | Type |
|---|---|---|---|---|
| Via Inn Prime Kumamoto (Hibari no Yu) (ヴィアインプライム熊本<雲雀の湯>) | Nishi Ward, Kumamoto City (near Kumamoto Station) | 232 | Jul 22 | New build |
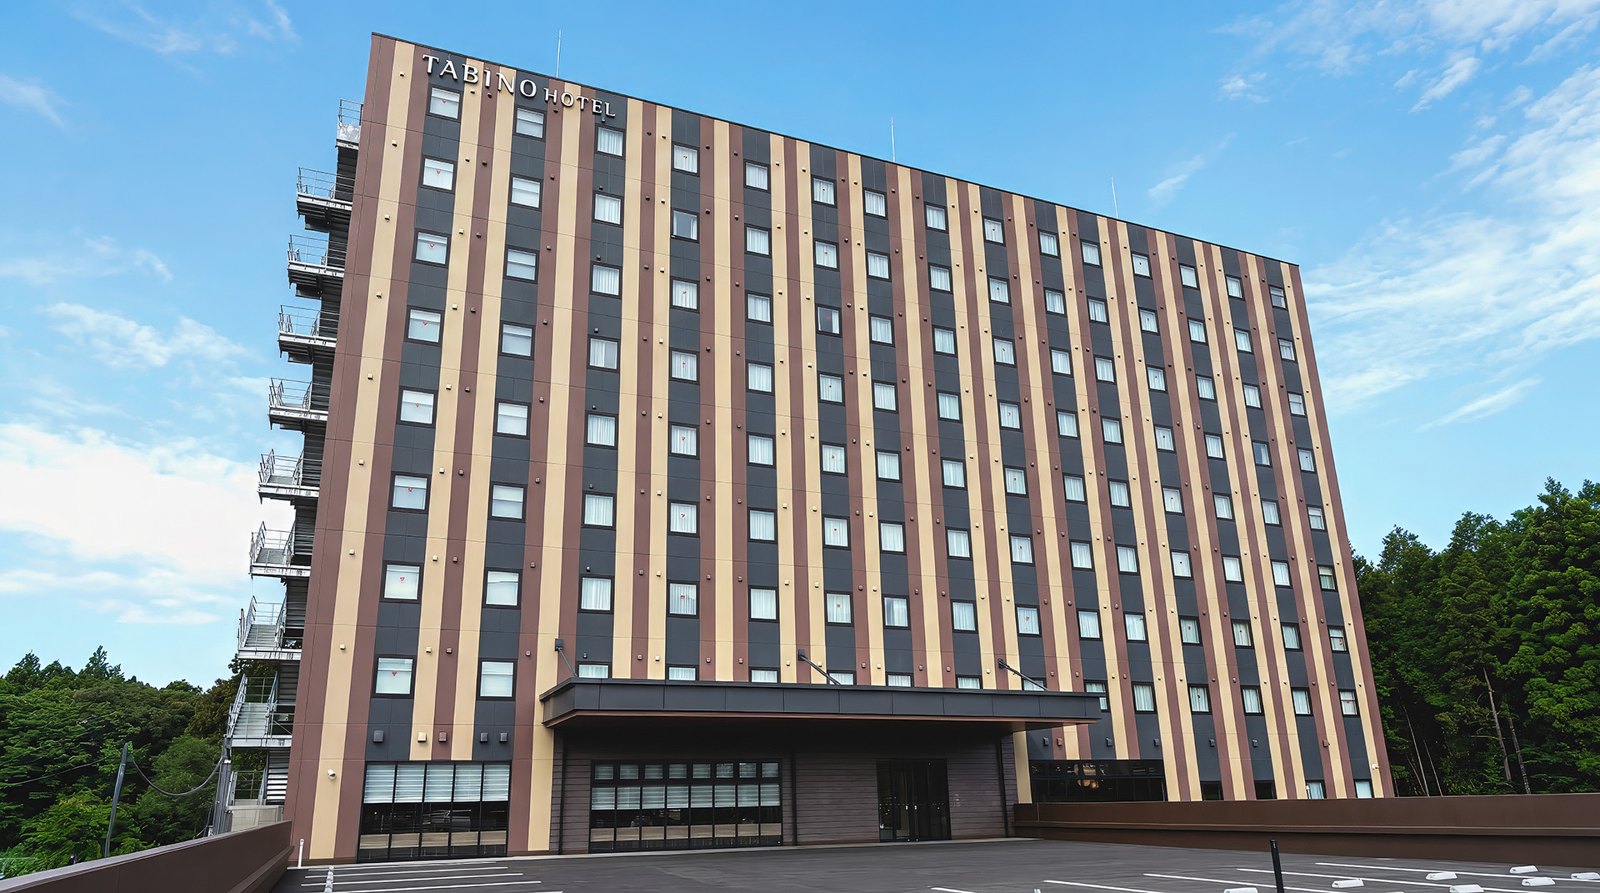
| Tabino Hotel Aso Kumamoto Airport (たびのホテル阿蘇熊本空港) | Ozu Town | 213 | Apr 17 | New build |
| Workers Hotel Kumamoto Ozu (ワーカーズホテル熊本大津) | Ozu Town | 202 | Feb 1 | New build |
| Hotel Amanek Kumamoto (ホテルアマネク熊本) | Shimotori, Chuo Ward, Kumamoto City | 176 | Sep 17 | New build |
| Kame no Yu by HATAGO INN (亀の湯 by HATAGO INN) | Higashi Ward, Kumamoto City (near Kumamoto IC) | 134 | Nov 1 | Rebrand |
| La Vista Minamiaso (ラビスタ南阿蘇) | Minamiaso Village | 90 | Oct 2 | Renovation |
Via Inn Prime Kumamoto (Hibari no Yu), near Kumamoto Station, is the prefecture’s largest opening of 2026 at 232 rooms and features a large communal bath (its location is assessed in our Kumamoto Station 1km analysis). Tabino Hotel Aso Kumamoto Airport in Ozu is a mid- to long-stay property with a washing machine and microwave in all 213 rooms, and it has received Kumamoto Prefecture’s approval as a “regional economic driver project” (see the business-demand site model). Also in Ozu, Workers Hotel Kumamoto Ozu marks the first entry into the prefecture for a brand from Oita, and Hotel Amanek Kumamoto in Shimotori is likewise that brand’s first property in Kumamoto, making 2026 a year of notable entry by out-of-prefecture capital.
Meanwhile, Kame no Yu by HATAGO INN is a rebrand of the former Tsurunoyu Kumamoto Interchange, and La Vista Minamiaso is a renovation of the former Greenpia Minamiaso, adding a new option among stay-oriented resorts in Aso. Because these two properties’ 224 rooms already existed as room stock, the 1,442 rooms left after subtracting them from 1,666 can be read as the upper limit of rooms added in new buildings. Properties ranked seventh and below were not individually checked as new builds or conversions, so net growth may be smaller. When measuring supply pressure, this net basis is more useful than the headline opening count.
An earthquake also struck the Kumamoto region on July 28, 2026. Set against that date, three of the top six opened before the earthquake (Workers Hotel Kumamoto Ozu, Tabino Hotel Aso Kumamoto Airport, and Via Inn Prime Kumamoto) and three opened after it (Hotel Amanek Kumamoto, La Vista Minamiaso, and Kame no Yu by HATAGO INN). Lodging stock in the prefecture after the disaster is covered in our analysis of Kumamoto’s lodging stock and recovery.
Supply Concentrated in Two Areas — Central Kumamoto 523 Rooms, Airport/Ozu 512
So where did the 1,666 rooms go? Using property coordinates, we defined a 3km radius around Torichosuji tram stop as “Central Kumamoto,” a 5km radius around Tabino Hotel Aso Kumamoto Airport as “Airport/Ozu,” the area around Mount Aso in the east of the prefecture as “Aso,” and the Kami-Amakusa and Amakusa city area as “Amakusa.” Central Kumamoto took 16 properties and 523 rooms and Airport/Ozu took 5 properties and 512 rooms. Each holds just over 30% of the rooms, for a combined 62.1%.
| Area | Properties | Rooms | Share | Main Properties with 10+ Rooms |
|---|---|---|---|---|
| Central Kumamoto (Torichosuji 3km) | 16 | 523 | 31.4% | Via Inn Prime Kumamoto, Hotel Amanek Kumamoto, six small properties of 7–15 rooms, and others |
| Airport/Ozu (5km) | 5 | 512 | 30.7% | Tabino Hotel Aso Kumamoto Airport, Workers Hotel Kumamoto Ozu, and others |
| Aso | 19 | 219 | 13.1% | La Vista Minamiaso, TAOYA Aso, Minamiaso Field Hotel, and others |
| Amakusa | 12 | 133 | 8.0% | HOTEL R9 The Yard Kamiamakusa and others |
| Other (northern and southern prefecture, Kumamoto City suburbs) | 21 | 279 | 16.7% | Kame no Yu by HATAGO INN, HOTEL R9 The Yard Yamaga, and others |
Although each holds about 30%, the two areas differ greatly in character. Central Kumamoto gained two properties of 232 and 176 rooms plus six small inns of 7 to 15 rooms under one brand, forming a layered mix that serves both leisure and business travelers. In Airport/Ozu, three of the five properties are business hotels with 457 rooms, clearly targeting business demand from semiconductor-related construction, equipment installation and corporate travel. In Aso, 15 of the 19 properties have fewer than 10 rooms, with small lodgings led by vacation rentals driving the property count.
Airport/Ozu 5km — Room Stock Up 1.9x in Four Years, 85% Business Hotels
Now consider Airport/Ozu as a business location from the room-stock side. Room stock here covers lodging properties with 10 or more rooms (excluding leisure hotels) within 5,000m of Tabino Hotel Aso Kumamoto Airport. “Active” means a selling price was confirmed on major booking sites in the latest three months (September to November 2026), as of November 14, 2026, based on MetroEngines Research tabulations.
Listed stock in this radius is 21 properties with 2,248 rooms, of which 17 properties with 2,069 rooms are active. By segment, business hotels account for 14 properties and 1,909 rooms, or 84.9% of listed rooms, and properties opened in the 2020s make up 8 properties and 1,020 rooms, or 45.4%. The annual trend shows how fast this changed. Stock held flat at 9 properties and 1,086 rooms through 2022, reached 10 properties and 1,163 rooms in 2023, rose to 12 properties and 1,575 rooms in 2025 with additions such as Toyoko Inn Kumamoto Airport (208 rooms), and climbed to 16 properties and 2,086 rooms in 2026. That is 1,000 more rooms than 2022, or 1.9x.
For comparison, applying the same criteria to a 2km radius around Torichosuji tram stop in central Kumamoto gives 72 listed properties with 8,638 rooms, of which 54 properties with 7,329 rooms are active. On an annual basis, stock rose from 51 properties and 6,982 rooms in 2022 to 60 properties and 7,492 rooms in 2026, an increase of 510 rooms or just 7.3%. The center had already finished its expansion, growing 34.6% from 2017 to 2022, so even the 232- and 176-room openings of 2026 are a modest addition to existing stock. The same “500 rooms of new supply” carries an entirely different weight in the large central market than in Airport/Ozu, whose base was just over 1,000 rooms.
| Metric | Airport/Ozu 5km | Central Kumamoto 2km |
|---|---|---|
| Listed stock | 21 properties, 2,248 rooms | 72 properties, 8,638 rooms |
| Of which active | 17 properties, 2,069 rooms | 54 properties, 7,329 rooms |
| Business hotel share of rooms (listed) | 84.9% | 76.3% |
| Share of rooms opened in the 2020s (listed) | 45.4% | 24.9% |
| Annual trend, 2022 → 2026 | 1,086 → 2,086 rooms (+92.1%) | 6,982 → 7,492 rooms (+7.3%) |
Estimated Settled ADR — Chuo Ward +19.5% in October, Seven Existing Airport/Ozu Hotels Narrowing the Gap
How did rates respond to this much supply? Comparing estimated settled ADR by municipality for October 2026 with a year earlier, the center clearly moved up: Kumamoto’s Chuo Ward reached about ¥10,300, up 19.5% (N=61), and Nishi Ward about ¥9,200, up 11.9% (N=10). Aso City at about ¥18,700 (−0.5%, N=26) and Minamiaso Village at about ¥25,800 (+0.9%, N=18) were roughly flat, holding resort and ryokan rate levels. Ozu Town was about ¥9,100, up 1.2% (N=14).
| Municipality | Oct 2026 | Oct 2025 | YoY | Properties |
|---|---|---|---|---|
| Kumamoto City, Chuo Ward | ¥10,275 | ¥8,598 | +19.5% | 61 |
| Kumamoto City, Nishi Ward | ¥9,246 | ¥8,266 | +11.9% | 10 |
| Ozu Town | ¥9,058 | ¥8,952 | +1.2% | 14 |
| Aso City | ¥18,682 | ¥18,772 | −0.5% | 26 |
| Minamiaso Village | ¥25,808 | ¥25,570 | +0.9% | 18 |
| Minamioguni Town | ¥29,062 | ¥29,446 | −1.3% | 47 |
Across the prefecture’s business hotels, estimated settled ADR was nearly flat in June 2026 at about ¥6,600 (−0.3% YoY, N=118), then stepped up to about ¥8,200 in September (+20.0%, N=122) and about ¥8,200 in October (+19.3%, N=126). September and October follow the July 28 earthquake and may include lodging demand unlike normal conditions, so they should be read separately from the underlying semiconductor and tourism trends (for details, see estimated settled ADR at Kumamoto business hotels).
Ozu Town’s +1.2%, on the other hand, is a median that already includes the newly opened properties, so it does not directly show how established hotels fared. We therefore fixed the sample to the seven business and city hotels with 100 or more rooms in the Airport/Ozu 5km radius that opened in 2024 or earlier and tracked their median estimated settled ADR. It ran −4.1% to −13.4% YoY from January to July 2026, with June at about ¥7,500 (−13.4%), staying below the prior year. As room stock grew by more than 900 rooms in two years, this suggests hotels in the radius shifted their pricing toward securing occupancy over rate.
That gap has narrowed into autumn, however. September was about ¥8,700 (−11.4%) and October about ¥8,800 (−7.8%), bringing the shortfall to roughly 60% of June’s. Half a year after more than 500 new rooms reached the market, rates in the radius appear to have entered a phase of searching for a new equilibrium. Estimated prefecture-wide occupancy for October 2026 (OTA-listed inventory basis) was high at 89.5% for business hotels (59 properties, 7,143 rooms, based on major booking-site listings) and 93.1% for city hotels (13 properties, 1,525 rooms), so rooms themselves are being absorbed.
| Category | Properties | Rooms | Occupancy (OTA-Listed Inventory, Estimated) |
|---|---|---|---|
| All properties | 352 | 13,689 | 88.1% |
| Business hotels | 59 | 7,143 | 89.5% |
| City hotels | 13 | 1,525 | 93.1% |
| Resort hotels | 20 | 1,145 | 85.1% |
| Ryokan | 151 | 2,812 | 88.7% |
Site Assessment — Commercial Land Gains Slow in Kikuyo and Ozu, Widen in Chuo Ward
Alongside hotel rates, land prices are also moving differently in the two areas. According to the 2026 Official Land Price Publication for Kumamoto Prefecture (as of January 1, 2026), average commercial land price changes were +12.0% in Kikuyo Town (prior year +30.9%) and +8.9% in Ozu Town (prior year +24.0%). Both remain among the highest in the prefecture, but their gains shrank sharply. The prefecture explains that prices “rose sharply in recent years due to TSMC’s arrival, but the pace of increase has narrowed.” By contrast, commercial land in Kumamoto’s Chuo Ward widened its gain to +6.2% (prior year +5.3%), and the prefecture’s highest-priced point, Shimotori 1-chome, was ¥2.48 million per sqm (+1.6%).
| Municipality | All Uses 2025 | All Uses 2026 | Commercial 2025 | Commercial 2026 | Industrial 2026 |
|---|---|---|---|---|---|
| Ozu Town | +20.0% | +11.5% | +24.0% | +8.9% | +26.0% |
| Kikuyo Town | +14.5% | +6.9% | +30.9% | +12.0% | — |
| Koshi City | +9.0% | +5.7% | +4.2% | +1.9% | — |
| Kumamoto City, Chuo Ward | +5.2% | +6.0% | +5.3% | +6.2% | +6.7% |
| Kumamoto City, Higashi Ward | +4.4% | +4.3% | +6.0% | +5.1% | +13.3% |
| Kumamoto Prefecture overall | +3.6% | +3.2% | +3.5% | +3.4% | +9.1% |
Most notable is that Ozu Town’s industrial land rose 26.0%, continuing to rank first nationwide among municipal averages for industrial land. While commercial and residential gains are settling, demand for factory and logistics sites remains strong. For hotel site acquisition, the pause in commercial land price growth makes land costs for future openings easier to forecast. Standard commercial land points are ¥104,000 per sqm in Ozu and ¥140,000 in Kikuyo, a 5x to 7x gap from central Kumamoto’s entertainment district (¥695,000 in Chuo-gai).
Demand-side factors have also been updated. On October 16, 2026, Japan’s Ministry of Economy, Trade and Industry approved a change to the production plan for JASM’s Kumamoto Fab 2, which is certified under its specified semiconductor production facility plan. According to press reports, the revised plan calls for starting production of 3-nanometer logic chips by December 2028, so lodging demand from construction and equipment work tied to the fab’s ramp-up is expected to continue through 2028. On the transport side, the prefecture aims to open an airport access railway (about 6.8km) linking Higo-Ozu Station and Aso Kumamoto Airport by the end of fiscal 2034, which should raise Ozu’s standing as a transport node over the medium to long term (for long-term ADR trends in the surrounding area, see ADR trends in Kikuyo, Koshi and Ozu).
Outlook for 2027 and Beyond — Plans Lead in the Center, Absorption Is the Focus in Airport/Ozu
To summarize, Kumamoto’s 2026 supply took two contrasting forms: a modest addition of around 7% to existing stock in the center, and a rapid expansion in Airport/Ozu, where stock grew about 1.8x in two years. Judging by published plans for 2027 and beyond, the center is ahead. APA Group plans to open in front of Kumamoto Station in August 2027 and in Shimotori in July 2029, and has stated a policy of raising its room count in the prefecture from the current 530 rooms across three buildings in operation or under construction to more than 2,000. This assertive expansion, which anticipates growth in the semiconductor cluster and in tourism demand, reflects the company’s view of the Kumamoto market’s growth potential.
What to Watch in Development and Lending Decisions — Net Supply, Area, and Existing Hotels’ Rates
From here, we frame the findings around development and lending decisions. There are three points to watch.
1. Measure net supply
At least 224 of the 1,666 rooms opened are renovations or rebrands. Growth against existing stock should be calculated on new builds only.
2. Separate by area
The same 500 rooms means +7.3% in the central 2km radius but +92.1% from 2022 in the Airport/Ozu 5km radius. Use each area’s own base rather than a prefecture average.
3. Read absorption through existing hotels’ rates
The seven existing Airport/Ozu hotels moved from −13.4% YoY (June) to −7.8% (October). Whether this gap keeps closing is the indicator of room for the next opening.
For operators considering a new Airport/Ozu property, one benchmark is when the seven existing hotels’ rates return to prior-year levels. With production at Fab 2 now slated to begin by December 2028, long-stay demand toward the peak of construction and equipment installation has become easier to anticipate. Products whose functions do not overlap with existing business hotels, such as mid- to long-stay rooms with kitchens and washing machines or properties with large baths, have room to capture a rate premium. For regional financial institutions, checking two points for each project is a shortcut to testing a business plan’s assumptions: what percentage increase it represents against active stock within a 5km radius, and which way existing hotels’ rates in that radius are moving year on year.
In the center, the rise of Chuo Ward’s estimated settled ADR to around the ¥10,000 level in September and October needs to be tested against figures from the new year onward, to determine whether it reflects temporary post-earthquake demand or a change in trend supported by inbound and business travel. 2027, when the 408 rooms opened in 2026 (232 and 176) operate for a full year, will provide the answer. The three figures in this article (net supply of at most 1,442 rooms, 1.9x growth in four years in Airport/Ozu 5km, and +7.3% in central 2km) should serve as baselines for neither overstating nor understating Kumamoto’s supply.
Note: This article is a market analysis based on public information. Individual investment decisions require a detailed feasibility study.
Related Articles
References and Sources
■ Data Sources
Opening counts and room counts are from MetroEngines Research & Consulting on an OTA listing basis (N=73 properties, as of November 14, 2026). Room stock by area, estimated settled ADR by municipality (median of covered properties, tax-excluded equivalent), and estimated occupancy by category (OTA-listed inventory basis, October 2026) are also the company’s tabulations. Opening dates and room counts of the six properties discussed individually are from operator announcements and press reports, and land prices are from Kumamoto Prefecture’s “2026 Official Land Price Publication” (price date January 1, 2026).
■ Calculation Assumptions
Opening year was determined from the establishment date of properties listed on major booking sites. Areas were classified by property coordinates: Central Kumamoto is a 3km radius from Torichosuji tram stop (2km for the room-stock comparison), and Airport/Ozu is a 5km radius from Tabino Hotel Aso Kumamoto Airport. Room stock covers properties with 10 or more rooms (excluding leisure hotels). Net supply of 1,442 rooms is an upper limit, calculated as the 1,666 rooms opened minus the 224 rooms at two renovated or rebranded properties. All ADR changes are year-on-year comparisons for the same month.
■ Limitations
Booking-site listings begin several months before opening, so properties opening toward the end of 2026 may increase future tallies. Estimated settled ADR and estimated occupancy are estimates based on public OTA information and differ from each property’s actual settled rates and occupancy. Land prices are average changes at standard points and do not indicate transaction prices for individual hotel sites.
■ Market Data
| • MetroEngines Research & Consulting — new openings (OTA listing basis, N=73 properties), radius room stock, estimated settled ADR, estimated occupancy (OTA-listed inventory basis) |
■ Government Statistics and Public Data
■ News and Press Releases