

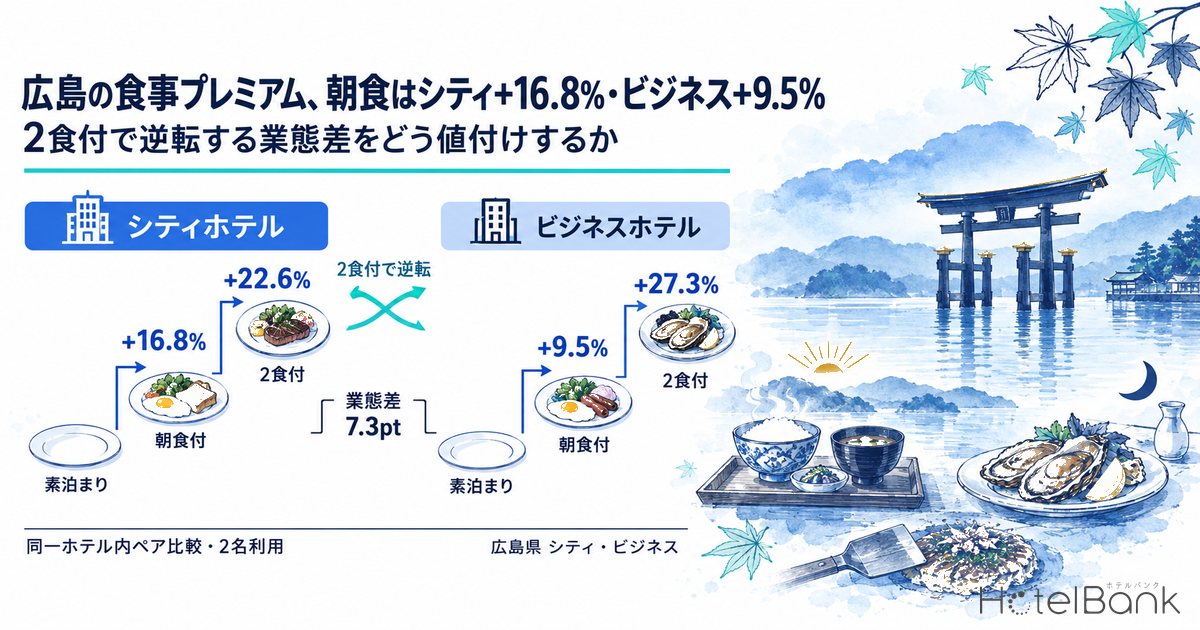
We compared the meal plans that Hiroshima Prefecture hotels are selling for October 2026, restricting the sample to properties that sell both a room-only plan and a breakfast-included plan in the same hotel. On that basis, the breakfast premium is +16.8% at city hotels (N=22) and +9.5% at business hotels (N=66), a 7.3-point gap between the two hotel types. Look at the step from breakfast-included to half-board (breakfast and dinner), however, and the order flips: city hotels add +22.6% (N=13) while business hotels add +27.3% (N=21). This pattern, where the gap that opens at breakfast reverses at dinner, did not exist in May. This article layers the monthly trend, a comparison with eight neighboring prefectures, a drill-down to wards and cities such as Naka Ward in Hiroshima City, and the difference versus single occupancy, and reads them for Hiroshima operators who need to decide how to structure their meal-plan price steps.
Scope: city hotels and business hotels in Hiroshima Prefecture (ryokan excluded). Meal-plan premiums are paired comparisons that count only properties selling both plans being compared within the same hotel (double occupancy, stays in October 2026); N= is the number of properties where a pair was formed. The reference price metric is Estimated Settled ADR (the transacted price level estimated from OTA and other sales data, tax-excluded equivalent). All definitions are at the end of the article. Data as of October 15, 2026.
- — The breakfast premium is +16.8% at city hotels (N=22) and +9.5% at business hotels (N=66). In the same-hotel paired comparison (double occupancy, October 2026 stays) the gap between hotel types is 7.3 points, wider than 3.1 points in May.
- — The half-board step over breakfast-included is +22.6% for city hotels (N=13) and +27.3% for business hotels (N=21), reversing the order. This is not because business hotels raised theirs, but because the city-hotel dinner step shrank from +27.9% in May.
- — Among nine nearby prefectures, Hiroshima ranks 4th for the city-hotel breakfast premium, and its city-hotel half-board step is the thinnest of six prefectures. Hyogo (+43.1%) and Okayama (+32.9%) are 1.5–1.9 times Hiroshima.
- — By ward and city, Naka Ward city hotels are thick at +25.4% (N=6), while Higashi Ward (+1.0%) and Higashihiroshima (−0.5%) are close to zero. Under single occupancy, the city-hotel half-board step shrinks to +4.1% (N=11).
- — If the meal surcharge (in yen) is left unchanged while room prices rise +18.9%, the city-hotel breakfast premium erodes from 16.8% to 14.1%. Meal surcharges should be reviewed on the same cycle as room-rate revisions.
Same-Hotel Paired Comparison — a 7.3-Point Gap at Breakfast, Reversed at Half-Board
First, the method. The “premium” in this article is not a simple average of all breakfast-included plans versus all room-only plans across the prefecture. Only where the same hotel sells both a room-only and a breakfast-included plan in the same month do we calculate the difference within that property, and we then average across properties where a pair was formed. If high-priced hotels that only sell breakfast-included plans were mixed with low-priced hotels that only sell room-only, differences in price level between hotel types would masquerade as “the value of breakfast.” Restricting the comparison to the same property isolates the plan step itself. Ryokan are excluded because meals are typically included and a pair with room-only rarely forms.
Table 1 shows October 2026 stays by hotel type using this method. The gap between breakfast-included and room-only is +16.8% at city hotels (N=22), +9.5% at business hotels (N=66), and +12.2% overall including both types (N=90); the higher-priced city hotels carry the larger breakfast premium. The step from breakfast-included to half-board, by contrast, is +22.6% at city hotels (N=13) and +27.3% at business hotels (N=21) — business hotels are 4.7 points higher, so the order seen at breakfast reverses here. Measured all the way from room-only to half-board, the premium is +43.7% for city hotels and +39.9% for business hotels (N=13 and 21 respectively); city hotels still lead in total, but the gap narrows to 3.8 points.
| Hotel type | Breakfast vs room-only | Half-board vs breakfast | Half-board vs room-only |
|---|---|---|---|
| City hotels | +16.8% (N=22) | +22.6% (N=13) | +43.7% (N=13) |
| Business hotels | +9.5% (N=66) | +27.3% (N=21) | +39.9% (N=21) |
| All (city + business, etc.) | +12.2% (N=90) | +23.6% (N=36) | +40.7% (N=36) |
Source: Compiled by HotelBank Editorial Team from MetroEngines Research. N= is the number of property pairs selling both plans. “All” includes a small number of resort-type properties in addition to the two hotel types.
Figure 1: Hiroshima Prefecture — Meal-Plan Steps by Hotel Type (October 2026, Double Occupancy). Source: Compiled by HotelBank Editorial Team from MetroEngines Research
How should this reversal be read? Breakfast premiums are larger at higher-priced hotel types likely because the breakfast venue and menu can be differentiated in line with the room rate, allowing a wider gap over room-only. Dinner is different: at city hotels it competes strongly with à la carte use of in-house restaurants and with dining out, making it harder to price the half-board surcharge as aggressively as breakfast. Fewer business hotels offer half-board at all (N=21, one-third of the breakfast pairs), but at those that do, a lower room-only base price means the same meal cost looks larger as a percentage — an arithmetic factor also at work. It is worth keeping in mind that the percentage “reversal” has differences in base price by hotel type baked into it.
Monthly Trend, May–October — City Hotels Added at Breakfast, Shrank at Half-Board
Next, we check by month whether this pattern is seasonal or structural. Figure 2 overlays breakfast and half-board premiums by hotel type for each stay month from May to October. The city-hotel breakfast premium rose 3.4 points from +13.4% in May to +16.8% in October, while business hotels slipped slightly from +10.3% to +9.5%, widening the gap between types from 3.1 points in May to 7.3 points in October — the widest of the period. Pair counts are stable (N=22 for city hotels every month, N=65–69 for business hotels), so this reads as a change in settings at the same group of properties rather than a change in the sample.
Figure 2: Hiroshima Prefecture — Monthly Trend in Premiums (Stays May–October 2026, Double Occupancy). City breakfast N=22, business breakfast N=65–69, city half-board N=12–14, business half-board N=21–23. Source: Compiled by HotelBank Editorial Team from MetroEngines Research
The half-board step over breakfast moved the other way. In May, city hotels (+27.9%, N=12) and business hotels (+27.7%, N=22) were almost level, but city hotels rose into the +30% range in June–July, contracted from August, and fell to +22.6% (N=13) in October. Business hotels stayed in a narrow +26.9–29.7% band from May through October, and October’s +27.3% (N=21) is roughly the May level. In other words, the “half-board reversal” visible in October is not the result of business hotels adding to their step, but of the city-hotel dinner step thinning toward autumn.
| Stay month | City breakfast / room-only | Business breakfast / room-only | City half-board / breakfast | Business half-board / breakfast |
|---|---|---|---|---|
| May 2026 | +13.4% (N=22) | +10.3% (N=66) | +27.9% (N=12) | +27.7% (N=22) |
| June | +16.9% (N=22) | +12.8% (N=69) | +30.4% (N=14) | +28.9% (N=23) |
| July | +15.4% (N=22) | +11.6% (N=68) | +30.3% (N=14) | +29.7% (N=22) |
| August | +14.4% (N=22) | +10.5% (N=68) | +26.7% (N=14) | +27.7% (N=23) |
| September | +15.7% (N=22) | +10.6% (N=65) | +26.5% (N=14) | +26.9% (N=21) |
| October | +16.8% (N=22) | +9.5% (N=66) | +22.6% (N=13) | +27.3% (N=21) |
Source: Compiled by HotelBank Editorial Team from MetroEngines Research. October values reflect current sales and may change by month-end.
Behind this is likely the movement in room rates heading into autumn in Hiroshima. For reference, comparing closed months of Estimated Settled ADR (tax-excluded equivalent), Hiroshima Prefecture city hotels posted ¥12,900 in September 2026 (N=31), +18.9% from ¥10,800 a year earlier (N=29), and business hotels posted ¥8,600 (N=187), +12.1% from ¥7,600 (N=186) — both double-digit gains, now settled. When the room base price is rising, holding the meal surcharge flat automatically thins the percentage. The natural reading is that the city-hotel half-board step shrank in autumn not because dinner surcharges were cut, but because dinner surcharges did not keep pace with room-rate increases. How Hiroshima Prefecture’s Estimated Settled ADR turned positive year over year, and what the 2026 new supply consists of, is covered in our analysis of Hiroshima Prefecture’s 1,003 rooms opening in 2026.
Comparison with Eight Neighboring Prefectures — Hiroshima Is Mid-Pack at Breakfast, Thinnest at Half-Board
So where do Hiroshima’s steps sit relative to its neighbors? Figure 3 and Table 3 apply the same method to nine prefectures — Chugoku, Shikoku, plus Hyogo and Fukuoka — for October 2026 stays. The city-hotel breakfast premium is led by Hyogo (+21.0%, N=37), followed by Tottori (+19.1%, N=7) and Shimane (+18.6%, N=5); Hiroshima (+16.8%, N=22) ranks 4th of nine. At the bottom are Yamaguchi (+11.0%, N=5) and Okayama (+10.3%, N=14) — a 6.5-point gap with Okayama, Hiroshima’s Setouchi neighbor. For business-hotel breakfast, Hyogo and Tottori (+13.9%, N=69 and 21) and Okayama (+11.3%, N=40) lead, and Hiroshima (+9.5%, N=66) is 5th, again mid-pack. Widening the lens to all 47 prefectures shows prefecture rankings reshuffling as soon as one crosses hotel types.
Figure 3: Breakfast vs Room-Only Premium, Nine-Prefecture Comparison (October 2026, Double Occupancy). See Table 3 for N=. Source: Compiled by HotelBank Editorial Team from MetroEngines Research
| Prefecture | City breakfast / room-only | Business breakfast / room-only | City half-board / breakfast | Business half-board / breakfast |
|---|---|---|---|---|
| Hiroshima | +16.8% (N=22) | +9.5% (N=66) | +22.6% (N=13) | +27.3% (N=21) |
| Okayama | +10.3% (N=14) | +11.3% (N=40) | +32.9% (N=10) | +26.8% (N=11) |
| Yamaguchi | +11.0% (N=5) | +6.1% (N=44) | — | +32.3% (N=23) |
| Shimane | +18.6% (N=5) | +9.8% (N=26) | — | +36.4% (N=7) |
| Tottori | +19.1% (N=7) | +13.9% (N=21) | — | +26.3% (N=13) |
| Ehime | +14.4% (N=18) | +7.6% (N=38) | +37.9% (N=8) | +30.2% (N=11) |
| Kagawa | +15.4% (N=9) | +7.2% (N=27) | +66.7% (N=6) | +26.6% (N=10) |
| Hyogo | +21.0% (N=37) | +13.9% (N=69) | +43.1% (N=25) | +30.9% (N=19) |
| Fukuoka | +15.2% (N=30) | +7.7% (N=144) | +23.6% (N=18) | +29.2% (N=52) |
Source: Compiled by HotelBank Editorial Team from MetroEngines Research. “—” indicates fewer than 5 pairs; not shown.
Turn to the half-board step over breakfast and Hiroshima’s position becomes even clearer. Among the six prefectures with at least five city-hotel pairs, Hiroshima (+22.6%, N=13) is the thinnest, sitting in the low-20% range alongside Fukuoka (+23.6%, N=18), while Hyogo (+43.1%, N=25) and Okayama (+32.9%, N=10) set steps 1.5–1.9 times Hiroshima’s. For business hotels, Hiroshima (+27.3%, N=21) ranks 6th of nine, pricing dinner more conservatively than Shimane (+36.4%, N=7) or Yamaguchi (+32.3%, N=23). Running the same comparison for September stays puts Hiroshima 6th of nine for city-hotel breakfast and 5th of six for city-hotel half-board, so the broad ranking holds. Hiroshima can be summarized as a prefecture where “the breakfast step is in line with its neighbors, but the dinner step is thinner.” How neighboring Yamaguchi makes up for a thin breakfast step on the dinner side is examined in detail in our meal-premium analysis of Yamaguchi business hotels.
One likely cause of this thinness is the concentration of restaurants in central Hiroshima City. In areas where many guests head out for okonomiyaki or Setouchi seafood, a high surcharge on in-house dinner is unlikely to be chosen, and hotels find it hard to make half-board their main product. The fact that city-hotel half-board pairs number only N=13, about 60% of the breakfast pairs, itself shows how few properties sell dinner-included plans.
Ward and City Drill-Down — Naka Ward Exceeds the Prefecture Average; Higashihiroshima and Higashi Ward Have Almost No Breakfast Step
Prefecture averages smooth over differences between areas. Limiting the view to wards and cities with at least five pairs, the breakfast premium in Naka Ward, Hiroshima City is +25.4% for city hotels (N=6), +14.1% for business hotels (N=17), and +18.2% overall (N=23) — all above the prefectural averages by hotel type (city +16.8%, business +9.5%). Minami Ward, which includes the Hiroshima Station area, is on par with Naka Ward at +18.5% overall (N=7), so the two central wards are able to take a thick breakfast step.
| Ward / city | Hotel type | Breakfast vs room-only | Pairs |
|---|---|---|---|
| Naka Ward, Hiroshima City | City hotels | +25.4% | N=6 |
| Naka Ward, Hiroshima City | Business hotels | +14.1% | N=17 |
| Naka Ward, Hiroshima City | All | +18.2% | N=23 |
| Minami Ward, Hiroshima City | All | +18.5% | N=7 |
| Fukuyama City | Business hotels | +15.6% | N=15 |
| Onomichi City | Business hotels | +11.7% | N=6 |
| Kure City | All | +9.6% | N=6 |
| Higashi Ward, Hiroshima City | Business hotels | +1.0% | N=6 |
| Higashihiroshima City | Business hotels | −0.5% | N=7 |
Source: Compiled by HotelBank Editorial Team from MetroEngines Research. “All” for a ward/city combines every hotel type included in the tally for that area.
The eastern part of the prefecture and the suburbs offer a contrast. Business hotels in Fukuyama City are at +15.6% (N=15), 6.1 points above the prefectural business-hotel average, suggesting that breakfast-included plans are well established in this business-travel city with a Shinkansen station. Meanwhile, business hotels in Higashi Ward, Hiroshima City (+1.0%, N=6) and in Higashihiroshima City (−0.5%, N=7) sell breakfast-included and room-only at almost the same price. Selling breakfast at what is effectively near-zero cost to erase the gap with room-only uses breakfast as a demand-generation tool — a different philosophy from Naka Ward and Fukuyama, which earn revenue from the surcharge. Onomichi City is modest at +11.7% for breakfast (N=6), but its half-board step over breakfast is +40.9% (N=6) — the only city in the prefecture with at least five such pairs — with tourism-driven dinner demand showing up in the surcharge.
Single vs Double Occupancy — Breakfast Is Unaffected by Party Size; Dinner Doubles at Two Guests
Because meal surcharges are normally set per person, premiums differ between single and double occupancy. Table 5 re-tallies the same October stays for single occupancy. The city-hotel breakfast premium is almost identical at +16.6% for one guest (N=22) and +16.8% for two (N=22), while business hotels rise 3.1 points from +6.4% (N=70) to +9.5% (N=66). Since the breakfast surcharge is per person, it doubles when the party doubles, but the room price in the denominator also rises with party size. How those two are set relative to each other shows up as the difference in percentages: city hotels keep the breakfast step at nearly the same rate regardless of party size, whereas business hotels have a thicker rate for two guests.
| Hotel type / comparison | Single occupancy | Double occupancy |
|---|---|---|
| City: breakfast vs room-only | +16.6% (N=22) | +16.8% (N=22) |
| Business: breakfast vs room-only | +6.4% (N=70) | +9.5% (N=66) |
| City: half-board vs breakfast | +4.1% (N=11) | +22.6% (N=13) |
| Business: half-board vs breakfast | +18.3% (N=21) | +27.3% (N=21) |
| City: half-board vs room-only | +22.1% (N=11) | +43.7% (N=13) |
| Business: half-board vs room-only | +25.9% (N=21) | +39.9% (N=21) |
Source: Compiled by HotelBank Editorial Team from MetroEngines Research. The properties forming pairs differ partly between single and double occupancy.
On the dinner side, party size matters far more. The city-hotel half-board step over breakfast is +4.1% for one guest (N=11) versus +22.6% for two (N=13) — more than five times larger — and for business hotels it widens 9.0 points from +18.3% to +27.3% (both N=21). For single-occupancy city hotels, half-board adds almost nothing, suggesting that single dinner-included plans function closer to a promotional price for steering solo guests into the in-house restaurant. When designing steps, note that applying the double-occupancy rate directly to single plans pushes the single guest’s dinner toward being effectively free.
For Revenue Managers at Hiroshima City and Business Hotels — Implications and Action Plan
Operational Insights
First, convert your property’s breakfast-included vs room-only difference into a percentage and test it against both the market value for your hotel type and the value for your ward or city. The prefectural city +16.8% and business +9.5% are the baselines; Naka Ward’s city +25.4% and business +14.1%, and Fukuyama’s business +15.6%, are the local yardsticks. If your rate is well below these, your breakfast surcharge may not have kept up with room-rate increases; if it is well above, it is worth checking whether the take-up rate for breakfast plans has fallen.
Second, the percentage moves with the room price in the denominator. Hiroshima Prefecture’s Estimated Settled ADR for September (closed) is up year over year by +18.9% for city hotels and +12.1% for business hotels; holding the meal surcharge flat in yen automatically thins the percentage. The shrinkage in the city-hotel half-board step from +27.9% in May to +22.6% in October is a typical example. If you manage surcharges in yen, consider reviewing them on the same cycle as room-rate revisions.
Third, the dinner step is where Hiroshima is thinnest among its neighbors. Importing Hyogo’s +43.1% or Okayama’s +32.9% wholesale is not realistic, but as Onomichi’s +40.9% shows, there are dates and guest segments with strong tourism motivation where a thicker surcharge is achievable. There is room for designs that avoid a uniform step — for example, differentiating the half-board surcharge between weekday business travelers and weekend leisure guests, or making in-house dinner competitive with dining out by clearly featuring distinctly Hiroshima ingredients.
Fourth, single-occupancy plans need a separate yardstick. The city-hotel half-board step is only +4.1% for one guest; copying the double-occupancy rate to single plans pushes dinner toward being nearly free. Check single-occupancy meal surcharges individually against the per-person cost and the resulting percentage.
It is worth confirming in numbers how these steps should be handled during room-rate revisions. Since the premium is “meal surcharge (yen) ÷ base-plan price,” if only the base-plan price rises while the meal surcharge is held flat in yen, the rate mechanically thins to “current rate ÷ (1 + rate increase).” Table 6 starts from the October 2026 rates by hotel type and shows the resulting rates for base-plan price increases of 0–20%. Applying the year-over-year change in September’s closed Estimated Settled ADR (city +18.9%), the city breakfast premium drops from +16.8% to about +14.1%, and the half-board step from +22.6% to about +19.0%. If the base price rises 20%, the business-hotel half-board step becomes +22.8%, thinning to almost the current city-hotel level (+22.6%). To maintain the rate, meal surcharges must rise at the same rate as rooms.
| Hotel type / comparison (starting pairs) | Base price +0% | Base price +5% | Base price +10% | Base price +15% | Base price +20% |
|---|---|---|---|---|---|
| City breakfast / room-only (N=22) | +16.8% | +16.0% | +15.3% | +14.6% | +14.0% |
| Business breakfast / room-only (N=66) | +9.5% | +9.0% | +8.6% | +8.3% | +7.9% |
| City half-board / breakfast (N=13) | +22.6% | +21.5% | +20.5% | +19.7% | +18.8% |
| Business half-board / breakfast (N=21) | +27.3% | +26.0% | +24.8% | +23.7% | +22.8% |
Source: Compiled by HotelBank Editorial Team from MetroEngines Research. Formula: rate after holding flat = current rate ÷ (1 + base-plan price increase). A mechanical calculation assuming the meal surcharge (yen) is constant and the property mix stays as in the October 2026 pairs; it is not a forecast of future values.
| Horizon | Action | Decision trigger (figures in this article) | Aim |
|---|---|---|---|
| Today–this week | Convert your breakfast, room-only and half-board differences into percentages for both double and single occupancy | Your breakfast premium is 5+ points away from city +16.8% / business +9.5% (in Naka Ward, city +25.4% / business +14.1%) | Understand which direction you deviate from the market |
| Today–this week | Review meal surcharges in yen alongside the room-rate revision for November stays | September closed Estimated Settled ADR is up YoY (city +18.9%, business +12.1%), while meal surcharges have been held since spring | Prevent erosion of the premium |
| Within 2 weeks | Line up breakfast take-up rates and surcharges by month and check whether take-up fell when the rate rose | The city breakfast step rose market-wide from +13.4% in May to +16.8% in October | Judge headroom for increases with numbers |
| Within 2 weeks | Split the half-board surcharge by weekday/weekend or by business/leisure segment | Hiroshima city hotels’ half-board step of +22.6% is the thinnest of six neighboring prefectures, while Onomichi sustains +40.9% | Thicken the step on dates with strong dinner demand |
| Toward next month | Audit single-occupancy meal surcharges separately against per-person cost and percentage | The city half-board step differs more than fivefold by party size: +4.1% single vs +22.6% double | Avoid single-guest dinner becoming effectively free |
| Toward next month | If breakfast is included at near-zero cost, verify its purpose (demand generation or reviews) and its effect with numbers | Some areas include breakfast at the room-only price, e.g. Higashi Ward +1.0% and Higashihiroshima −0.5% | Decide whether breakfast is a revenue source or a demand-generation tool |
Source: Compiled by HotelBank Editorial Team from MetroEngines Research
Summary — Three Yardsticks for Hiroshima’s Meal-Plan Steps
To sum up, Hiroshima’s meal-plan steps can be measured with three yardsticks. The first is the breakfast gap between hotel types: city +16.8% (N=22) versus business +9.5% (N=66), a 7.3-point gap that widened from 3.1 points in May. The second is the thinness of the dinner step: the city-hotel half-board step over breakfast of +22.6% (N=13) is the smallest among neighbors, a different design philosophy from the 1.5–1.9 times larger steps in Hyogo and Okayama. The third is adjustment for area and party size: Naka Ward’s breakfast step is thicker than the prefectural average, Higashihiroshima and Higashi Ward are near zero, and under single occupancy the dinner step shrinks sharply. Applying your property’s rates to these three yardsticks shows where your meal-plan pricing sits in the market. For the same method applied to other prefectures, see our articles on Kyoto and Okinawa.
Frequently Asked Questions
Q. How is the premium calculated?
A. Only where the same hotel sells both meal plans being compared (e.g., room-only and breakfast-included) for the same stay month do we convert the in-property difference into a percentage, then average across properties where a pair was formed. Because this is not a simple average of all hotels, differences in price level between hotel types are not mixed in.
Q. Why are ryokan not included?
A. Ryokan typically sell half-board as standard, so same-property pairs with room-only or breakfast-included plans rarely form. This article covers hotel types, mainly city hotels and business hotels.
Q. Are the October figures final?
A. October stays are based on plans currently on sale and may change by month-end. May–September are values for stay months that have passed.
Q. Is Hiroshima’s breakfast premium high compared with neighboring prefectures?
A. For October 2026 stays (double occupancy), the city-hotel +16.8% ranks 4th of nine nearby prefectures and the business-hotel +9.5% ranks 5th — both mid-pack. The half-board step over breakfast, however, is +22.6% for city hotels, the thinnest of the six prefectures with at least five pairs.
Q. How should meal surcharges be handled when room rates go up?
A. If meal surcharges are held flat in yen, the premium thins to “current rate ÷ (1 + room-rate increase).” The city breakfast premium of +16.8% becomes about +14.1% if the base price rises +18.9%, so to keep the rate, meal surcharges need to be revised at the same rate as rooms.
About the Data
– Meal-plan premium: a paired comparison of prices by meal plan sold on OTAs and other channels, limited to properties selling both plans within the same hotel. N= (pairs) is the number of properties where both plans were available; this article cites only values with N=5 or more. Ryokan are excluded. Single and double occupancy are tallied separately, and the properties forming pairs differ partly between the two.
– Estimated Settled ADR: the transacted price level (tax-excluded equivalent) estimated from OTA and other sales data (lowest-plan level × hotel-type coefficient, ensemble across multiple channels). Past months are closed values; current and future months are estimates based on current sales. Median error versus published operating results is 6.6%. This article refers only to year-over-year comparisons between closed months (September 2025 and September 2026).
– Breakdown of N= (October 2026, double occupancy, breakfast vs room-only): Hiroshima Prefecture city hotels 22 properties, business hotels 66, all 90. N= for neighboring prefectures, wards/cities, single occupancy and other meal pairs is shown in each table.
– Data as of October 15, 2026. Because sales and inventory change daily, the figures in this article are a snapshot at the time of retrieval.
References and Sources
■ Data Sources
MetroEngines Research, “Paired Comparison of Prices by Meal Plan” (Hiroshima Prefecture and eight neighboring prefectures, stays May–October 2026, single/double occupancy, mainly city and business hotels, ryokan excluded); MetroEngines Research, “Estimated Settled ADR” (Hiroshima Prefecture city and business hotels, closed values for September 2025 and September 2026). All retrieved October 15, 2026 and compiled by HotelBank Editorial Team.
■ Calculation Assumptions
Premium = ratio of average prices at properties selling both plans being compared within the same hotel (e.g., breakfast-included ÷ room-only − 1). N= is the number of properties forming a pair; only values with N=5 or more are cited. The sensitivity in Table 6 uses rate after holding flat = current rate ÷ (1 + base-plan price increase), a mechanical calculation fixing the meal surcharge (yen) and pair composition as of October 2026. Estimated Settled ADR is tax-excluded equivalent; year-over-year comparisons are between closed months.
■ Limitations and Caveats
October stays are based on prices on sale and may change by month-end. The properties forming pairs differ partly by month, party size and meal pair; ward/city figures have small samples (N=5–23) and can move several points with individual property settings. This is a comparison of listed prices and does not reflect plan sales volume (take-up) or meal cost. The background to differences in premiums (restaurant concentration, guest mix, etc.) is the editorial team’s interpretation.
■ Market Data
Source: Compiled by HotelBank Editorial Team from MetroEngines Research (Figures 1–3 and Tables 1–7 in the text).
Related Articles
- Breakfast Premium 4.4x Gap: Kyoto 22.0% vs Shizuoka 5.0%, 10 Markets
- Yamaguchi Business Hotels: Breakfast Premium +3.4%, Dinner +30.9%
- Kagawa Meal Premiums: Breakfast +9.1%, Half-Board +29.1% (Sep 2026)
- Kyoto Breakfast Premium: Business +18.5%, City +18.4%; Autumn 12–13%
- Okinawa Meal Premiums: Business Breakfast +12.9%, Resort +7.4%
- Hiroshima 2026: 1,003 New Rooms, City Settled ADR Turns -4.1% in July
- Hiroshima Business Hotels: Thu 93.6% vs Sun 79.6%, the Sun–Mon Trough