

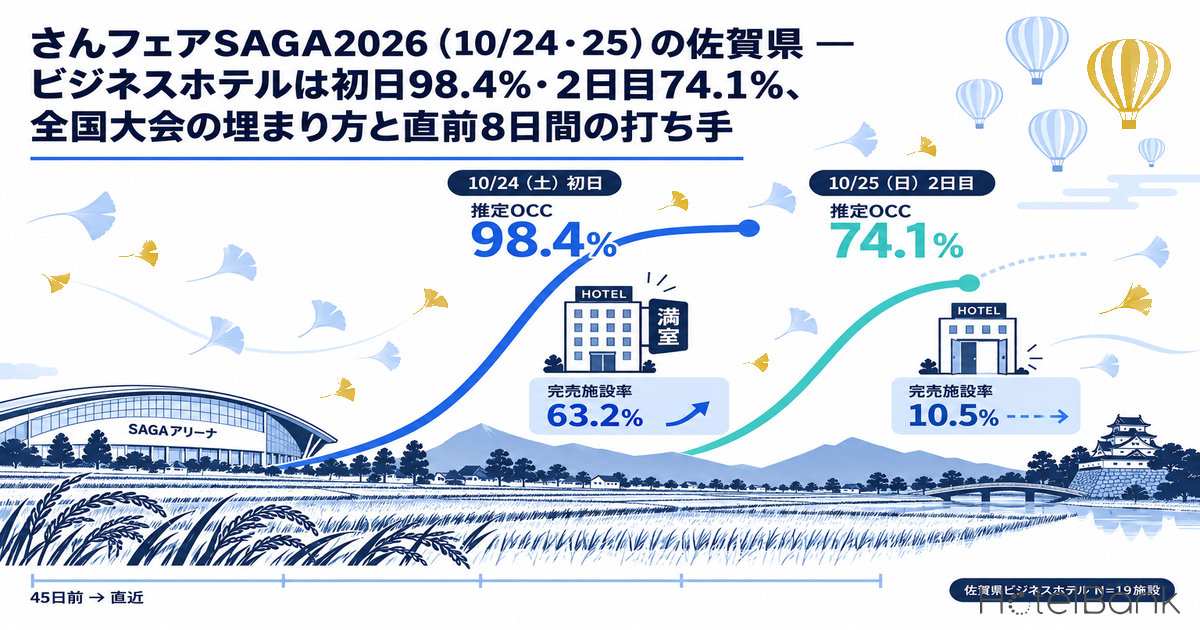
Ahead of Sanfair SAGA 2026, the 36th National Industrial Education Fair held in Saga Prefecture on Saturday October 24 and Sunday October 25, 2026 (venues include SAGA Arena, SAGA Plaza and Saga City Cultural Hall), we tracked booking curves from 45 days before each stay date to the latest observation. For business hotels in the prefecture (N=19 properties / 1,929 rooms), Day 1 (October 24) had reached an estimated OCC (OTA-listed inventory basis) of 98.4% with a sold-out property share of 63.2% at the latest reading, 9 days before the stay. Day 2 (October 25), by contrast, stood at only 74.1% with a 10.5% sold-out share at 10 days out. The normal Saturday the week before, October 17, reached 92.6% at 2 days out, so Day 1 had already passed the level a normal Saturday reaches at the last minute some 30 days in advance. Day 2 led the normal Sunday (October 18, 68.4% at 10 days out) by only 5.7pt. Ryokan (N=68 properties / 1,737 rooms) stood at 88.8% on Day 1 and 81.1% on Day 2, with a stronger Day 2 response than business hotels. This article uses fixed-point data to confirm the fill pattern typical of a national-convention-type event, where Day 1 is concentrated and Day 2 is left over, and sets out what can still be done in the remaining eight days.
Scope: Saga Prefecture business hotels N=19 properties (1,929 rooms), ryokan N=68 properties (1,737 rooms). This article covers occupancy progress only (estimated OCC, OTA-listed inventory basis), not price levels. Definitions are at the end of the article. Data as of October 16, 2026.
- — Business hotels on Day 1 (Oct 24) were at an estimated OCC of 98.4% with a 63.2% sold-out share at 9 days out (N=19 properties, OTA-listed inventory basis, as of October 16, 2026). They were already at 91.7% at 45 days out; pickup over the 45 days was only 6.7pt.
- — Day 2 (Oct 25) was at 74.1% at 10 days out, +5.7pt over the normal Sunday (Oct 18). Applying normal-Sunday pickup gives a landing estimate of 78.6-86.6% (mid case 82.8%).
- — The eve of the fair, Oct 23 (Fri), was at 97.0% at 8 days out. At the same 10-days-out point it was above Fukuoka (87.7%) and Nagasaki (79.5%), showing eve-of-event demand as a pattern specific to Saga.
- — Oct 24 was also strong in Fukuoka (97.9% at 10 days out), making it a strong Saturday across northern Kyushu. The Saga-specific uplift should be read from the 45-days-out level and the Sunday lead (Saga +5.7pt vs Fukuoka +0.5pt and Nagasaki +1.2pt).
- — Ryokan (N=68 properties) showed a larger Day 2 lead of +9.6pt than business hotels, making Sat-Sun 2-night and Sunday check-in products a better fit.
Event Background — A Two-Day National Convention Across Four Venues
First, the event itself. Sanfair SAGA 2026, the 36th National Industrial Education Fair in Saga, is a nationwide industrial-education event for high school students, with the Ministry of Education, Culture, Sports, Science and Technology (MEXT), Saga Prefecture and the Saga Prefectural Board of Education among its organizers and supporters. According to the official website and the MEXT announcement, it runs on Saturday October 24, 2026 from 9:30 to 16:00 and Sunday October 25 from 9:00 to 16:00 at four venues: SAGA Arena (main venue), SAGA Plaza, Saga City Cultural Hall and Saga Women's High School. Alongside exhibitions and hands-on corners, the program includes competitions such as the National High School Flower Arrangement Contest and the National High School Business Idea Contest, so participating students, supervising teachers and staff tend to arrive the day before. The official sources give no attendance estimate, so this article does not speculate on scale and follows only the response of the lodging market.
The other point to note is that the 2026 Saga International Balloon Fiesta follows the next weekend (balloon competitions run for five days from Friday October 30 to Tuesday November 3, a national holiday, on the Kase River riverbed in Saga City, per the official announcement). When reading the October 24-25 figures, progress for October 31 and November 1 of the following weekend serves as a useful comparison, so it is shown later as well. How far the Balloon Fiesta's own lodging demand extends from the venue is broken down by distance band in Saga Balloon Fiesta 2026: 2,567 Rooms Within 10km of the Venue.
Business Hotels — Day 1 Was at 91.7% at 45 Days Out, Passing a Normal Saturday's Last-Minute Level 30 Days Early
The chart below tracks the estimated OCC (OTA-listed inventory basis) for each stay date across Saga Prefecture's 19 business hotels (1,929 rooms), from 45 days before the stay to the latest observation. October 24 (Sat) was already above 90% at 91.7% at 45 days out, then moved to 92.9% at 30 days, 96.5% at 20 days, 98.7% at 10 days and 98.4% at the latest reading 9 days out, staying pinned near the ceiling throughout. The sold-out property share (the estimated share of properties with no listed inventory visible on OTAs and similar channels) was 47.4% at 45 days out and 63.2% at 9 days out, meaning no allotment is visible at 12 of the 19 properties.
How unusual this shape is becomes clear when overlaid on the normal Saturday the week before, October 17. That date went from 56.4% at 45 days out to 71.1% at 30 days, 79.6% at 20 days, 89.3% at 10 days and 92.6% at the latest reading 2 days out, a typical last-minute Saturday curve that built 36.2pt over 45 days. October 24 was within 0.9pt of October 17's last-minute level (92.6%) already at 45 days out, and surpassed it at 30 days out with 92.9%. In other words, Day 1 demand for the national convention was largely locked in before the 45-day observation window, and pickup in the final 45 days was only 6.7pt.
Source: MetroEngines Research; compiled by HotelBank Editorial Team
Day 2, October 25 (Sun), looks completely different. It went from 65.8% at 45 days out to 67.8% at 30 days, 68.9% at 20 days and 74.1% at the latest reading 10 days out, a pickup of 8.3pt over 45 days, with a sold-out share of only 10.5% (2 of 19 properties). The comparable normal Sunday, October 18, was at 48.6% at 45 days out, 68.4% at 10 days and 72.1% at the latest reading 3 days out, so October 25 leads by just 5.7pt at the same 10-days-out point. In actuals for recent months, the Sunday average for Saga business hotels (as of the day before the stay) was 77.0% in August and 76.8% in September (N=18-21 properties; September includes the middle day of a three-day weekend). If October 25 builds from 10 days out like a normal Sunday, it is on track to land at around 78-87%, slightly above that band (see the landing scenarios below). It is hard to say that Day 1 spillover is automatically flowing into Day 2. The same pattern, where demand concentrates on the event date and does not seep into adjacent days, was observed in our booking curve analysis of the Hiroshima arena concert on Oct 17 (Sat).
Eve-of-event demand is clearly visible. October 23 (Fri), the day before the fair, ran at a level comparable to Day 1: 88.2% at 45 days out, 90.7% at 30 days, 96.1% at 10 days and 97.0% at the latest reading 8 days out, with a sold-out share of 42.1%. Participating schools and staff arriving the day before took Friday inventory first, indicating that Friday-to-Saturday stays are at the core of demand.
Ryokan — 88.8% on Day 1 and 81.1% on Day 2, With a Stronger Day 2 Response Than Business Hotels
Applying the same framework to 68 ryokan (1,737 rooms), October 24 (Sat) moved from 70.5% at 45 days out to 84.1% at 30 days, 85.3% at 20 days, 88.4% at 10 days and 88.8% at the latest reading 9 days out, with a sold-out share of 32.4%. The normal Saturday October 17 was at 59.7% at 45 days out, 81.3% at 10 days and 84.3% at the latest reading 2 days out, so ryokan Day 1 leads by 7.1pt at the same 10-days-out point. It is less extreme than business hotels, but confirms the national convention is also bringing demand to ryokan.
The notable point is Day 2. Ryokan on October 25 (Sun) moved from 64.2% at 45 days out to 73.9% at 30 days, 77.4% at 20 days and 81.1% at the latest reading 10 days out, a 9.6pt lead over the normal Sunday October 18 (71.5% at 10 days out). That is larger than the business-hotel Day 2 lead of 5.7pt: while business-hotel demand concentrates on Day 1, ryokan demand tends to be split across both weekend days. The ryokan Sunday average in recent months (as of the day before the stay) was 78.9% in September and 85.2% in October (1st to 16th). October 25 is already above the September average at 10 days out, and if pickup continues like a normal Sunday it is on track to exceed the upper end of that band. The eve of the fair, October 23 (Fri), was at 81.2% with a 10.3% sold-out share at 8 days out, so eve-of-event demand is less concentrated than for business hotels on Friday (97.0%).
Source: MetroEngines Research; compiled by HotelBank Editorial Team
Fixed-Point Comparison — Eight Stay Dates at 45 Days Out, 30 Days Out and the Latest Observation
The table below organizes the figures so far by stay date, at three points (45 days out, 30 days out and the latest observation) plus the sold-out share at the latest point. The Balloon Fiesta period the following weekend (October 31 and November 1) and November 7 (Sat) the week after are included for reference.
| Stay date | Segment | T-45 | T-30 | Latest (days remaining) | Sold-out share (latest) |
|---|---|---|---|---|---|
| Oct 17 (Sat) normal Saturday | Business | 56.4% | 71.1% | 92.6% (T-2) | 31.6% |
| Ryokan | 59.7% | 69.4% | 84.3% (T-2) | 27.9% | |
| Oct 18 (Sun) normal Sunday | Business | 48.6% | 56.7% | 72.1% (T-3) | 5.3% |
| Ryokan | 51.9% | 59.1% | 74.6% (T-3) | 17.6% | |
| Oct 23 (Fri) eve of the fair | Business | 88.2% | 90.7% | 97.0% (T-8) | 42.1% |
| Ryokan | 64.1% | 70.4% | 81.2% (T-8) | 10.3% | |
| Oct 24 (Sat) Sanfair Day 1 | Business | 91.7% | 92.9% | 98.4% (T-9) | 63.2% |
| Ryokan | 70.5% | 84.1% | 88.8% (T-9) | 32.4% | |
| Oct 25 (Sun) Sanfair Day 2 | Business | 65.8% | 67.8% | 74.1% (T-10) | 10.5% |
| Ryokan | 64.2% | 73.9% | 81.1% (T-10) | 22.1% | |
| Oct 31 (Sat) Balloon Fiesta period | Business | 79.8% | 91.0% | 93.7% (T-16) | 31.6% |
| Ryokan | 76.7% | 88.3% | 90.7% (T-16) | 48.5% | |
| Nov 1 (Sun) Balloon Fiesta period | Business | 78.1% | 84.7% | 88.6% (T-17) | 31.6% |
| Ryokan | 77.3% | 86.4% | 87.0% (T-17) | 36.8% | |
| Nov 7 (Sat) two weeks later | Business | 67.9% | 81.5% | 84.6% (T-23) | 26.3% |
| Ryokan | 68.6% | 83.0% | 86.2% (T-23) | 35.3% |
Estimated OCC (OTA-listed inventory basis). Business N=19 properties / 1,929 rooms; ryokan N=68 properties / 1,737 rooms. Based on observations from 45 days before each stay date to the latest reading. Source: MetroEngines Research; compiled by HotelBank Editorial Team
Reading the table across highlights the difference between a two-day event and a five-day event. Sunday November 1 during the Balloon Fiesta was already at 88.6% for business hotels and 87.0% for ryokan at 17 days out, above Sanfair Day 2 on October 25 (business 74.1%, ryokan 81.1% at 10 days out) despite having more days remaining. When an event covers the entire weekend, Sunday fills to near-Saturday levels; for a two-day Sat-Sun event, the dominant pattern is to stay on Day 1 and head home on Day 2, so Sunday demand struggles to grow. Sanfair's Day 2 fits this pattern exactly.
Source: MetroEngines Research; compiled by HotelBank Editorial Team
Neighboring Prefectures — Compared With Nagasaki and Fukuoka, What Is Specific to Saga Is the T-45 Level, the Eve-of-Event Friday and the Sunday Lead
To check how much of the effect can be attributed to Sanfair, we compared the same stay dates at the same lead time (10 days before the stay) with neighboring Nagasaki and Fukuoka prefectures. October 24 (Sat) was also high for Fukuoka business hotels at 97.9% at 10 days out (+8.1pt over the normal Saturday October 17 at the same point, 89.8%), showing it to be a strong Saturday across northern Kyushu. Treating the Day 1 level alone as the Sanfair effect would tend to overstate it.
| Prefecture | Segment | N (properties / rooms) | Oct 24 T-45 | Oct 17 vs Oct 24 (T-10) | Saturday gap | Oct 23 (Fri) T-10 | Oct 18 vs Oct 25 (T-10) | Sunday gap |
|---|---|---|---|---|---|---|---|---|
| Saga | Business | 19 properties / 1,929 rooms | 91.7% | 89.3% to 98.7% | +9.4pt | 96.1% | 68.4% to 74.1% | +5.7pt |
| Nagasaki | Business | 58 properties / 4,574 rooms | 72.3% | 79.9% to 86.4% | +6.5pt | 79.5% | 70.4% to 71.6% | +1.2pt |
| Fukuoka | Business | 179 properties / 22,829 rooms | 88.9% | 89.8% to 97.9% | +8.1pt | 87.7% | 81.0% to 81.5% | +0.5pt |
| Saga | Ryokan | 68 properties / 1,737 rooms | 70.5% | 81.3% to 88.4% | +7.1pt | 80.9% | 71.5% to 81.1% | +9.6pt |
| Nagasaki | Ryokan | 49 properties / 1,730 rooms | 65.9% | 81.7% to 85.9% | +4.2pt | 73.8% | 75.0% to 78.3% | +3.3pt |
| Fukuoka | Ryokan | 52 properties / 952 rooms | 59.2% | 84.7% to 88.3% | +3.6pt | 75.7% | 70.8% to 77.3% | +6.5pt |
Estimated OCC (OTA-listed inventory basis). Each prefecture and segment uses a fixed cohort per stay date (Fukuoka business on Oct 24 only: 178 properties / 22,797 rooms). Source: MetroEngines Research; compiled by HotelBank Editorial Team
That said, three patterns are specific to Saga. First, the 45-days-out level: for business hotels on October 24, Saga was at 91.7% versus 88.9% in Fukuoka and 72.3% in Nagasaki, filling earliest. Second, the eve of the fair, October 23 (Fri): at 10 days out Saga was at 96.1% versus 87.7% in Fukuoka and 79.5% in Nagasaki, with only Saga at a level comparable to Day 1. Third, the Day 2 Sunday: the lead over the normal Sunday October 18 was +5.7pt in Saga versus only +0.5pt in Fukuoka and +1.2pt in Nagasaki. The Day 2 lead described earlier as only 5.7pt is, compared with neighbors, also a Saga-specific uplift, showing that Day 2 demand is not zero. For ryokan as well, the October 25 lead was largest in Saga at +9.6pt, versus +3.3pt in Nagasaki and +6.5pt in Fukuoka.
Day 2 (Oct 25) Landing Range — Three Scenarios Based on Normal-Sunday Pickup
We estimate where Day 2, October 25, will finally land as a range based on past pickup on normal Sundays. Taking the six Sundays from August 23 to October 4, 2026, excluding the middle days of three-day weekends (September 20 and October 11), pickup in estimated OCC from 10 days before the stay to the day before was +4.5 to +12.5pt for business hotels (median +8.7pt) and +10.3 to +13.7pt for ryokan (median +12.2pt). The table below adds these to October 25's 10-days-out value.
| Segment | T-10 (current) | Pessimistic (min pickup) | Mid (median) | Optimistic (max pickup) | Reference: avg of 6 normal Sundays at T-1 |
|---|---|---|---|---|---|
| Business (N=19 properties) | 74.1% | 78.6% (+4.5pt) | 82.8% (+8.7pt) | 86.6% (+12.5pt) | 73.6% |
| Ryokan (N=68 properties) | 81.1% | 91.4% (+10.3pt) | 93.3% (+12.2pt) | 94.8% (+13.7pt) | 72.0% |
Six normal Sundays = Aug 23, Aug 30, Sep 6, Sep 13, Sep 27 and Oct 4 (business N=19-21 properties, ryokan N=66-75 properties). Estimated OCC (OTA-listed inventory basis), as of October 16, 2026. Source: MetroEngines Research; compiled by HotelBank Editorial Team
Even in the mid scenario, business hotels on October 25 would land at 82.8%, roughly 9pt above the normal-Sunday average at the day before the stay (73.6%). Day 2 is not likely to sink to an ordinary Sunday; it will probably fill to a level a notch above a normal Sunday. Still, with just under 20% of market inventory left even in the mid case, and 12 of 21 properties holding more than 30% remaining, the conclusion stands: hotels cannot leave Day 2 to organic demand alone. For ryokan, pickup itself is larger and even the pessimistic case exceeds 90%, but growth toward the day before can include apparent absorption from stop-sells (closing listed inventory), so the upper end should be discounted.
Remaining Allotment by Property — On Day 1, 13 of 16 Properties Have 10% or Less Left; on Day 2, 12 of 21 Have More Than 30%
Market-wide estimated OCC alone does not show which properties hold the remaining allotment. We therefore aggregated, anonymously, the distribution of remaining allotment (listed remaining rooms divided by total rooms) per stay date among properties where an allotment of at least 30% of total rooms was observed. Note that the eligible properties change by stay date depending on observed allotments, so the populations are not identical.
| Stay date / segment | Properties (rooms) | 10% or less remaining | of which zero remaining | 10-30% | Over 30% |
|---|---|---|---|---|---|
| Oct 24 (Sat) Business | 16 properties (917 rooms) | 13 | 9 | 3 | 0 |
| Oct 25 (Sun) Business | 21 properties (1,705 rooms) | 3 | 0 | 6 | 12 |
| Oct 24 (Sat) Ryokan | 48 properties (1,123 rooms) | 23 | 12 | 20 | 5 |
| Oct 25 (Sun) Ryokan | 57 properties (1,125 rooms) | 20 | 11 | 20 | 17 |
Listed inventory by property (properties with 5+ total rooms and an observed allotment of at least 30% of total rooms). As of October 16, 2026. Source: MetroEngines Research; compiled by HotelBank Editorial Team
For business hotels on Day 1, October 24, 13 of the 16 eligible properties have 10% or less remaining, and 9 have nothing left. Moreover, 7 of those 13 had already recorded a state with no visible listed inventory at least once 45 or more days before the stay (5 of which are still at zero), suggesting national-convention demand secured allotments early. On Day 2, October 25, by contrast, only 3 of 21 eligible properties have 10% or less remaining, while 12 (a majority) have more than 30%. Inquiries turned away on a full Day 1 are not flowing to Day 2, so the Day 2 leftover is a challenge shared by almost every property. For ryokan, 23 of 48 properties on Day 1 and 20 of 57 on Day 2 have 10% or less remaining, which differs from business hotels in that a certain number of properties are tight even on Day 2. Our analysis of stock depletion types in Fukuoka on Oct 24 (Sat), which splits the per-property distribution for the same date into early sell-out, last-minute absorption and leftover types, is also a useful neighboring benchmark.
For Revenue Managers at Business Hotels and Ryokan in Saga Prefecture — Implications and Action Plan
Implication 1 — Day 1 (Oct 24) is sold out at market level; the remaining question is not single-night sales but how to package stays. Business hotels on Day 1 reached 98.4% with a 63.2% sold-out share at 9 days out, and pickup since 45 days out was only 6.7pt. If your Oct 24 is not yet full, demand turned away elsewhere in the market will flow to you, so there is room to accept it on 2-night terms combined with Friday or Sunday rather than selling single nights. Conversely, if your Oct 24 is already full, now is the time to set up a path that steers same-day inquiries to Oct 25 inventory (offering the next night, presenting multi-night terms).
Implication 2 — Day 2 (Oct 25) is tracking only a notch above an ordinary Sunday and will not fill on organic demand alone. Business hotels on Oct 25 were at 74.1% at 10 days out, only 5.7pt ahead of the normal Sunday Oct 18 at the same point (68.4%), and 12 of 21 properties have more than 30% remaining. Applying normal-Sunday pickup gives a landing of 78.6-86.6% (mid 82.8%), only slightly above the recent-month Sunday averages (77.0% in August, 76.8% in September). Inventory strategies that assume Day 1 demand will automatically spill into Day 2 should be revisited. Day 2 demand has to be created either by extending Day 1 guests by one night or by having guests check in on Sunday and connecting to Monday business demand.
Implication 3 — The eve of the fair (Oct 23) is already at 97.0%, and the last few Friday rooms should be sold as 2-night stays. Participating schools and staff arriving the day before have pushed Friday to the same level as Day 1. If you still have Friday inventory, the choice is between selling Fri-Sat 2-night only and restricting Friday single nights on the assumption that Saturday will be full. Filling Friday with single nights first leaves you without multi-night capacity for Saturday inquiries.
Implication 4 — Ryokan show a stronger Day 2 response than business hotels, so Sat-Sun 2-night products fit well. Ryokan on Oct 25 lead the normal Sunday by 9.6pt (business hotels 5.7pt), and the Day 1 vs Day 2 gap of 88.8% vs 81.1% is far narrower than for business hotels (98.4% vs 74.1%). Visitors during the fair may be heading to onsen towns in the prefecture, so it is worth checking capacity for Sat-Sun 2-night stays and Sunday check-ins (staying after visiting Day 2).
Based on the above, the actions are organized along the eight-day timeline to the stay dates. All assume you compare the market values in this article with your own position before deciding, and none guarantees results.
| Timing | Action | Decision trigger (vs market values in this article) | Objective |
|---|---|---|---|
| Today to Oct 20 (T-8 to T-4) | Set a 2-night condition (minimum stay of 2 nights) for Oct 24-25 and restrict single-night bookings on Oct 24 | Your Oct 24 remaining allotment is larger than the market (business sold-out share 63.2%; 13 of 16 properties at 10% or less remaining) | Carry the overflow demand arriving for Day 1 into Day 2 |
| Today to Oct 20 | Launch an extended-stay discount for Oct 25 and a Sunday check-in plan (Sun-Mon) | Your estimated Oct 25 progress is below the market 74.1% (T-10), or more than 30% remains | Sell Day 2 inventory by connecting it to Monday business demand |
| Today to Oct 20 | Switch the last few rooms on Oct 23 to Fri-Sat 2-night only | You still have Oct 23 inventory while the market Friday holds at 97.0% with 42.1% sold out | Turn eve-of-event demand into multi-night stays instead of single nights |
| Oct 21 to Oct 23 (T-3 to T-1) | Lift the minimum-stay condition on Oct 24 and release remaining rooms as single nights | Your Oct 24 still has rooms at T-3 (the normal Saturday Oct 17 went 93.2% at T-3 to 92.6% at T-2, i.e. pickup nearly stopped) | Avoid leaving rooms unsold under the multi-night condition |
| Oct 21 to Oct 23 | Feature Oct 25 inventory for Day-2-only visitors, with a multi-night offer tied to the Balloon Fiesta the following weekend (Oct 30 to Nov 3) | Your Oct 25 progress is expected to fall below the market landing estimate (mid scenario 82.8%; recent-month Sunday average 76.8-77.0%) | Minimize unsold Sunday single nights |
| Oct 24 to Oct 25 (day of) | Redirect Day 1 walk-ins and full-house inquiries to next-night stays to absorb Oct 25 inventory | The market Day 1 sold-out share is high at 63.2%, so turn-aways on the day are likely | Capture turned-away demand on Day 2 instead of losing it |
Prepared by HotelBank Editorial Team. All market values in the decision triggers are figures from this article (as of October 16, 2026).
Summary — Three Yardsticks for Reading National-Convention-Type Events
The response of Saga Prefecture's lodging market to Sanfair SAGA 2026 can be summarized in three points. First, the level reached at 45 days out. Business hotels on Day 1, October 24, were at 91.7% at 45 days out, 35.3pt above the normal Saturday (October 17) at 56.4% at the same point, so national-convention demand was largely locked in before the observation window. A date that approaches a normal Saturday's last-minute level already at 45 days out is one where inventory should not be held on the assumption of last-minute pickup. Second, the Day 2 lead. October 25 led the normal Sunday at the same point by only 5.7pt for business hotels and 9.6pt for ryokan, so the Sunday of a two-day Sat-Sun event must be treated not as an extension of Day 1 but as a day only a notch above an ordinary Sunday. Contrasting this with Sunday November 1 of the following weekend's Balloon Fiesta, already at 88.6% at 17 days out, shows that the character of Sunday changes depending on whether the event covers the weekend. Third, the eve-of-event level. Business hotels on October 23, the day before the fair, reached 97.0% at 8 days out, showing that for national-convention-type events the eve of the event carries the same weight as Day 1.
With eight days left, the question comes down not to the already-full Day 1 but to how to package the unfilled Day 2 and the last few eve-of-event rooms. Compare the market values in this article with your own progress, and check minimum stays, multi-night conditions and the path to next-night stays one by one.
Frequently Asked Questions
Q. When and where is Sanfair SAGA 2026 held?
A. Saturday October 24, 2026 from 9:30 to 16:00 and Sunday October 25 from 9:00 to 16:00. The four venues are SAGA Arena, SAGA Plaza, Saga City Cultural Hall and Saga Women's High School (official website and MEXT announcement).
Q. How full are Saga Prefecture business hotels on Day 1, October 24?
A. At the observation 9 days before the stay, estimated OCC (OTA-listed inventory basis) was 98.4% with a sold-out property share of 63.2% (N=19 properties / 1,929 rooms, as of October 16, 2026). It had already reached 91.7% at 45 days out.
Q. How full is Day 2, October 25, likely to get?
A. It was at 74.1% at 10 days out. Applying the T-10 to T-1 pickup of six normal Sundays (+4.5 to +12.5pt) gives a landing estimate of 78.6-86.6%, with a mid case of 82.8%.
Q. Is the high level on October 24 entirely due to Sanfair?
A. Fukuoka Prefecture business hotels were also high on the same date at 97.9% at 10 days out, making it a strong Saturday across northern Kyushu. What is specific to Saga is the 45-days-out level (91.7%), the eve-of-event Friday level (96.1% at 10 days out) and the Sunday lead (+5.7pt).
Q. How does it differ from the Balloon Fiesta the following week?
A. Sunday November 1, during the five-day Balloon Fiesta, was at 88.6% for business hotels at 17 days out, above Sanfair Day 2 (74.1% at 10 days out). When an event covers the weekend, Sunday also fills to near-Saturday levels.
Q. What is estimated OCC (OTA-listed inventory basis)?
A. An estimate calculated as 100 – 100 x OTA-listed remaining rooms / total rooms. It is computed on a fixed cohort of properties that list at least 30% of their total rooms on OTAs, and because unlisted rooms are counted as absorbed, it runs higher than actual room occupancy.
About the Data
– Definition of estimated OCC (OTA-listed inventory basis): OTA-listed-inventory occupancy = 100 – 100 x OTA-listed remaining rooms / total rooms. The cohort consists of properties listing at least 30% of total rooms on OTAs, fixed per stay date (the same set of properties for each stay date; N= in the text is that property count). It is an estimate based on absorption of inventory sold on OTAs and is defined differently from actual room occupancy (it runs higher because unlisted rooms are counted as absorbed).
– Booking curves: based on observations from 45 days before each stay date to the latest reading. The days remaining at each stay date's latest observation are shown in the text and tables.
– Actuals for recent months (monthly and day-of-week averages for August, September and October 1-16) aggregate, by day, the estimated OCC as of the day before each stay date. Business N=18-21 properties, ryokan N=56-78 properties (varies by day).
– Distribution of remaining allotment by property: covers properties with 5 or more total rooms and an observed allotment of at least 30% of total rooms, classified by listed remaining rooms / total rooms as of October 16, 2026. Eligible properties differ by stay date.
– Sold-out property share: the estimated share of properties with no listed inventory visible on OTAs and similar channels.
– N= breakdown: booking curves cover 19 business hotels (1,929 rooms) and 68 ryokan (1,737 rooms), both based on listings on major booking sites. City hotels are not covered because there are too few eligible properties in the prefecture.
– This article covers occupancy progress only, not price levels (estimated settled ADR).
– Data as of October 16, 2026. Sales status and inventory change daily, so the figures in this article are a snapshot at the time of retrieval.
References and Sources
■ Data Sources
Daily observations of OTA-listed inventory and remaining rooms (MetroEngines Research). The primary scope is fixed cohorts of 19 business hotels (1,929 rooms) and 68 ryokan (1,737 rooms) in Saga Prefecture; for comparison, the same segments in Nagasaki and Fukuoka prefectures were aggregated for the same stay dates at the same lead times. Event information is from the official website, the MEXT announcement and the Saga Balloon Fiesta Organizing Committee.
■ Estimation Assumptions
The Day 2 landing scenarios take the minimum, median and maximum T-10 to T-1 pickup across six normal Sundays from August 23 to October 4, 2026 (excluding middle days of three-day weekends) and add them to October 25's 10-days-out value. The neighboring-prefecture comparison aligns all prefectures at 10 days before the stay.
■ Limitations and Caveats
Estimated OCC is on an OTA-listed inventory basis, defined differently from actual occupancy, and also counts reductions in listed inventory due to stop-sells as absorption. The scenarios assume past normal-Sunday pickup repeats and do not factor in event-specific last-minute demand or weather. Figures are a snapshot as of October 16, 2026.
■ Sources
– Official website of Sanfair SAGA 2026, the 36th National Industrial Education Fair in Saga https://sanfair-saga2026.jp/
– MEXT, "Holding of the 36th National Industrial Education Fair in Saga" (Japanese) https://www.mext.go.jp/b_menu/houdou/mext_01683.html
– 2026 Saga International Balloon Fiesta event outline (Saga Balloon Fiesta Organizing Committee) https://www.sibf.jp/2026/outline/
– Lodging data: MetroEngines Research; compiled by HotelBank Editorial Team
Related Articles
- Saga Balloon Fiesta 2026: 2,567 Rooms Within 10km, 12,157 Within 30km
- Hiroshima Arena Concert Oct 17: 85.1% OCC at T-45, Little Spillover (Estimated OCC figures are each article's own aggregates, OTA-listed inventory basis. This article's data is as of October 16, 2026.)
- Fukuoka Oct 24: 48.9% Sold Out at 14 Days Out, Median 1.1% Left
- Saga Obon 2026: Ryokan Peak Aug 11, Not Aug 13; Aug 15 Down 6.5pt
- Naha Tug-of-War Weekend 2026: Okinawa Business Hotels 97.7% to 84.8%
- Awaodori 2026: 98.8% Sold 45 Days Out — 39.4pt Over Normal Weekends
- Autumn Festivals 2026: Kawagoe 1 Night, Kyoto 1, Saga 7 Nights
- Nagasaki Kunchi 2026: Oct 8 Biz Hotel OCC 88.8%, Final Night 76.6% (Estimated OCC figures are each article's own aggregates, OTA-listed inventory basis. This article's data is as of October 16, 2026.)