

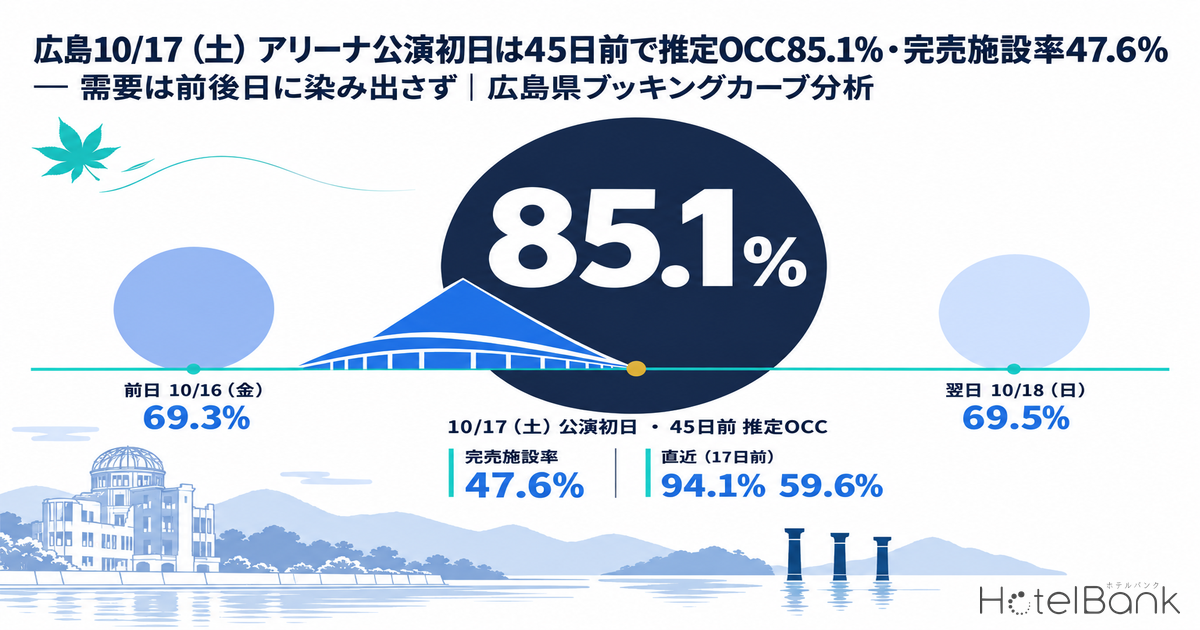
For the two-day arena concert run in Hiroshima Prefecture on Saturday, October 17 and Sunday, October 18, 2026, hotel booking pace across the prefecture stands out on just one night: the opening night, Saturday, October 17. At 45 days before the stay date, estimated OCC (based on OTA-listed inventory) was already 85.1%, and the share of properties with no listed inventory on OTAs and similar channels (sell-out rate, estimated) had reached 47.6%. By the latest reading (17 days out) these had climbed to 94.1% and 59.6% (all properties, N=272 properties / 15,343 rooms). By contrast, the day before, Friday, October 16, was at 69.3% at T-45; the day after, Sunday, October 18, at 69.5%; and Monday, October 19, at 66.8% — all more than 15pt below the concert night, with a 10–13pt gap still remaining at the latest reading. Demand is concentrated on the concert night, and spillover into adjacent nights is limited. This article combines daily booking curves and sell-out rates, the distribution of property-level sell-out timing, and estimated settled ADR for finalized months to lay out a practical playbook: at what price range to sell the remaining concert-night rooms, how to fill the adjacent nights, and in what order to lift rate fences.
Scope: Hiroshima Prefecture, all properties N=272–275 (about 15,350 rooms); business hotels N=98 properties (11,141 rooms). The price metric in this article is estimated settled ADR (the settled price level estimated from OTA and other sales data, excluding tax), and occupancy is an estimate based on OTA-listed inventory. Both are defined at the end of the article. Data as of September 30, 2026.
| 1 | Concert day 1, Sat 10/17, stood at 85.1% estimated OCC at T-45 (observed September 2, 2026; all properties N=272) with a 47.6% sell-out rate, reaching 94.1% and 59.6% at the latest reading (T-17, observed September 30, 2026). More than half of all properties in the prefecture have no listed inventory left for the concert night. |
| 2 | The day before, Fri 10/16, went from 69.3% at T-45 to 83.6% at the latest reading; the day after, Sun 10/18, from 69.5% to 80.8%. The gap to the concert day is about 16pt at T-45 and still 10–13pt at the latest reading, so spillover into adjacent nights is limited. |
| 3 | Another Saturday, 10/24, went from 73.9% at T-45 to 84.3% at T-24. At the same T-24 point, 10/17 was at 91.8%, 7.5pt higher — a ramp-up one step earlier than a normal Saturday. |
| 4 | At the property level, 22 of 95 panel properties (23.2%) were sold out for 10/17 from 45 or more days before the stay date, with 11 more selling out at T-31 to T-45 and 10 more at T-17 to T-30. For 10/18, only 11 properties (11.1%) were sold out from T-45 or earlier. |
| 5 | Final-month estimated settled ADR for Hiroshima business hotels was ¥7,911 in October 2025 (N=186, +6.3% YoY) and ¥11,488 for city hotels (N=29, −1.1%). Concert-night pricing should start from this settled level and be adjusted step by step against the remaining-inventory ratio (unsold rooms as a share of total rooms). |
Booking Pace for Saturday, October 17 — Nearly Half of Properties Sold Out at T-45
First, the facts. Hiroshima Green Arena (広島グリーンアリーナ, Hiroshima Prefectural Sports Center) is scheduled to host the Hiroshima leg of a national arena tour over two days, Saturday, October 17 and Sunday, October 18, 2026 (dates and venue confirmed on multiple venue-schedule aggregator sites, where the show is listed as “NEWS LIVE TOUR 2026 /// KMK”). In addition, Hiroshima Sun Plaza Hall (広島サンプラザホール) has an artist’s 10th-anniversary tour scheduled for 6 p.m. on Saturday, October 17 and 4 p.m. on Sunday, October 18, so weekend visitor demand overlaps across two venues — one in central Hiroshima and one in Nishi Ward.
The chart below compares booking pace by stay date for this weekend, using booking curves from 45 days before the stay date to the latest reading. Coverage is all properties in Hiroshima Prefecture, N=272–275 (about 15,350 rooms, based on listings on major booking sites), and the metric is estimated OCC based on OTA-listed inventory.
Figure 1: Daily booking curves for all properties in Hiroshima Prefecture (estimated OCC based on OTA-listed inventory, T-45 to latest). Sat 10/24 is overlaid as a grey dashed line for reference. Source: MetroEngines Research; compiled by HotelBank Editorial Team
Saturday, October 17 had already reached 85.1% at T-45 (observed September 2), rising to 89.5% at T-30 and 94.1% at the latest reading, T-17 (observed September 30). The 45-day gain was +9.0pt, leaving 907 of 15,343 rooms (5.9%) in listed inventory. The sell-out rate moved from 47.6% at T-45 to 52.8% at T-30 and 59.6% at the latest reading — by T-30, a majority of the properties covered had no listed inventory on OTAs and similar channels.
| Stay date | N (properties / rooms) | OCC T-45 | OCC T-30 | OCC latest | T-45 → latest | Sell-out rate T-45 → T-30 → latest | Listed rooms remaining (latest) |
|---|---|---|---|---|---|---|---|
| Fri 10/16 | 273 / 15,366 | 69.3% | 76.5% | 83.6% (T-16) | +14.3pt | 16.5%→19.8%→28.6% | 2,519 rooms (16.4%) |
| Sat 10/17 — concert day 1 | 272 / 15,343 | 85.1% | 89.5% | 94.1% (T-17) | +9.0pt | 47.6%→52.8%→59.6% | 907 rooms (5.9%) |
| Sun 10/18 — concert day 2 | 275 / 15,371 | 69.5% | 76.4% | 80.8% (T-18) | +11.3pt | 19.3%→23.1%→25.1% | 2,946 rooms (19.2%) |
| Mon 10/19 | 274 / 15,349 | 66.8% | 73.8% | 78.6% (T-19) | +11.8pt | 19.3%→22.8%→26.3% | 3,287 rooms (21.4%) |
Table 1: Daily booking pace for all properties in Hiroshima Prefecture (estimated OCC based on OTA-listed inventory; sell-out rate = share of properties with no listed inventory on OTAs and similar channels, estimated). “Latest” = observed September 30, 2026. Source: MetroEngines Research; compiled by HotelBank Editorial Team
Limited Spillover to the Day Before and After — About 16pt Apart at T-45, Still Over 10pt at the Latest Reading
As Table 1 shows, the gap between the opening night and the adjacent nights is large. At T-45, estimated OCC was 85.1% for 10/17 versus 69.3% for Fri 10/16, 69.5% for Sun 10/18 and 66.8% for Mon 10/19 — a gap of 15.6–18.3pt to the concert night. At the latest reading the gaps are still 10.5pt to 10/16, 13.3pt to 10/18 and 15.5pt to 10/19; even Sunday 10/18, the second concert day, has not come close to the opening-night level.
The size of the pickup differs, however. 10/17 gained only +9.0pt over 45 days, while Fri 10/16 gained +14.3pt, Sun 10/18 +11.3pt and Mon 10/19 +11.8pt — larger gains on the adjacent nights. The natural reading is that the concert night had little room left to build because it was already high at T-45, while the adjacent nights are filling toward the stay date along normal day-of-week patterns. Fri 10/16 in particular rose +7.1pt (76.5%→83.6%) in the 16 days from T-30 to the latest reading, so pre-concert demand may be shifting to Friday as concert-night inventory thins. That level (83.6%), however, sits within the range of normal September Fridays (81.1–89.4%, discussed below) and is not large enough to call an event-specific uplift.
The sell-out rate makes the difference even clearer. At the latest reading, 59.6% of properties had no listed inventory for 10/17, compared with 28.6% for 10/16, 25.1% for 10/18 and 26.3% for 10/19 — all less than half the concert-night figure. Estimated OCC and the sell-out rate can paint different pictures of the same stay date because they measure different things: OCC reflects how much listed inventory remains across the market, while the sell-out rate counts how many properties have nothing left to sell.
Figure 2: Sell-out rate for all properties in Hiroshima Prefecture (share of properties with no listed inventory on OTAs and similar channels, estimated), compared by stay date at three points: T-45, T-30 and latest. Source: MetroEngines Research; compiled by HotelBank Editorial Team
Business Hotels: Concert-Night Sell-Out Rate Above 60%
By category, the concentration on the concert night is sharper among business hotels (N=98 properties / 11,141 rooms), which account for most of the prefecture’s rooms. For 10/17, they stood at 86.7% estimated OCC with a 44.9% sell-out rate at T-45 (observed September 2, 2026), 90.1% and 58.2% at T-30, and 94.7% and 61.2% at the latest reading (T-17). By contrast, Fri 10/16 went 68.4%→76.1%→84.0% (sell-out rate 10.2%→13.3%→16.3%) and Sun 10/18 went 68.8%→76.5%→81.4% (7.1%→8.2%→10.2%) — about 18pt below the concert night at T-45 and still 10–13pt below at the latest reading.
| Stay date | OCC T-45 | OCC T-30 | OCC latest | Sell-out rate T-45 | Sell-out rate T-30 | Sell-out rate latest |
|---|---|---|---|---|---|---|
| Fri 10/16 | 68.4% | 76.1% | 84.0% | 10.2% | 13.3% | 16.3% |
| Sat 10/17 | 86.7% | 90.1% | 94.7% | 44.9% | 58.2% | 61.2% |
| Sun 10/18 | 68.8% | 76.5% | 81.4% | 7.1% | 8.2% | 10.2% |
| Mon 10/19 | 64.5% | 72.4% | 77.8% | 11.2% | 10.2% | 18.4% |
Table 2: Daily booking pace for business hotels in Hiroshima Prefecture (N=98 properties / 11,141 rooms). Estimated OCC based on OTA-listed inventory; “latest” = observed September 30, 2026. Source: MetroEngines Research; compiled by HotelBank Editorial Team
City hotels (N=14 properties / 1,683 rooms) are a small sample and should be treated as indicative only, but the direction matches business hotels: 10/17 went from 90.8% at T-45 to 95.1% at the latest reading, and 10/18 from 79.3% to 84.1%.
Compared With Other Saturdays — Ramping Up One Step Earlier Than a Normal Saturday
To gauge how “abnormal” the concert-night level is, we compare it with neighboring Saturdays at the same lead times. Saturday 10/24 was at 73.9% at T-45, 81.5% at T-30 and 84.3% at T-24; at the same T-24 point, 10/17 was at 91.8%, 7.5pt higher. Saturday 10/10, the first day of a three-day weekend, was at 73.9% at T-45, 82.8% at T-30 and 88.8% at T-17, reaching 92.3% at its latest reading (T-10) — but 10/17 was already at 94.1% at T-17, 5.3pt above the long-weekend opener at the same point.
| Saturday | Context | T-45 | T-30 | T-24 | T-17 | Latest |
|---|---|---|---|---|---|---|
| Sat 10/10 | First day of a three-day weekend (10/12 Sports Day) | 73.9% | 82.8% | 86.3% | 88.8% | 92.3% (T-10) |
| Sat 10/17 | Arena concert day 1 | 85.1% | 89.5% | 91.8% | 94.1% | 94.1% (T-17) |
| Sat 10/24 | Normal Saturday | 73.9% | 81.5% | 84.3% | — | 84.3% (T-24) |
Table 3: Fixed-point booking-curve comparison by Saturday for all properties in Hiroshima Prefecture (N=272–274; estimated OCC based on OTA-listed inventory). Source: MetroEngines Research; compiled by HotelBank Editorial Team
Note that 10/10 and 10/24 were both at exactly 73.9% at T-45. A long-weekend opener and a normal Saturday are indistinguishable at T-45; the difference emerges from pickup after T-30. 10/17, by contrast, was already 11.2pt higher at T-45 — the signature of event demand, where hotel bookings run ahead as the tour schedule is announced and ticket lottery results come out. For how Hiroshima’s booking curves differ by property type on ordinary dates, see our comparison of booking curves across Hiroshima’s three property segments.
Property-Level Sell-Out Timing — 23% of Properties Sold Out for 10/17 From T-45 or Earlier
Breaking the area-level curve down to individual properties shows when concert-night inventory disappeared. Table 4 shows the distribution of the point at which listed inventory first became unavailable, using an anonymized panel limited to properties listing at least 30% of their total rooms on OTAs and similar channels (10/17 N=95 properties, 10/18 N=99 properties).
| Timing of first sell-out | Sat 10/17, all properties N=95 | of which business hotels N=39 | Sun 10/18, all properties N=99 | of which business hotels N=41 |
|---|---|---|---|---|
| Sold out from 45+ days before the stay date | 22 properties (23.2%) | 10 properties (25.6%) | 11 properties (11.1%) | 1 property (2.4%) |
| Sold out at T-31 to T-45 | 11 properties (11.6%) | 6 properties (15.4%) | 3 properties (3.0%) | 0 properties |
| Sold out at T-17 to T-30 | 10 properties (10.5%) | 6 properties (15.4%) | 4 properties (4.0%) | 3 properties (7.3%) |
| Never sold out during the observation period | 52 properties (54.7%) | 17 properties (43.6%) | 81 properties (81.8%) | 37 properties (90.2%) |
| Panel median remaining-inventory ratio (latest) | 12.5% | — | 36.1% | — |
Table 4: Distribution of early sell-out timing by property in Hiroshima Prefecture (anonymized panel of properties listing at least 30% of total rooms on OTAs and similar channels. “Sold out” = listed inventory no longer visible on OTAs and similar channels, estimated. Timing is the first observed sell-out and includes properties whose inventory later reappeared). Observed September 30, 2026. Source: MetroEngines Research; compiled by HotelBank Editorial Team
For 10/17, 43 of the 95 panel properties (45.3%) had lost their listed inventory by T-17, and more than half of those — 22 properties — had been sold out from T-45 or earlier. Among business hotels, 22 of 39 (56.4%) recorded a sell-out at least once, and 17 were still in a sold-out state at the latest reading. For the following night, 10/18, only 18 of 99 panel properties (18.2%) recorded a sell-out; among business hotels, 37 of 41 (90.2%) never sold out, and 39 of 41 still had listed inventory at the latest reading. Although both nights belong to the same concert run, hotel demand is skewed toward the opening night. A likely factor is that the second show, on a Sunday, starts at 4 p.m. — earlier than the opening show (5 p.m.) — making a same-day return trip easier.
The “Sunday Dip” Pattern in September Weekend Results
To check whether the weakness of Sunday 10/18 is event-specific or simply Hiroshima’s normal day-of-week pattern, we line up daily results for the most recent completed month, September 2026, by weekend (estimated OCC based on OTA-listed inventory, using observations just before each stay date; all properties N=261–286).
| Week | Friday | Saturday | Sunday | Sat→Sun change |
|---|---|---|---|---|
| 9/4–9/6 | 85.3% | 85.2% | 71.2% | −14.0pt |
| 9/11–9/13 | 89.4% | 90.5% | 74.7% | −15.8pt |
| 9/18–9/20 (long weekend; 9/21 Respect for the Aged Day) | 81.1% | 97.2% | 100.0% | +2.8pt |
| 9/25–9/27 | 84.7% | 82.4% | 77.8% | −4.6pt |
Table 5: September 2026 weekend results for all properties in Hiroshima Prefecture (estimated OCC based on OTA-listed inventory, using observations just before each stay date; N=261–286). Source: MetroEngines Research; compiled by HotelBank Editorial Team
In the three weeks excluding the long weekend, Sunday ran 4.6–15.8pt below Saturday, while Friday was roughly level with Saturday. Hiroshima’s baseline pattern is “Friday and Saturday high, Sunday drops”, and the latest 80.8% for Sun 10/18 is actually higher than normal September Sundays (71.2–77.8%). The accurate reading, then, is that day-2 demand does lift Sunday above a normal Sunday, but not by enough to close the gap with the opening night. Fri 10/16 at 83.6% also sits within the September Friday range (81.1–89.4%); even if there is some pre-concert uplift, it falls within the normal variation of a Friday.
Settled Level of Estimated Settled ADR — ¥7,911 for Business Hotels in October (2025)
As the starting point for concert-night pricing, we check estimated settled ADR (excluding tax) for finalized months. For Hiroshima business hotels, October 2025 was ¥7,911 (N=186 properties), up 6.3% from ¥7,440 (N=190) in October 2024. City hotels were ¥11,488 (N=29), down 1.1% from ¥11,610 (N=30) a year earlier, and all categories combined were ¥9,139 (N=299), up 13.3% from ¥8,063 (N=310). For the most recent finalized month, August 2026, business hotels were ¥8,826 (N=187, +0.8% YoY), city hotels ¥15,237 (N=31, +8.4%) and all categories ¥10,431 (N=300, +4.4%).
Figure 3: Estimated settled ADR for business hotels in Hiroshima Prefecture (excluding tax; finalized months only), year-over-year overlay. 2024 N=187–191, 2025 N=183–189, 2026 N=184–189. Source: MetroEngines Research; compiled by HotelBank Editorial Team
| Category | Oct 2024 (final) | Oct 2025 (final) | YoY | Aug 2026 (latest final) | YoY |
|---|---|---|---|---|---|
| Business hotels | ¥7,440 (N=190) | ¥7,911 (N=186) | +6.3% | ¥8,826 (N=187) | +0.8% |
| City hotels | ¥11,610 (N=30) | ¥11,488 (N=29) | −1.1% | ¥15,237 (N=31) | +8.4% |
| All categories | ¥8,063 (N=310) | ¥9,139 (N=299) | +13.3% | ¥10,431 (N=300) | +4.4% |
Table 6: Estimated settled ADR in Hiroshima Prefecture (excluding tax; monthly; finalized months compared with finalized months). Source: MetroEngines Research; compiled by HotelBank Editorial Team
In 2025, business hotels peaked in August (¥8,757) and May (¥8,112), with October (¥7,911) and November (¥7,946) forming a secondary autumn peak. The final figure for October 2026 will only be known after month-end, but it is reasonable to expect the usual structure, in which months containing high-demand dates like the concert night lift the autumn peak. In practice, pricing works best on two layers: keep this monthly settled level as a “monthly yardstick”, and move up or down from it based on the remaining-inventory ratio for the concert night itself.
For Revenue Managers Running Business and City Hotels in Hiroshima — Implications and Action Plan
Operational insights
1. Selling out the concert night is a question of remaining-inventory ratio, not of whether it will fill. At the latest reading (observed September 30, 2026), the market is at 94.1% estimated OCC — 94.7% for business hotels — with a sell-out rate around 60%. If your remaining rooms for 10/17 exceed the market’s median remaining-inventory ratio (12.5%), first suspect that your price or booking conditions are out of step with the market, rather than a lack of demand. Conversely, if your ratio is below the median, there is room to hold the last few rooms for the latest-booking, highest-paying segment.
2. Design the adjacent nights as “a normal Friday and Sunday”, not as “the event’s aftershock”. Fri 10/16 at 83.6% and Sun 10/18 at 80.8% are within the normal variation of September weekends, and there is little sign that concertgoers are generating large volumes of pre- or post-stays. Leaving the adjacent nights at high rates as an extension of the concert night risks losing even ordinary day-of-week demand. The price gap between the concert night and the adjacent nights should be a gentle step, comparable to the market OCC gap (10–13pt at the latest reading).
3. Build multi-night stays in the “day before → concert night” direction rather than “concert night → day after”. The second show on 10/18 starts at 4 p.m. — earlier than the opening show (5 p.m.) — making a same-day return easier. Meanwhile, a pre-stay that checks in Friday night ahead of the Saturday show becomes more attractive the thinner concert-night inventory gets. Making a two-night Friday check-in (10/16–17) look slightly more favorable than a concert-night single stay fills 10/16 (2,519 rooms still open in the market) while keeping concert-night inventory for higher-rate guests.
4. Treat post-checkout demand (daytime on 10/18) as a lever separate from room revenue. Sunday 10/18 is weak as a stay date, but if many opening-night guests also attend the second show, there is demand for “daytime stay” services such as late checkout and luggage storage. It makes sense to capture this as ancillary revenue, decoupled from room-inventory pricing.
Action Plan — Three Stages From Today to the Concert
| Timeframe | Action | Decision trigger (tied to figures in this article) | Goal |
|---|---|---|---|
| Today to this week (T-17 to T-14) | Benchmark your 10/17 remaining-inventory ratio against the market and lock in the price range | If your 10/17 remaining-inventory ratio exceeds the market panel median of 12.5%, check whether price, minimum length of stay or cancellation terms are out of line with the market | Remove obstacles to selling out first |
| Today to this week | Feature a two-night Friday check-in plan for 10/16–17 | While the market estimated OCC for Fri 10/16 stays at 83.6%, within the September Friday range, present two nights as easier to choose than a concert-night single stay | Capture pre-stay demand and preserve concert-night inventory |
| Within two weeks (T-14 to T-7) | Lift the minimum-stay fence on the concert night | Once the market sell-out rate rises further from the latest 59.6% and your 10/17 remaining rooms approach single digits, release the two-night restriction and open single stays to high-rate guests | Sell the last few rooms at the highest price |
| Within two weeks | Return Sun 10/18 to a “normal Sunday” price range | If your 10/18 remaining-inventory ratio is at or above the market (19.2% at the latest reading; panel median 36.1%), there is little basis for keeping concert-linked high rates | Avoid missing ordinary Sunday demand |
| Final days (T-7 to the day) | Lift the cancellation-terms fence and immediately resell returned concert-night inventory | With market listed inventory down to 907 rooms (5.9%), returned rooms sell readily even at the last minute. Relist returns as soon as they occur, keeping the concert-night price range | Avoid losing returned inventory |
| Final days to the day | Offer daytime-stay options for 10/18 (late checkout, luggage storage) to opening-night guests | With 10/18 at 80.8% in the market, 13.3pt below the opening night, capture day 2 through ancillaries rather than stays | Additional ancillary revenue |
Table 7: Action plan (figures are market values as of September 30, 2026 in this article; outcomes are not guaranteed). Source: HotelBank Editorial Team
Summary — Three Yardsticks for Measuring Event Dates
We distill the data in this article into three yardsticks that can be reused for the next event date.
| Yardstick | This case (Hiroshima Prefecture, all properties) | How to read it |
|---|---|---|
| How far estimated OCC at T-45 exceeds the same weekday on a normal date | 85.1% vs 73.9% (10/24) = +11.2pt | With a lead of more than 10pt, raise the price range fully by T-45 |
| Sell-out rate at T-30 | 52.8% | Once it passes 50%, remaining rooms become something to hold rather than push |
| OCC gap between adjacent nights and the concert night | 15.6–18.3pt at T-45; 10.5–15.5pt at the latest reading | If the gap does not narrow, sell the adjacent nights as normal weekdays |
Table 8: Three yardsticks for event-date decisions. Source: MetroEngines Research; compiled by HotelBank Editorial Team
For Hiroshima, October 17 was a date where most of the outcome was already decided by T-45. The remaining questions narrow down to two: at what price, and in what order of fence removal, to sell the few rooms left; and whether the adjacent nights can be fully sold as ordinary days of the week. The next time an arena tour date is announced, start by comparing estimated OCC at T-45 with the same weekday on a normal date, and use a lead of more than 10pt as the first decision signal.
About the Data
■ Data sources
Definition of estimated OCC (based on OTA-listed inventory): OTA-listed-inventory occupancy = 100 − 100 × OTA-listed remaining rooms ÷ total rooms. Coverage is a fixed cohort of properties listing at least 30% of their total rooms on OTAs (the same set of properties for each stay date; property counts are shown as N in each table). It is an estimate based on how OTA-sold inventory is being absorbed and differs in definition from actual room occupancy (rooms not listed are counted as absorbed, so it tends to read high). In this article it is labeled “estimated OCC (based on OTA-listed inventory)”.
Booking curves: based on observations from 45 days before the stay date to the latest reading. Fixed points are T-45, T-30 and the latest reading (observed September 30, 2026).
Estimated settled ADR: the settled price level (excluding tax) estimated from OTA and other sales data (lowest-plan level × category-specific coefficient, ensembled across multiple channels). Past months are final values; current and future months are estimates based on current sales. Median error versus published operating results is 6.6%. This article uses finalized months only, and YoY changes are calculated between finalized months.
■ Assumptions and coverage
Breakdown of N: booking curves cover all properties in Hiroshima Prefecture, N=272–275 (15,343–15,371 rooms); business hotels N=98 (11,141 rooms); city hotels N=14 (1,683 rooms, indicative). September 2026 daily results cover all properties, N=261–286. The property-level sell-out timing distribution uses an anonymized panel of properties listing at least 30% of total rooms on OTAs and similar channels (10/17 N=95, 10/18 N=99). Estimated settled ADR covers business hotels N=183–191, city hotels N=29–32 and all categories N=294–314 (varies by month). The sell-out rate is “the share of properties with no listed inventory on OTAs and similar channels, estimated”.
Event information: dates and venues were confirmed on venue-schedule aggregator sites and ticket information sites (see References at the end of the article).
■ Limitations
Data as of September 30, 2026. Sales and inventory change daily, so the figures in this article are a snapshot at the time of collection. Estimated OCC is an estimate based on OTA-listed inventory and differs in definition from actual room occupancy; no year-over-year same-date comparison of this metric is made. Day-of-week comparisons use estimated OCC only; day-of-week price differences are not covered. Property-level distributions are shown only as anonymized aggregates, and no individual property is identified.
Frequently Asked Questions
Q1. Does “a 47.6% sell-out rate at T-45” mean half of the properties are actually full?
Strictly speaking, it is an estimate of “the share of properties with no listed inventory visible on OTAs and similar channels”. It can include properties that have simply stopped listing but still have vacant rooms, so it differs in definition from being full in terms of actual room occupancy. It is, however, perfectly adequate for understanding the sales environment — namely, that bookable inventory in the market has been cut in half.
Q2. Should concert-night pricing be based on last October’s estimated settled ADR (¥7,911 for business hotels)?
¥7,911 is the final monthly average for October 2025, not a single-night level for the concert date. Keep it as a monthly yardstick, but in practice base concert-night decisions on a comparison between your own remaining-inventory ratio and the market’s remaining inventory (panel median 12.5%). There is no need to use the monthly average as a ceiling or floor for a single night.
Q3. Should prices for the day before and after also be raised in line with the concert night?
In this data, Fri 10/16 at 83.6% and Sun 10/18 at 80.8% are both within the range of normal September weekends, with little sign that concertgoers’ pre- and post-stays are lifting the market as a whole. It is reasonable to price the adjacent nights as a normal Friday and Sunday, and to keep the step to the concert night at about the size of the market OCC gap (10–13pt at the latest reading).
Q4. Why is the second concert day (10/18) weaker?
We cannot say for certain, but a likely factor is that the second day is a Sunday and the show starts at 4 p.m. — earlier than the opening show (5 p.m.) — making a same-day return easier. In Hiroshima Prefecture, September results also show a baseline pattern of Sunday running 4.6–15.8pt below Saturday, and 10/18 at 80.8% is actually high for a Sunday.
Q5. In what order should rate fences be lifted?
The action plan in this article lifts the minimum-stay fence first (within two weeks, once remaining rooms approach single digits), followed by the cancellation-terms fence (in the final days, when reselling returned inventory). When the market sell-out rate is around 60%, the last few rooms tend to sell latest and at the highest prices, so the key is not to lift restrictions too early.
References and Sources
• Hiroshima Green Arena schedule, September 2026–August 2027 (enjoy-live.net, Japanese) — confirms the dates and venue of the national arena tour’s Hiroshima shows on October 17 and 18
• Hiroshima Green Arena (Hiroshima Prefectural Sports Center) live, concert and event schedule 2026–2027 (live-events.a-jp.org, Japanese) — cross-checks the same dates and venue
• Hiroshima Sun Plaza Hall event listings (ticketjam.jp, Japanese) — confirms the 10th-anniversary tour shows at 6 p.m. on October 17 and 4 p.m. on October 18
• Internal data: MetroEngines Research; compiled by HotelBank Editorial Team (booking curves, sell-out rates, property-level sell-out timing distribution, estimated settled ADR)