

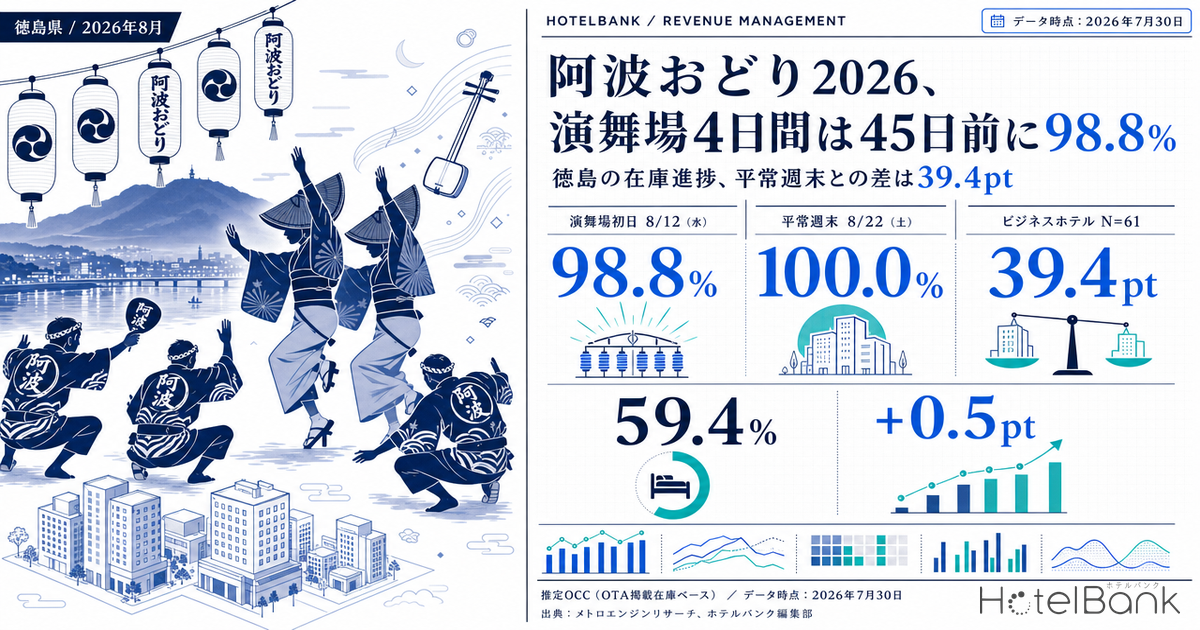
Tokushima City’s Awaodori 2026 opens on Tuesday, August 11 (a public holiday) with the indoor performance Takumi no Butai Masaribi (匠の舞台 優りび), with the four days from Wednesday, August 12 through Saturday, August 15 forming the main run of paid and free dance stages. Tracking how Tokushima’s accommodation inventory fills for those four dance-stage days, August 12 had already reached an estimated OCC of 98.8% (based on OTA-listed inventory) at 45 days before the stay date, with 88.4% of properties showing no bookable listed inventory at all (N=147 properties, 6,319 total rooms). The comparable normal weekends in the same month — August 22 and August 29 — stood at 59.4% and 60.2% respectively at 45 days out, a gap of 39.4pt against the opening dance-stage day. Narrowing to business hotels (N=61 properties, 4,215 rooms), August 12 was already at an estimated OCC of 100.0% at the 45-day observation point (stay date August 12, 2026). In other words, for a one-off large-scale event of this kind, the revenue management contest is settled well before 45 days out, not in the final stretch. This article deals only with the time axis of inventory pickup; it does not examine price premiums.
Scope: Tokushima Prefecture (all property types N=146–148 properties / business hotels N=59–61 properties). Price figures in this article are estimated settled ADR (the transaction price level inferred from OTA and other sales data, excluding tax); occupancy is an estimate based on OTA-listed inventory. Full definitions appear at the end of the article. Data as of July 30, 2026.
- — August 12, the opening dance-stage day, was at an estimated OCC of 98.8% at 45 days before the stay date (stay date August 12, 2026). The gain to the latest observation of 99.3% was only +0.5pt — the curve was essentially flat.
- — Narrowing to business hotels (N=61 properties), August 12 was already at an estimated OCC of 100.0% and a sold-out property rate of 100.0% at the 45-day cross-section (stay date August 12, 2026). Nothing observable changes within the final 45 days.
- — The normal weekends in the same month were at 59.4% (Aug 22) and 60.2% (Aug 29) at 45 days out. Against the opening dance-stage day, the gap is 39.4pt on OCC and 58.7pt on the sold-out property rate — the sold-out rate spreads much wider.
- — August 16, the day after the festival closes, sits at 74.8% in the latest observation (145 properties actually observed), 9.6pt above the 65.2% of the normal weekend of August 22. It is the strongest candidate for consecutive-night and length-of-stay extension. The decision point lies before a lead time of 45 days, not in the final stretch.
At the 45-day cross-section, the outcome was already decided
Line up the booking curves from 45 days before the stay date through the latest observation, and the shape of the lines for the four dance-stage days differs fundamentally from that of the normal weekends. Wednesday, August 12, the opening dance-stage day, gained only +0.5pt, from 98.8% at 45 days out to 99.3% at the latest reading (14 days out). Saturday, August 15 likewise moved only +0.6pt, from 95.3% at 45 days out to 95.9% at the latest reading (17 days out). The curves are close to flat: the level at 45 days out is already close to the final shape.
The normal weekends, by contrast, are still moving. Saturday, August 22 went from 59.4% at 45 days out to 65.2% at the latest reading (24 days out), +5.8pt; Saturday, August 29 went from 60.2% to 64.3% (31 days out), +4.1pt. The levels are lower, but they are accumulating steadily within the 45-day window. Within the same prefecture and the same month, one set of dates represents demand that has already been settled and the other demand that is still being decided — and the nature of the available levers is completely different.
Source: MetroEngines Research; compiled by the HotelBank Editorial Team
Measured by the share of properties with no confirmable listed inventory (estimated; hereafter the “sold-out property rate”), the gap widens further. August 12 stood at 88.4% at 45 days out against 29.7% for August 22 — a difference of 58.7pt, larger than the 39.4pt gap on OCC. This means that on the opening dance-stage day, properties with not a single room left already accounted for the large majority of the prefecture. On the normal weekends, by contrast, the market entered the final 45 days with roughly 70% of properties still holding inventory.
| Stay date | Position | 45 days out | 30 days out | Latest observation | 45 days out → latest | Sold-out property rate 45 days out → latest |
|---|---|---|---|---|---|---|
| Sat Aug 8 | Weekend before Obon | 88.9% | 89.9% | 94.3% (10 days out) | +5.4pt | 50.0% → 61.5% |
| Mon Aug 10 | Day before opening | 85.0% | 89.4% | 95.0% (12 days out) | +10.0pt | 42.9% → 61.9% |
| Tue Aug 11 (holiday) | Opening performance | 95.3% | 96.7% | 96.5% (13 days out) | +1.2pt | 63.0% → 73.3% |
| Wed Aug 12 | Dance stages, day 1 | 98.8% | 99.4% | 99.3% (14 days out) | +0.5pt | 88.4% → 89.8% |
| Thu Aug 13 | Dance stages | 98.6% | 98.7% | 99.5% (15 days out) | +0.9pt | 84.2% → 92.5% |
| Fri Aug 14 | Dance stages | 98.4% | 99.0% | 99.1% (16 days out) | +0.7pt | 82.3% → 86.4% |
| Sat Aug 15 | Dance stages, final day | 95.3% | 95.4% | 95.9% (17 days out) | +0.6pt | 68.0% → 63.3% |
| Sun Aug 16 | Day after closing | 69.5% | 73.3% | 74.8% (18 days out) | +5.3pt | 29.3% → 27.2% |
| Sat Aug 22 | Normal weekend | 59.4% | 64.3% | 65.2% (24 days out) | +5.8pt | 29.7% → 27.0% |
| Sat Aug 29 | Normal weekend | 60.2% | — (not yet reached) | 64.3% (31 days out) | +4.1pt | 19.6% → 17.5% |
Tokushima, all property types, N=146–148 properties. Estimated OCC (based on OTA-listed inventory). Source: MetroEngines Research; compiled by the HotelBank Editorial Team
What deserves attention here is that the sold-out property rate moves in opposite directions for August 15 and August 12. August 12 edged up from 88.4% to 89.8%, while August 15 fell 4.7pt, from 68.0% to 63.3%. On dates already close to the ceiling, movement inside the final 45 days consists less of net new pickup than of inventory that had been filled coming back into the market. A flat curve does not mean inventory has stopped moving. That said, part of this 4.7pt decline reflects an apparent shift caused by the number of properties actually observed rising from 68 at 45 days out to 145 at the latest reading. Not all of the decline can be attributed to cancellations returning, so the figure should be read as a range rather than a point.
Business hotels were at 100.0% at the 45-day observation — a different “cut-off” by category
The prefecture-wide figures are pulled strongly by business hotels, which account for more than 60% of room supply (4,215 of 6,319 rooms). Looking at those business hotels on their own (N=61 properties), the opening dance-stage day of August 12 was already at an estimated OCC of 100.0% and a sold-out property rate of 100.0% at the 45-day cross-section (stay date August 12, 2026). It was 100.0% at 30 days out and 100.0% at the latest reading (14 days out) as well — nothing observable changes within 45 days. August 13 moved from 99.9% at 45 days out to 100.0% at the latest reading (15 days out), and August 14 from 99.7% to 99.9% (16 days out). Every one of them is pinned to the ceiling.
On the other hand, the same business hotels are actually weaker than the prefecture as a whole on normal weekends. August 22 went from 49.3% at 45 days out to 55.8% at the latest reading (24 days out), and August 29 from 52.6% to 58.3% (31 days out). The sold-out property rate also stays low, at 6.8% → 13.6% for August 29. In short, Tokushima’s business hotels have a high-amplitude demand structure: they hit the ceiling earliest during the dance-stage period and are the loosest on normal weekends. The same rooms in the same building swing between “full at 45 days out” and “half empty at 30 days out” within the space of two weeks.
Source: MetroEngines Research; compiled by the HotelBank Editorial Team
| Stay date (business hotels) | 45 days out | 30 days out | Latest observation | 45 days out → latest | Sold-out property rate 45 days out → latest |
|---|---|---|---|---|---|
| Tue Aug 11 (holiday) | 96.4% | 97.2% | 96.3% (13 days out) | −0.1pt | 70.5% → 77.0% |
| Wed Aug 12 | 100.0% | 100.0% | 100.0% (14 days out) | ±0.0pt | 100.0% → 96.7% |
| Thu Aug 13 | 99.9% | 99.6% | 100.0% (15 days out) | +0.1pt | 95.1% → 100.0% |
| Fri Aug 14 | 99.7% | 99.9% | 99.9% (16 days out) | +0.2pt | 88.5% → 96.7% |
| Sat Aug 15 | 98.6% | 97.7% | 98.2% (17 days out) | −0.4pt | 80.3% → 75.4% |
| Sun Aug 16 | 70.3% | 74.4% | 75.2% (18 days out) | +4.9pt | 19.7% → 19.7% |
| Sat Aug 22 | 49.3% | 55.1% | 55.8% (24 days out) | +6.5pt | 14.8% → 14.8% |
| Sat Aug 29 | 52.6% | — (not yet reached) | 58.3% (31 days out) | +5.7pt | 6.8% → 13.6% |
Tokushima, business hotels, N=59–61 properties. Estimated OCC (based on OTA-listed inventory). Source: MetroEngines Research; compiled by the HotelBank Editorial Team
Note that what this article can observe runs from 45 days before the stay date to the most recent reading; when the rooms actually filled before that point is outside its scope. All that can be said here is the fact that they were already full at 45 days out. In practice, however, that is enough: for a date that stood at 100.0% at 45 days out, what remains possible in the final stretch is neither pricing nor inventory release, but only how returned inventory is handled. As for how the pickup between 45 days out and the final days splits by category, our analysis of Tokyo’s booking curves found three distinct patterns, with gains of +25.7pt for business hotels, +14.5pt for city hotels, and +1.9pt for capsule hotels.
The side that does not fill — 74.8% the day after closing, and normal weekends in the low 60s
The other issue lies outside the dance-stage period. Sunday, August 16 was at 74.8% in the latest reading (18 days out) and 73.3% at 30 days out. Comparing like-for-like across the latest cross-sections, where all property types are observed at 145 properties, that is 21–25pt below the four dance-stage days (95.9–99.5%). Yet it is roughly 10pt above the normal weekends of August 22 (65.2%) and August 29 (64.3%), placing it within reach of residual festival demand. For business hotels alone, August 16 was at 75.2%, 19.4pt above the 55.8% of August 22. One caveat: the 45-day figures for August 16 shown in Tables 1 and 2 (69.5% for all property types, 70.3% for business hotels) rest on only 3 properties for all property types and 2 for business hotels that could actually be observed with inventory on that day, with the remainder carried forward from the latest observed values. They should not be treated as figures comparable side by side with the 45-day readings for other stay dates. When considering consecutive-night stays or steering demand into the following day, this is the first date to look at. Extending length of stay through a cross-prefecture circuit that pairs Awaodori with another major Shikoku festival is another angle worth considering.
To get a sense of the normal weekend level, grouping the daily actuals for Tokushima (all property types) in the elapsed month of July 2026 by day of week gives a monthly average of 83.8% (30 days, N=up to 146 properties), with Saturday highest at 90.5% and Sunday lowest at 77.2%. August 22 and August 29 are still cross-sections in progress and their levels cannot be compared directly with confirmed July actuals, but the July figures serve as a baseline for the shape Tokushima Saturdays normally build toward.
| Day of week (July 2026, elapsed-month actuals) | Average estimated OCC | Days |
|---|---|---|
| Saturday | 90.5% | 4 |
| Thursday | 86.3% | 5 |
| Wednesday | 84.6% | 5 |
| Tuesday | 84.2% | 4 |
| Friday | 83.2% | 4 |
| Monday | 79.8% | 4 |
| Sunday | 77.2% | 4 |
Tokushima, all property types, July 2026 (30 days, N=up to 146 properties). Source: MetroEngines Research; compiled by the HotelBank Editorial Team
A yardstick for rate — Tokushima’s estimated settled ADR peaks in August
Alongside the inventory picture, the monthly estimated settled ADR is worth holding in view. For Tokushima’s business hotels, August was the highest of the twelve confirmed months of 2025 at ¥6,700 (N=74 properties). With the other months generally landing in the ¥5,100–¥5,800 range, August alone sits a step higher. City hotels (N=10 properties) likewise peaked in August 2025 at ¥9,700, the highest of the year. Tokushima’s annual rate curve has a single peak, in August.
Comparing the most recent confirmed months against the same month a year earlier, business hotels came in at ¥5,500 in June 2026 (N=74 properties), up 1.5% YoY. Growth had been running in the +11–14% range early in the year (+11.1% in January, +14.3% in February, +11.8% in March), but has since settled down to +2.4% in April, +1.2% in May and +1.5% in June. City hotels were at ¥7,300 in June 2026 (N=10 properties), down 4.0% YoY — below the prior year on a confirmed-month basis.
For August 2026, business hotels are at ¥10,100 (N=69 properties) and city hotels at ¥11,900 (N=10 properties) on an estimate based on current sales conditions. These are not confirmed figures but estimates based on where sales stand today, so a straight comparison against confirmed values must wait for month-end confirmation. The price premium during the Awaodori period itself, which this article does not cover, is examined separately in Awaodori 2026 (Aug 11-15) Hotel Demand — Tokushima ADR +56.5% Premium Analysis.
Source: MetroEngines Research; compiled by the HotelBank Editorial Team
For revenue managers running business and city hotels in Tokushima — implications and an action plan
(1) The four dance-stage days are not days to adjust at the last minute. The prefecture-wide curve of 98.8% at 45 days out to 99.3% at the latest reading (+0.5pt), and the 100.0% cross-section for business hotels at 45 days out, show that almost no room is left to move things with price or inventory in the final stretch. When reviewing your own results for the four dance-stage days, the question to ask is not “what did we sell it for at the last minute” but “at what rate bands and channel mix did we clear our inventory before the 45-day mark.” That is where next year’s design is decided.
(2) A flat curve does not mean inventory is standing still. The sold-out property rate for August 15 fell 4.7pt, from 68.0% at 45 days out to 63.3% at the latest reading, and for business hotels on August 12 it moved from 100.0% to 96.7% — properties holding inventory reappear in the latest cross-section (in both cases the change includes the increase in properties actually observed, so the magnitude should be read as a range). The closer a date is to the ceiling, the more the work in the final stretch shifts to how quickly returned cancellations can be put back on sale. Leave returned inventory unattended and you will be the only property sitting on empty rooms on a date when the market is running at 98–100%.
(3) The drop-off on adjacent dates is the biggest headroom. August 16 is at 74.8% in the latest reading (75.2% for business hotels), 21–25pt below the four dance-stage days when comparing latest cross-sections where observation is complete. At the same time it is roughly 10pt above the normal weekend of August 22 (65.2%), so demand has not cut off entirely. If you are going to propose consecutive nights or an extended stay, the August 15 → August 16 bridge is the most realistic candidate to start with.
(4) Normal weekends are demand that is still undecided. August 22 moved from 59.4% at 45 days out to 65.2% at the latest reading (+5.8pt) and August 29 from 60.2% to 64.3% (+4.1pt) — accumulation continues even inside 45 days. For business hotels alone the levels are lower still, at 55.8% for August 22 and 58.3% for August 29. Given that July’s elapsed-month actuals show Tokushima Saturdays building to an average of 90.5%, there is room to expect further pickup on the late-August Saturdays over the remaining period.
| Time horizon | Lever | Decision trigger (figures from this article) | Objective |
|---|---|---|---|
| Today – this week | Set a fixed daily time to check returned inventory for the four dance-stage days and establish a routine for putting it back on sale the same day | The market is at 99.3% for Aug 12 in the latest reading, and 100.0% for business hotels. The sold-out property rate for Aug 15 went from 68.0% at 45 days out to 63.3% at the latest reading, so properties holding inventory are appearing in the latest cross-section | Avoid being the only property with empty rooms on ceiling-level dates |
| Today – this week | Prepare an extended-stay offer for Aug 16 aimed at guests already booked for the night of Aug 15 | Comparing latest cross-sections, Aug 16 is at 74.8% (75.2% for business hotels) against 95.9% for Aug 15 — a gap of 21.1pt | Fill the vacancy on the day after closing with residual festival demand |
| Within two weeks | Benchmark your own pickup for Aug 22 and Aug 29 against the market curve, and if you are behind, revisit the promotional mix for the remaining period | The market moved from 59.4% at 45 days out to 65.2% at the latest reading for Aug 22 (+5.8pt), and from 60.2% to 64.3% for Aug 29 (+4.1pt) | Avoid leaving demand that is still moving on the table |
| Within two weeks | Cross-check your own average August rate settings against the market level | For Tokushima in August 2026, business hotels are at a current estimate of ¥10,100 (N=69 properties) and city hotels at ¥11,900 (N=10 properties) | Avoid leaving money on the table in the peak month of the year |
| Looking to next year | Build an internal calendar that moves rate revisions and inventory-release decisions for the dance-stage period to before the 45-day mark | The gain from 45 days out to the latest reading is only +0.5pt for Aug 12 and +0.6pt for Aug 15 | Align the decision point with when selling actually happens |
| Looking to next year | Set out overbooking tolerance and walk procedures separately for the four dance-stage days | For Aug 12 the prefecture’s sold-out property rate is 89.8% in the latest reading and 96.7% for business hotels, so nearby relocation options are limited | Draw the operational risk line for full-house dates in advance |
Source: MetroEngines Research; compiled by the HotelBank Editorial Team
Summary — three yardsticks for reading a one-off large-scale event
Yardstick 1: the level at 45 days out. 98.8% for August 12; 100.0% for business hotels. On dates where this reading is high, the market moves only +0.5 to +0.6pt over the following 45 days. The 45-day cross-section should be read not as “progress” but as “outcome.”
Yardstick 2: the gain from 45 days out to the latest reading. +0.5 to +1.2pt for the four dance-stage days, +4.1 to +5.8pt for the normal weekends, and +5.3pt for the day after closing. The wider this band, the more room there is for final-stretch levers to affect the result. Line your own daily pickup up against this band and you can pick out which dates are worth working on.
Yardstick 3: the gap between the sold-out property rate and OCC. The difference between August 12 and August 22 is 39.4pt on OCC and 58.7pt on the sold-out property rate. The sold-out rate spreads wider because on peak demand dates the properties holding inventory disappear altogether — which makes it a usable indicator of how scarce relocation options are and how valuable returned inventory becomes.
About the data
| Definition of estimated OCC | Occupancy based on OTA-listed inventory = 100 − 100 × rooms still listed on OTAs ÷ total rooms. It is an estimate based on how listed inventory is being taken up on OTAs, and is defined differently from actual room occupancy (it runs higher). This article labels it “estimated OCC (based on OTA-listed inventory).” Scope: July 2026 (elapsed-month actuals) and each stay date in August 2026. |
| Booking curve | Based on observations from 45 days before the stay date through the most recent reading. |
| Sold-out property rate | The share of properties (estimated) for which no listed inventory can be confirmed on OTAs or similar channels for the stay date in question. |
| Definition of estimated settled ADR | The transaction price level (excluding tax) inferred from OTA and other sales data (lowest-plan level × category-specific coefficients, ensembled across multiple channels). Past months are confirmed values; the current and future months are estimates based on where sales stand today. Median error of 6.6% when reconciled against publicly disclosed operating results. |
| Breakdown of N | Tokushima, all property types N=146–148 properties (varies by stay date; Aug 12 is 147 properties, 6,319 total rooms) / business hotels N=59–61 properties (Aug 12 is 61 properties, 4,215 rooms). For estimated settled ADR, business hotels N=69–76 properties and city hotels N=10 properties (varies by month). |
| Observed property count (actual observations and carry-forward) | Each cross-section of the booking curve is made up of properties whose inventory could actually be observed on that day (actual observed N) plus properties whose most recent observed value was carried forward. Actual observed N varies substantially by cross-section. For all property types, the 45-day cross-section covers 65 properties for Aug 12, 68 for Aug 15, 121 for Aug 22 and 123 for Aug 29 — but only 3 properties for Aug 16. For business hotels, the 45-day cross-section covers 18 properties for Aug 12, 25 for Aug 15 and 56 for Aug 22 — but only 2 properties for Aug 16. In the latest cross-section, by contrast, around 145 properties for all property types and 61 business hotels are actually observed for every stay date. Cross-sections with a small actual observed N (particularly the 45-day reading for Aug 16) rely heavily on carry-forward and are not treated as independent measurements. Where this article compares across stay dates, the latest cross-sections, where actual observed N is aligned, are used as the basis. |
| Data as of | Data as of July 30, 2026. Sales conditions and inventory change daily, so the figures in this article are a snapshot taken at that point. |
References and sources
・The Awaodori, “2026 Event Schedule” (confirming the August 11, 2026 Takumi no Butai Masaribi performance and the August 12–15 schedule for the paid and free dance stages)
・Tokushima City official website, “2026 Awaodori Advance Ticket Sales”