

When the industry talks about hotel operating costs, the debate has focused almost entirely on unit prices: how much per room to outsource cleaning, the energy charge per kWh, the volumetric water and sewer rate. But cost is unit price × frequency, and frequency is set by the demand structure itself: how many nights each guest stays. At the same 100 rooms and the same occupancy, a market averaging 1.2 nights per stay and one averaging 1.9 nights differ by close to 50% in the number of checkout cleans they generate each year. This article translates that “volume variable” into an operating-cost line item.
HotelBank’s cost-structure series has so far dealt with regional differences in unit prices: the 2.1x gap in water and sewer costs between municipalities, the impact of the 2026 electricity price increase, the per-room burden of fixed asset tax, the surge in outsourced room-cleaning rates, and ADR increases driven by labor-cost pass-through. This article is not about unit prices. It is about turnover — how many nights pass before one checkout clean is triggered. And whereas our earlier analysis of serviced apartment investment economics looked at long-stay assets as such, this article looks at differences in average length of stay across ordinary existing hotels. Previous articles on multi-night stays were written for travelers; this one is written for investors and asset managers.
Metric Definitions Used in This Article
- Average length of stay (LOS): total guest-nights ÷ number of guests. Nights per guest as defined in the Japan Tourism Agency’s Overnight Travel Statistics Survey. Figures for Japanese and foreign guests are derived by subtracting foreign guest-nights and foreign guests from the totals.
- ADR (average daily rate): an estimated transacted rate (tax-excluded equivalent), calculated by applying segment-specific adjustment factors to each property’s lowest publicly listed OTA plan (per room, 2 guests, tax included). Checked against property-level results disclosed by listed hotel REITs (91 properties, most recent 3 months), the median error is about 7%. These are estimates and differ from each property’s actual transacted prices and accounting figures. Area-level ADR is the median of the properties covered (the level of a typical property in the area).
- OCC (occupancy): rooms sold as a share of total rooms in the area (an estimate based on OTA sales inventory; consistency checks against REIT monthly disclosures confirm accuracy within a few points). The 80% used in this article’s model is a model assumption, not a measured value.
- Checkout clean / light clean: the former is a full clean after departure (bed making, full bathroom cleaning, amenity restocking, trash removal); the latter is a partial clean during a multi-night stay (trash removal, towel change, light tidying).
- Data sources: Japan Tourism Agency, Overnight Travel Statistics Survey (2025 annual figures, final; June 2026, second preliminary); MetroEngines Research & Consulting
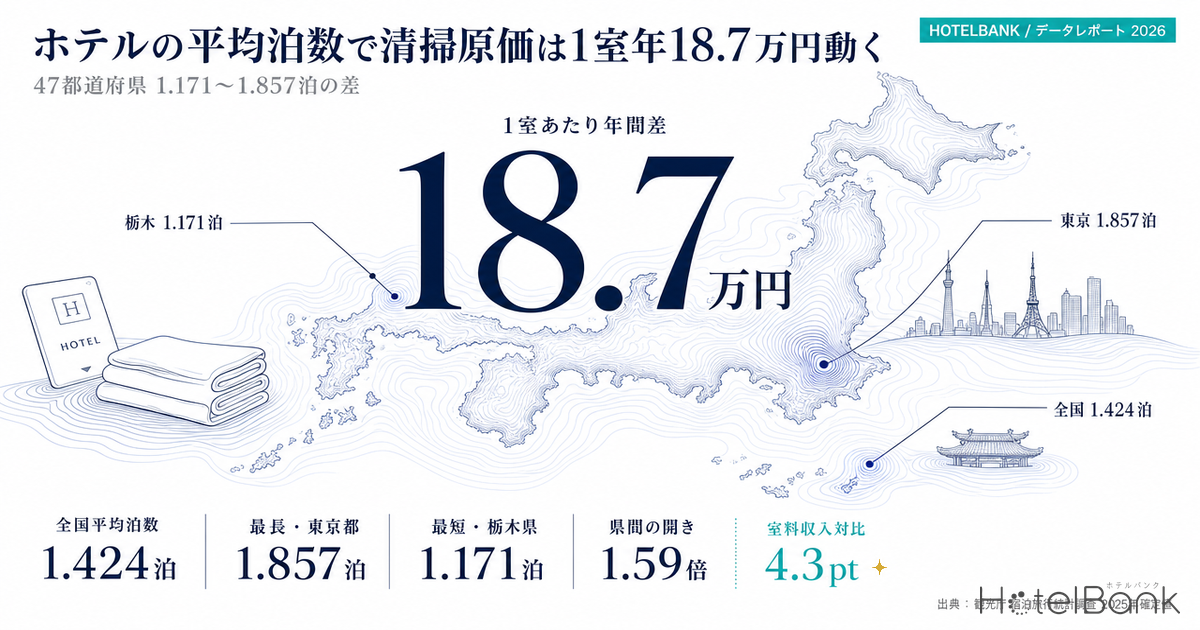
- — Average length of stay across the 47 prefectures ranges from 1.171 nights (Tochigi) to 1.857 nights (Tokyo), a 1.59x spread. The national figure is 1.424 nights (2025 annual, final).
- — In the same model (100 rooms, 80% occupancy year-round as a model assumption), the housekeeping cost gap between an average stay of 1.3 and 2.2 nights is ¥187k per room per year, equal to 4.3pt of model room revenue.
- — The gap widens as outsourced cleaning rates rise. At ¥2,400 (+20%), the difference between 1.3 and 2.2 nights grows to ¥213k.
- — What is lifting LOS is not longer stays but guest mix. Foreign guests stay 1.806 nights and Japanese guests 1.320, and the foreign share of guest-nights rose from 25.0% to 27.2%.
- — The easily overlooked group is the 14 prefectures with long stays and below-median rates (Osaka, Aichi, Miyagi and others). They carry a cost-side advantage of ¥10k–60k per room per year, and offer the most room to reflect it in acquisition cost assumptions.
Average Stay Ranges from 1.171 to 1.857 Nights — a 1.59x Spread Across 47 Prefectures
We calculated average length of stay by prefecture by dividing total guest-nights by the number of guests, using the Japan Tourism Agency’s Overnight Travel Statistics Survey 2025 annual figures (final, published July 6, 2026). The national figure is 1.424 nights. Tokyo is longest at 1.857 nights and Tochigi shortest at 1.171 nights, a 1.59x spread. The median is 1.286 nights: the top three (Tokyo, Okinawa, Kyoto) clearly stand apart, while the remaining 44 prefectures sit in a 1.17–1.49 night band.
The shape of this distribution matters. Average length of stay is not normally distributed; it splits into a small number of long-stay markets and a large number of “essentially one-night” markets. Of the 661.11 million guest-nights nationwide, the markets averaging more than 1.5 nights (Tokyo, Okinawa, Kyoto) account for 174.92 million, just 26.5% of the total. Put the other way, roughly three-quarters of Japan’s lodging market effectively runs on a one-night turnover cycle.
Mapped, the long-stay markets are clearly concentrated in “international gateways” and “islands and resorts.” Tokyo, Kyoto and Osaka accumulate nights as bases for inbound visitors, while Okinawa does so because high travel costs make each trip longer. Conversely, prefectures with hot-spring destinations in northern Kanto, Tokai and Hokuriku are stuck at around 1.2 nights, since the one-night-with-two-meals format dominates.
Guest Mix Holds Up Length of Stay — Japanese 1.320 Nights, Foreign 1.806 Nights
Breaking the national average down by place of residence makes the structure clear. In 2025, Japanese guests averaged 1.320 nights and foreign guests 1.806 nights — a gap of 0.486 nights, or 1.37x. Compared with the previous year (2024), foreign guests edged up from 1.794 to 1.806 nights while Japanese guests edged down from 1.338 to 1.320 nights. The overall figure landed essentially flat, from 1.429 to 1.424 nights.
In other words, the main force holding up the national average is not longer stays within each segment but a rising share of foreign guests, who stay longer. The foreign share of guest-nights rose 2.2pt, from 25.0% in 2024 to 27.2% in 2025, and this mix shift almost exactly offset the shortening of Japanese stays. For investment decisions, note that the cost outlook changes depending on whether average stay is treated as a “permanent characteristic of the market” or as “a variable linked to the inbound share.” How far inbound LOS diverges by prefecture is broken down in Inbound Stay Length Varies 2.0x by Prefecture, down to Tokyo at 2.32 nights and Yamanashi at 1.16.
That said, it would be too simple to read “a higher foreign share means longer stays.” Across the 47 prefectures, the correlation between the foreign share of guest-nights and average LOS is +0.675 — a positive relationship in direction, but with clear outliers. Yamanashi has a foreign share of 27.7%, sixth-highest in Japan, yet its average stay of 1.195 nights is fourth from the bottom, because inbound visitors to the Fuji Five Lakes and Lake Kawaguchi area make near-day-trip one-night loops from Tokyo. Conversely, Kagoshima has a low foreign share of 8.4% but ranks sixth with an average of 1.458 nights, as touring within the prefecture, including its outlying islands, extends stays.
Okinawa is similar. Its foreign share of 27.2% is in line with the national average, but its average stay of 1.792 nights ranks second. Even Japanese guests alone stay 1.729 nights there, more than 0.4 nights above the national Japanese average of 1.320. Length of stay is determined not by the presence of inbound visitors but by travel costs and itinerary design. When using average LOS in investment decisions, treat it not as a proxy for the inbound ratio but as a reflection of each market’s own itinerary structure.
By Property Type: Ryokan 1.196 Nights, City Hotels 1.627 — Turnover Mirrors Product Design
Looking at average LOS by accommodation type reveals an axis separate from regional differences. In the 2025 national figures, ryokan are shortest at 1.196 nights, followed by resort hotels at 1.320, business hotels at 1.443, simple lodgings (hostels and guesthouses) at 1.548, and city hotels at 1.627. The gap between ryokan and city hotels is 0.431 nights, or 1.36x.
Ryokan stays are short because of the product structure itself, which is designed around one night with two meals, including the menu and in-house guest flow. If the same menu is not served on consecutive nights, the trip completes in one night, and in exchange the ryokan can capture a higher rate and more ancillary revenue per night. High turnover is thus a consequence of product design and the flip side of the ryokan asset’s strength. City hotels, by contrast, are built around room-only or breakfast-included stays and have no in-house menu to rotate, so they accommodate multi-night stays more easily. The foreign share of guest-nights also stands out at 47.2% for city hotels, followed by business hotels at 25.6%, resort hotels at 18.3% and ryokan at 12.9%. Which direction the inbound share is moving by property type is tracked with the latest monthly figures in City Hotels: 45.9% of Guest Nights Are Foreign.
The practical implication of this difference is clear. The higher a property type’s turnover, the larger the annual return on efficiency investments per clean (work standardization, cleaning-support systems, better linen transport routes). Ryokan generate the most cleans per room per year of any type, putting them in the position to recoup the same efficiency measures fastest.
Building Up the 100-Room Model — ¥187k per Room a Year Between 1.3 and 2.2 Nights
We now translate this demand structure into operating-cost line items. The base case is a lodging-focused hotel with 100 rooms and 80% occupancy (year-round, model assumption). Annual rooms sold are fixed at 29,200 room-nights, and only average LOS is varied across three levels: 1.3, 1.6 and 2.2 nights. Because occupancy, room count and ADR are all held constant, any resulting difference is purely due to turnover.
The three levels are grounded in actual data. 1.3 nights is almost exactly the national Japanese average of 1.320 and represents a regional-city market centered on business demand. 1.6 nights corresponds to the national city-hotel figure of 1.627 and represents an urban mixed-demand market. 2.2 nights sits between Tokyo city hotels at 2.10 nights and Tokyo’s foreign-guest average of 2.317, representing an inbound base market. All three are observed, real-world levels.
| Assumption | Value | Basis / source |
|---|---|---|
| Rooms | 100 rooms | Model assumption |
| Occupancy (OCC) | 80.0% | Model assumption (conservative setting with reference to listed hotel REITs’ monthly disclosures) |
| Annual rooms sold | 29,200 room-nights | 100 rooms × 80% × 365 days |
| Average LOS (3 levels) | 1.3 / 1.6 / 2.2 nights | Corresponds to actual levels in the Japan Tourism Agency’s Overnight Travel Statistics Survey, 2025 final |
| Checkout cleans | Rooms sold ÷ average LOS | One departure clean per stay |
| Stayover nights | Rooms sold − checkout cleans | Same as above |
| Checkout clean rate | ¥2,000 / room | Lower-middle of the ¥1,500–3,500 per room range in published industry sources; consistent with the midpoint of the ¥1,800 (regional) to ¥2,200 (Greater Tokyo) used in our earlier articles |
| Light clean rate | ¥800 / room (40% of checkout clean) | Workload ratio reflecting no bed making, full bathroom clean or full amenity restock. Model assumption |
| Light clean take-up | 70.0% | Model assumption with 30% of stayover guests declining cleaning (eco plans, etc.) |
| Linen supply (checkout) | ¥700 / room | Level per single room at a business hotel in published industry sources |
| Linen supply (stayover) | ¥150 / room | Assumes towels only are changed (face ¥20–30, bath ¥35–50, hand towel etc. combined). Model assumption |
| Model ADR (tax-excluded equivalent) | ¥15,000 | Rounded from ¥14,300, the estimated transacted ADR for Tokyo business hotels over the latest 12 months (July 2025–June 2026, N=905 properties, median) |
Building up costs on these assumptions, annual housekeeping cost per room (outsourced room cleaning + linen supply) comes to ¥651k at an average stay of 1.3 nights, ¥566k at 1.6 nights and ¥464k at 2.2 nights. The gap between 1.3 and 2.2 nights is ¥187k. For 100 rooms, that is ¥18.7M a year, equivalent to 4.3pt of the model’s ¥438M in room revenue. Per occupied room-night, the figures are ¥2,200, ¥1,900 and ¥1,600.
The cost breakdown shows where the gap arises. At 1.3 nights, 22,462 checkout cleans occur each year, with outsourced cleaning alone costing ¥44.92M. At 2.2 nights, checkout cleans fall to 13,273 and outsourced cleaning drops to ¥26.55M. Stayover nights rise from 6,738 to 15,927, so light-clean costs increase from ¥3.77M to ¥8.92M — but because the light-clean rate is 40% of a checkout clean, the increase comes nowhere near offsetting the decrease. Linen supply moves in the same direction: full linen changes at checkout fall from ¥15.72M to ¥9.29M, while stayover towel changes rise only from ¥0.71M to ¥1.67M.
As a sensitivity analysis, we vary the outsourced cleaning rate by ±20% (¥1,600, ¥2,000, ¥2,400). The higher the rate, the larger the absolute cost advantage of longer stays. At ¥1,600 the gap between 1.3 and 2.2 nights is ¥161k; at ¥2,400 it widens to ¥213k. When outsourced cleaning rates are rising, the relative advantage of owning assets in long-stay markets grows stronger.
| Outsourced cleaning rate | LOS 1.3 nights | LOS 1.6 nights | LOS 2.2 nights | 1.3 − 2.2 nights |
|---|---|---|---|---|
| ¥1,600 (−20%) | ¥554k (12.7%) | ¥480k (11.0%) | ¥393k (9.0%) | ¥161k / 3.7pt |
| ¥2,000 (base) | ¥651k (14.9%) | ¥566k (12.9%) | ¥464k (10.6%) | ¥187k / 4.3pt |
| ¥2,400 (+20%) | ¥749k (17.1%) | ¥651k (14.9%) | ¥535k (12.2%) | ¥213k / 4.9pt |
Feeding actual prefectural data into the same model allows a more direct comparison. Tokyo, at 1.857 nights, comes to ¥514k per room per year; Tochigi, at 1.171 nights, to ¥702k. The gap of ¥187k is almost the same as in the three-level model comparison. The national median of 1.286 nights sits at ¥656k, and the distribution is heavy at the lower end.
| Prefecture | Average LOS | Japanese | Foreign | Foreign share | Annual cost per room | vs. national median |
|---|---|---|---|---|---|---|
| Tokyo | 1.857 | 1.485 | 2.317 | 55.7% | ¥514k | −¥142k |
| Okinawa | 1.792 | 1.729 | 1.984 | 27.2% | ¥526k | −¥130k |
| Kyoto | 1.727 | 1.430 | 2.078 | 55.2% | ¥538k | −¥118k |
| Osaka | 1.485 | 1.352 | 1.721 | 41.7% | ¥594k | −¥62k |
| Hokkaido | 1.469 | 1.413 | 1.632 | 28.6% | ¥599k | −¥57k |
| Kagoshima | 1.458 | 1.444 | 1.623 | 8.4% | ¥602k | −¥54k |
| Fukuoka | 1.366 | 1.266 | 1.628 | 33.0% | ¥629k | −¥27k |
| Aichi | 1.339 | 1.282 | 1.599 | 21.4% | ¥638k | −¥18k |
| National median | 1.286 | — | — | — | ¥656k | — |
| Kanagawa | 1.257 | 1.223 | 1.430 | 18.4% | ¥667k | +¥11k |
| Shizuoka | 1.224 | 1.223 | 1.233 | 9.9% | ¥680k | +¥24k |
| Yamanashi | 1.195 | 1.210 | 1.155 | 27.7% | ¥692k | +¥36k |
| Tochigi | 1.171 | 1.163 | 1.384 | 4.3% | ¥702k | +¥46k |
Positioning — Re-sorting Markets into Four Quadrants of Length of Stay × Rate
To put this in a form investors can actually use, we plotted the 47 prefectures with average LOS (2025 final) on the horizontal axis and estimated transacted ADR (June 2026) on the vertical axis. The dividing lines on both axes are the medians: 1.286 nights and an estimated transacted ADR of ¥8,400. Bubble size represents guest-nights.
The upper-right “long stay × high rate” quadrant contains 10 prefectures: Tokyo, Okinawa, Kyoto, Hokkaido, Fukuoka, Ishikawa, Nagano, Niigata, Chiba and Saga. These markets hold a double advantage, favorable on both rate and turnover. The lower-left “short stay × below-median rate” quadrant contains 9 prefectures. Here the turnover burden is relatively heavy — which also means these are the markets where the same measures, such as cleaning efficiency or better linen routes, pay back fastest each year.
What is easily overlooked in practice is the lower right: the 14 prefectures with “long stay × below-median rate,” including Osaka, Aichi, Miyagi, Okayama, Kagoshima, Ibaraki and Aomori. Judged by headline ADR alone they look unremarkable, but because their average stay is above the median, their housekeeping cost is ¥10k–60k lighter per room per year. If this is not reflected in cost assumptions when building the expected NOI at acquisition, the asset ends up being valued on numbers more conservative than reality. Conversely, in the 14 upper-left “short stay × high rate” prefectures, high rates absorb the turnover burden, so maintaining rate is synonymous with maintaining the capacity to absorb costs.
Upper right Long stay × high rate
10 prefectures / Tokyo, Okinawa, Kyoto and others
A double advantage where both rate and turnover work in the owner’s favor. Even when outsourced cleaning rates rise, absolute costs stay structurally light.
Lower right Long stay × below-median rate
14 prefectures / Osaka, Aichi, Miyagi and others
Headline rates are middling, but lighter turnover gives a cost-side advantage of ¥10k–60k per room per year. The most room to revisit cost assumptions at acquisition.
Lower left Short stay × below-median rate
9 prefectures / Hiroshima, Ehime, Wakayama and others
The turnover burden is relatively heavy. The same efficiency investment pays back fastest here, and returns on cleaning-support systems and better linen routes are easiest to maximize.
Reflecting It in Investment Decisions — Add One Line to the Due Diligence Assumptions
That this article’s model assumptions are not overly aggressive can be confirmed against listed hotel REITs’ published results. Invincible Investment Corporation’s July 2026 operating results for its 101 domestic hotels were occupancy of 86.3%, ADR of ¥15,100 and RevPAR of ¥13,039 (year on year: occupancy +1.9pt, ADR −1.0%, RevPAR +1.2%). This article’s model uses 80% occupancy (year-round, model assumption) and ADR of ¥15,000, both below those levels.
There are three steps to putting this into practice. First, at the acquisition due diligence stage, add one line to the assumptions table for the average LOS of the market where the target property is located. The Japan Tourism Agency’s prefectural data is free, and quarterly updates are sufficient. Second, hold cost benchmarks for the existing portfolio broken down not as absolute amounts but “per checkout clean” and “per stayover night.” Even at the same annual cost per room, the room for rate negotiation is entirely different when turnover differs. Third, in the design of outsourced cleaning contracts, specify separate rates for checkout cleans and light cleans. In markets where the share of multi-night stays is rising, this two-rate contract is the mechanism that turns the cost advantage into actual numbers.
The same perspective applies to regional banks’ business-viability assessments. When two properties with the same room count and occupancy are compared, a 0.5-night difference in their markets’ average LOS means a housekeeping cost gap of around ¥100k per room per year — about ¥10M a year for 100 rooms. That is not a gap that can be ignored when projecting debt-service capacity.
| Caveat | Details | Practical response |
|---|---|---|
| Statistical population | The Japan Tourism Agency’s average LOS covers all accommodation types in each prefecture. In prefectures with a high share of ryokan, the overall figure comes out shorter than the actual hotel market | Use together with figures by accommodation type (Tables 4 and 5) and adjust to the target asset’s property type |
| Guest basis vs room basis | Average LOS is guest-nights ÷ guests, a guest-based metric. Assuming companions share a room it approximates room-based length of stay, but not exactly | Where the target property’s actual data is available, verify against room-based length of stay |
| Release stage | Figures are revised between the first preliminary, second preliminary and final releases. Annual figures are finalized around July of the following year | Align release stages in time-series comparisons. This article labels 2025 as final and June 2026 as second preliminary |
| Operational differences in light cleaning | Stayover cleaning frequency and opt-out rates vary widely with each property’s policy. This article assumes 70% take-up | Replace take-up and rates with your own actuals and recalculate. The structure of the sensitivity table can be reused as is |
| Oversimplified causation | Prefectural differences in average LOS cannot be explained by the inbound ratio alone. Yamanashi stays 1.195 nights despite a 27.7% foreign share; Kagoshima 1.458 nights despite 8.4% | Read together with travel costs, itinerary design and property-type mix. Avoid evaluating markets on a single metric |
| Shifts in demand structure | Average LOS may move with changes in the inbound share. June 2026 was a month in which foreign guest-nights fell year on year | Use a conservative average LOS in cost assumptions and treat longer stays as upside |
Conclusion — Put the “Volume Variable” into the Assumptions Table
This article has shown that average length of stay, a demand-structure metric, translates directly into an accounting line item: operating cost. Average LOS across the 47 prefectures ranges from 1.171 to 1.857 nights, a 1.59x spread. Fed into the same model of 100 rooms and 80% occupancy (year-round, model assumption), it produces a gap of ¥187k per room per year in combined outsourced room cleaning and linen supply costs, or 4.3pt of model room revenue. The higher the outsourced cleaning rate, the larger this gap in absolute terms.
The practical meaning comes down to this: long-stay markets have a built-in factor pushing operating costs down. Because it does not show up in headline ADR or RevPAR, it is easily missed at the acquisition stage — which is exactly why it can be a differentiator when properties with the same headline yield are compared. On the other side, short-stay markets are where efficiency investments in cleaning pay back fastest each year, a position of their own in which returns from operational improvement are easier to capture. Since there are levers on both sides, this metric is best seen not as ranking markets but as setting the order in which to pull those levers.
The debate on unit prices has matured. The next thing to put into the assumptions table is turnover.
Related Articles
- Hotel Water & Sewer Costs Vary 2.1x by Municipality: ¥7.85mn NOI Gap
- Cleaning Dispatch Rate Surge & Mid-Size Hotel Pressure: 2026 H2 Polarization
- 2026 Electricity Price Surge: Supply-Side Cost Impact Analysis for Hotel Operations
- Inbound Stay Length Varies 2.0x: Tokyo 2.32 vs Yamanashi 1.16 Nights
- City Hotels: 45.9% of Guest Nights Are Foreign — Ryokan +3.7%
- June 2026 Occupancy 56.2%: Guest-Nights per Room in 47 Prefectures
References and Sources
■ Data sources
Japan Tourism Agency, Overnight Travel Statistics Survey: 2025 annual figures (final, published July 6, 2026), Tables 2, 3, 4, 5 and 7; and June 2026 second preliminary figures (published August 31, 2026). Average LOS = total guest-nights ÷ number of guests. Figures for Japanese and foreign guests are derived by subtracting foreign guest-nights and foreign guests from the totals. Estimated transacted ADR is compiled by MetroEngines Research & Consulting (47 prefectures, June 2026, median across all property types, N=47 prefectures). REIT results are from Invincible Investment Corporation, “Monthly Operating Status for July 2026” (101 domestic hotels). Cleaning and linen rate assumptions are based on five published industry sources.
■ Model assumptions
100 rooms, 80% occupancy (year-round, model assumption) and 29,200 annual room-nights sold are held fixed, and only average LOS is varied across three levels: 1.3 / 1.6 / 2.2 nights. Checkout cleans = rooms sold ÷ average LOS; stayover nights = rooms sold − checkout cleans. Rate assumptions: checkout clean ¥2,000/room; light clean ¥800/room (40% of checkout clean, 70% take-up); linen supply ¥700/room at checkout and ¥150/room during stayovers; model ADR ¥15,000 (tax-excluded equivalent). The sensitivity analysis is a 3×3 grid with the outsourced cleaning rate varied by ±20% (¥1,600 / ¥2,000 / ¥2,400).
■ Limitations and caveats
All cost figures in this article are model estimates, not the actual results or accounting figures of any individual property. Average LOS is a guest-based metric (guest-nights ÷ guests) and does not match room-based length of stay. The Japan Tourism Agency’s prefectural figures include all accommodation types, so in prefectures with a high share of ryokan they come out shorter than the actual hotel market. Figures are revised by release stage (first preliminary / second preliminary / final), so release stages must be aligned in time-series comparisons. Estimated transacted ADR is an estimate based on OTA public prices; checked against property-level disclosures by listed hotel REITs (91 properties, most recent 3 months), the median error is about 7%. ADR is a single-month value and includes seasonality. Note that June 2026 was a month in which foreign guest-nights fell year on year, and average LOS can move with changes in the inbound share.
■ Government statistics
- Japan Tourism Agency, Overnight Travel Statistics Survey (宿泊旅行統計調査) — 2025 (Reiwa 7) January–December final annual figures (published July 6, 2026), Tables 2, 3, 4, 5 and 7
- Japan Tourism Agency, Overnight Travel Statistics Survey (宿泊旅行統計調査) — June 2026 (Reiwa 8) second preliminary figures (published August 31, 2026)
- Japan Tourism Agency, Overnight Travel Statistics Survey (宿泊旅行統計調査) — 2024 (Reiwa 6) January–December final annual figures
- Japan Tourism Agency, Past Second Preliminary Figures
■ Market data
- MetroEngines Research & Consulting — estimated transacted ADR (47 prefectures, June 2026, median across all property types); estimated transacted ADR time series for business hotels (July 2025–June 2026, Tokyo and 6 other prefectures)
■ REIT and IR materials
■ Published industry sources (basis for rate assumptions)
- Market rates for outsourcing hotel room cleaning (tokonatsu, in Japanese) — per-room outsourced cleaning rate range
- Is outsourcing hotel cleaning really necessary? Cost ranges and how to choose (ROBOTI, in Japanese) — per-room and hourly rate ranges
- Market rates for outsourced cleaning at lodging facilities (Connector Japan, in Japanese)
- Market rates for linen (Shirofuwabin, in Japanese) — lease rates by item for sheets, pillowcases and towels
- How much do amenities and cleaning cost per hotel room? (ITmedia Business Online, in Japanese) — linen cost levels at business hotels and luxury hotels