

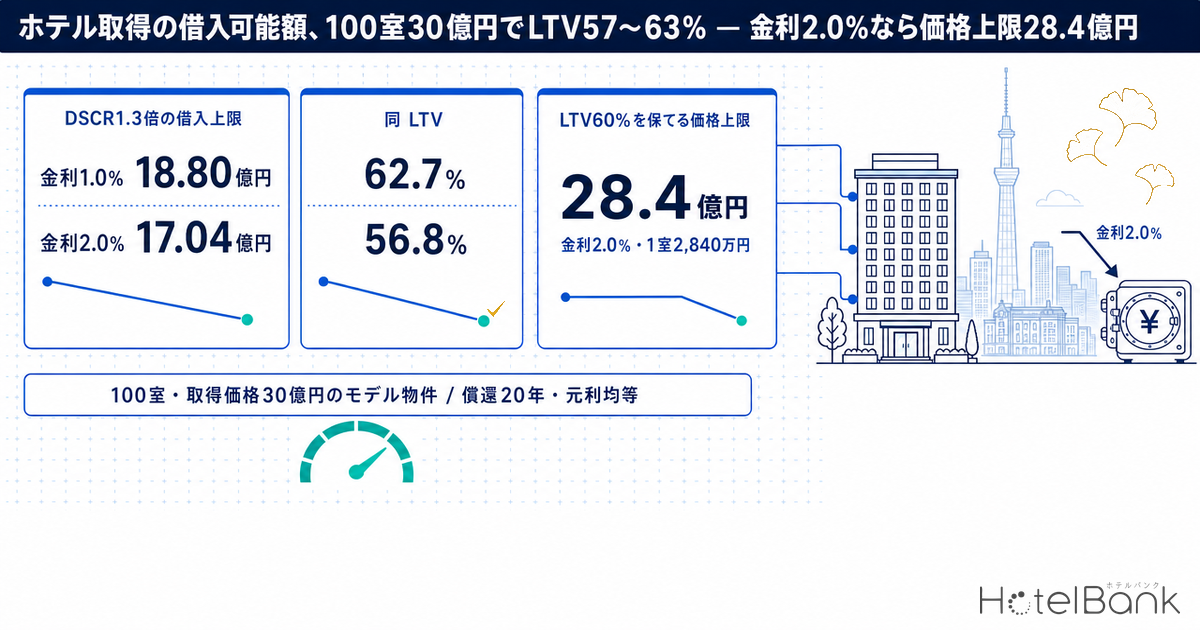
When acquiring a hotel outright, the starting point of any funding plan is the question of how much can be borrowed. Where our earlier article “Policy Rate 1.00%: Break-Even ADR Across Japan’s 8 Hotel Markets” worked forward from the interest rate to the ADR a project needs, this article runs in the opposite direction: it works back from the NOI (net operating income) a property generates to the amount of debt it can carry — its debt capacity. Applying a DSCR (the ratio of NOI to annual principal-and-interest payments) of 1.3x and a 20-year amortization to a model property of 100 rooms acquired for ¥3.0bn, a borrowing rate of 1.0% supports an LTV of 62.7%, and 2.0% supports 56.8%, before repayment capacity is exhausted. Using Bank of Japan lending statistics to locate where the capital is coming from and what it now costs, and the disclosed LTVs of seven listed hotel REITs as a comparison anchor, we set out the combinations of price and LTV that clear in a market that once again has an interest rate attached to it.
Metric Definitions Used in This Article
- ADR (average daily rate): an estimated settled rate (tax-excluded equivalent) calculated by applying a segment-specific adjustment coefficient to the lowest published plan level each property posts on OTAs and similar channels (double occupancy, per-room rate, tax-included). Cross-checked against the property-level results disclosed by listed hotel REITs (91 properties, most recent three months), the median error is approximately 7%. These are estimates and differ from any individual property’s actual transacted rates or accounting figures. Area-level ADR is the median of the properties covered (the level of a typical property in that area). This article uses the monthly figures for the business-hotel segment by prefecture, averaged arithmetically over the 12 months from August 2025 to July 2026.
- OCC (occupancy): sold rooms as a share of total rooms in the area (an estimate based on OTA sales inventory). The 80% used in this article’s model is an assumption (occupancy (assumption)) — neither an estimate nor an actual result.
- NOI (as defined here): GOP (gross operating profit) less management fees, property and other taxes, insurance premiums, and the FF&E (furniture, fixtures and equipment) reserve.
- DSCR: NOI ÷ annual principal-and-interest payments. LTV: loan amount ÷ acquisition price (model calculation). The LTVs of listed REITs follow each investment corporation’s own disclosed definition (total-asset basis, market-value basis, and so on).
- Loan constant: annual principal-and-interest payments ÷ loan amount (level payment, annualized). Debt yield: NOI ÷ loan amount. Required equity: acquisition price − loan amount + acquisition costs.
- Loans outstanding to the accommodation industry: the “accommodations” sector in the Bank of Japan’s Loans and Bills Discounted by Sector. That statistic publishes “eating and drinking services” as a separate series, so the accommodation figures used here do not include food and beverage businesses.
- Average contracted lending rate (new, long-term): the value-weighted average contracted rate on loans of one year or longer newly executed during the month. It covers all industries and is not a rate specific to the accommodation sector.
- Data sources: MetroEngines Research (ADR; of roughly 168,000 properties tracked in Japan, the approximately 27,000 with confirmable operations form the analysis set) / Bank of Japan / IR materials of each investment corporation / Japan Real Estate Institute
Key Takeaways
— Moving from 1.0% to 2.0% cuts the borrowing ceiling from ¥1.880bn to ¥1.704bn. At DSCR 1.3x over a 20-year amortization, LTV shifts 5.9 points, from 62.7% to 56.8%.
— The amortization term matters more. Even at 2.0%, stretching amortization to 25 years lifts LTV to 67.8%. The 20-to-25-year extension is worth +11.0 points — about 1.9 times the effect of one point of interest rate.
— The binding constraint switches at around 1.5%. At 1.0% the 60% LTV cap binds first; at 1.5% and above, DSCR sets the loan amount.
— The price ceiling that holds LTV at 60% is ¥2.84bn at a 2.0% rate (¥28.4mn per room), or ¥3.13bn at 1.0%.
— The seven listed REITs disclose LTVs of 40.8–49.2% on a total-asset basis (Japan Hotel REIT reports a market-value LTV of 34.5%). The denominator and the collateral structure both differ from single-property lending, but these levels anchor the leverage the listed market will bear.
Who is lending — domestic bank credit to accommodation stands at ¥2.585tn, +10.2% on pre-COVID
According to the Bank of Japan’s Loans and Bills Discounted by Sector, loans outstanding to the accommodation industry from domestic banks (banking accounts, trust accounts and overseas branch accounts combined) stood at ¥2.585tn at the end of June 2026. That is +10.2% against end-December 2019 (¥2.3466tn), the last quarter-end before COVID. Within that total, capital-investment lending is ¥1.5804tn, up +15.9% over the same span — faster growth than the aggregate. Capital-investment funds have risen from 58.1% to 61.1% of the balance. Emergency working-capital borrowing swollen during the pandemic has shrunk through repayment, while long-term money directed at building acquisitions and renovations has gained weight — the same structure we broke down by business format in “BOJ 2026: Hotel Lending ¥4.1tn — 61% Capex, Working Capital −25%”.
Two points are worth holding onto when reading the statistic. First, it publishes “accommodations” and “eating and drinking services” as separate series, so the accommodation figures here stand alone and exclude food and beverage. They are not the combined total of the broader “accommodations, eating and drinking services” industry division. Second, borrowers are classified by their principal business. Lending to real estate companies that own hotels, and to the special purpose companies (TMKs and GKs) that borrow under non-recourse loans, is booked under “real estate” and “SPCs for real estate securitization” respectively. The accommodation balance is therefore best read as the scale of money borrowed directly by operating companies and ryokan proprietors themselves.
Set side by side with other sectors, total domestic bank lending grew +31.4% over the same period, real estate +44.7%, and SPCs by a factor of 3.20. Accommodation’s share of total lending fell from 0.457% to 0.383%. The accommodation account is growing at roughly a third of the pace of total lending — but long-term money for hotels is supplied through both the accommodation account and the real estate finance accounts. Non-recourse loans from private funds fall in the latter, corporate lending to operating and management companies in the former; in practice, both need to be tracked.
| Lender type | Sector | End-Dec 2019 | End-Jun 2026 | Change |
|---|---|---|---|---|
| Domestic banks | Total lending | 5,137,127 | 6,750,336 | +31.4% |
| Domestic banks | Real estate | 850,830 | 1,231,038 | +44.7% |
| Domestic banks | SPCs for real estate securitization | 58,344 | 186,865 | 3.20x |
| Domestic banks | Eating and drinking services | 25,891 | 30,735 | +18.7% |
| Domestic banks | Accommodation (balance) | 23,466 | 25,850 | +10.2% |
| Domestic banks | Accommodation (of which capital investment) | 13,638 | 15,804 | +15.9% |
| Domestic banks | Accommodation (of which to SMEs) | 17,048 | 20,059 | +17.7% |
| Shinkin banks | Total lending | 724,666 | 830,412 | +14.6% |
| Shinkin banks | Accommodation (balance) | 6,097 | 6,105 | +0.1% |
| Other financial institutions | Accommodation (balance) | 5,140 | 9,215 | +79.3% |
Cost of funds — the new long-term contracted rate is 1.895%, 2.6 times December 2019
Per the Bank of Japan’s Average Contract Interest Rates on Loans and Discounts, the average contracted rate on long-term loans (one year or more) newly executed by domestic banks in July 2026 was 1.895%. That is 1.161 points above the 0.734% of December 2019 — 2.6 times the level. By lender type: city banks 2.014%, regional banks 1.870%, second-tier regional banks 1.821%, shinkin banks 2.157%. In December 2019 shinkin banks sat 0.825 points above the domestic bank average; by July 2026 that gap had narrowed to 0.262 points. As the spread between local lenders and the major banks compresses, comparing terms deal by deal becomes more practical.
That said, the statistic is a weighted average across all industries and all deals, and does not indicate the rate on any particular hotel transaction. Monthly volatility is considerable: the domestic bank new long-term rate moved from 2.066% in May 2026 to 1.944% in June and 1.895% in July. The 1.0%, 1.5% and 2.0% borrowing rates used in this article’s calculations correspond roughly to mid-2024, late 2025 and the current new long-term average respectively. Meanwhile the long-term average on outstanding loans (the stock) remained at 1.397% in July 2026, 0.498 points below the new-lending rate. The path by which interest expense converges step by step toward new-lending levels at each refinancing is worth keeping in view when reviewing the DSCR of a property already held. The Bank of Japan’s policy rate (the target for the uncollateralized overnight call rate) is around 1.00%.
| Lender type | Dec 2019 | Jul 2024 | Jul 2025 | Jul 2026 | vs Dec 2019 |
|---|---|---|---|---|---|
| Domestic banks | 0.734% | 1.057% | 1.492% | 1.895% | +1.161pt |
| City banks | 0.701% | 1.181% | 1.775% | 2.014% | +1.313pt |
| Regional banks | 0.752% | 1.003% | 1.343% | 1.870% | +1.118pt |
| Second-tier regional banks | 0.900% | 1.135% | 1.352% | 1.821% | +0.921pt |
| Shinkin banks | 1.559% | 1.608% | 1.917% | 2.157% | +0.598pt |
| Domestic banks (outstanding loans, long-term) | 0.809% | 0.802% | 1.080% | 1.397% | +0.588pt |
Regional lending overall — domestic bank credit by prefecture is +30.7% on end-2019
Seen from the side of regional financial institutions, where does accommodation’s growth rank? Comparing domestic bank lending by branch location in the Bank of Japan’s Deposits, Vault Cash, and Loans and Bills Discounted by Prefecture, the national total at end-July 2026 was ¥665.206tn, up +30.7% from end-December 2019 (¥509.0765tn). Excluding Tokyo (+41.6%), the increase is still +22.5%. The largest gains run Aichi (+55.6%), Yamanashi (+45.6%), Tokyo (+41.6%) and Ehime (+36.3%); in 36 of the 47 prefectures, total lending grew faster than lending to accommodation (+10.2%). Only Niigata declined (−3.3%).
This statistic covers domestic banks including city banks on a branch basis and excludes shinkin banks. It carries no sector breakdown, so accommodation balances by region cannot be derived from it. Even so, the fact that the accommodation account has grown comparatively slowly while regional lending overall has expanded suggests there is room to increase the weight of hotel deals within the credit portfolios of regional and shinkin banks. At the level of an individual transaction, whether the DSCR and LTV combination set out in the following sections clears is what converts that room into actual lending.
| Prefecture | End-Dec 2019 | End-Jul 2026 | Change |
|---|---|---|---|
| Aichi | 202,330 | 314,921 | +55.6% |
| Yamanashi | 11,591 | 16,876 | +45.6% |
| Tokyo | 2,178,852 | 3,086,028 | +41.6% |
| Ehime | 61,492 | 83,783 | +36.3% |
| Kyoto | 62,577 | 85,231 | +36.2% |
| Okayama | 54,673 | 73,940 | +35.2% |
| Kumamoto | 43,564 | 56,738 | +30.2% |
| Fukuoka | 194,298 | 250,754 | +29.1% |
| … | |||
| Shizuoka | 97,814 | 102,290 | +4.6% |
| Aomori | 26,611 | 27,767 | +4.3% |
| Nagano | 36,481 | 37,258 | +2.1% |
| Toyama | 33,873 | 34,458 | +1.7% |
| Niigata | 50,971 | 49,313 | -3.3% |
| National total | 5,090,765 | 6,652,060 | +30.7% |
| National total (excluding Tokyo) | 2,911,913 | 3,566,032 | +22.5% |
The model property’s NOI — building up 100 rooms at ¥3.0bn from measured cost lines
The model property is a limited-service hotel of 100 rooms acquired for ¥3.0bn (¥30mn per room). ADR is set at ¥14,300, the estimated settled ADR for the business-hotel segment in Tokyo (12-month average from August 2025 to July 2026, N=894–924 properties per month). Occupancy (assumption) is 80%. In monthly REIT disclosures, Invincible Investment Corporation (8963) reported 86.3% occupancy across its 101 domestic hotels in July 2026, so this is the more conservative setting. Room revenue at 92% of total revenue and a GOP margin of 42% are the same values used in the 100-room model in our earlier “Policy Rate 1.00% and Hotel Development”.
The line items below GOP are built up from measured figures in HotelBank’s opex detail series. Property tax runs ¥160,000–240,000 per room per year, or ¥194,000–291,000 including city planning tax (“12 Municipal Hotel Incentives in Japan Move 100-Room IRR +0.08–1.03pt”); the midpoint of ¥242,500 is used. The insurance premium is ¥3.38mn a year — the same ¥22.5mn insured value per room (building plus contents) used in “Hotel Fire Insurance: ¥1.01M Flood-Zone Gap, PML Moves LTV and IRR”, at a rate of 0.15% — and excludes earthquake cover. The FF&E reserve is set at 3% of total revenue, and the management fee (equivalent to a base fee under a management agreement, or head-office cost for self-operated hotels) also at 3%.
Three cost lines — water and sewerage, waste disposal, and statutory inspections — sit inside GOP as operating expenses. Applied to the 100-room model, water and sewerage costs ¥11.93mn a year on the Tokyo ward-area tariff (2.63% of total revenue), waste disposal ¥1.88mn at the Tokyo 23-ward rate and a generation rate of 1.0kg per guest-night (0.42%), and statutory inspection and reporting ¥500,000–780,000 using the per-room figure for the 100–199 room band (0.11–0.17%). The three together come to around 3.2% of total revenue, and the 42% GOP margin is set as a level that already absorbs them.
Building up from there, NOI is ¥135.46mn a year, an NOI yield on the acquisition price of 4.52%, or ¥1.355mn per room. That sits between the 4.1% expected yield for limited-service hotels in Tokyo in the Japan Real Estate Institute’s 54th Japanese Real Estate Investor Survey (as of April 2026) and the 4.70% median direct capitalization rate for the 100–299 room band in listed hotel REIT appraisals (“Hotel REIT Appraisals Hit 1.25x Cost: Cap Rates Across 298 Assets”).
| Item | Annual | Per room | % of total revenue | Assumption / source |
|---|---|---|---|---|
| Room revenue | ¥416.8mn | ¥4.168mn | 92.0% | ADR ¥14,273 × occupancy (assumption) 80% × 365 days × 100 rooms |
| Total revenue | ¥453.0mn | ¥4.530mn | 100.0% | Room revenue ratio 92% |
| GOP | ¥190.3mn | ¥1.903mn | 42.0% | Same GOP margin as the earlier 100-room model |
| of which water and sewerage (within GOP) | ¥11.9mn | ¥119k | 2.63% | Tokyo ward-area tariff, 400L per guest-night (earlier article) |
| of which waste disposal (within GOP) | ¥1.9mn | ¥19k | 0.42% | Tokyo 23 wards, 1.0kg per guest-night (earlier article) |
| of which statutory inspection and reporting (within GOP) | ¥0.5–0.8mn | ¥5,041–7,831 | 0.11–0.17% | Per-room figure for the 100–199 room band (earlier article) |
| Management fee | −¥13.6mn | −¥136k | 3.0% | Base fee or head-office cost equivalent |
| Property tax and city planning tax | −¥24.3mn | −¥243k | 5.4% | Midpoint of ¥194k–291k per room |
| Insurance premium | −¥3.4mn | −¥34k | 0.7% | Insured value ¥2.25bn × 0.15% (no earthquake cover) |
| FF&E reserve | −¥13.6mn | −¥136k | 3.0% | 3% of total revenue |
| NOI | ¥135.5mn | ¥1.355mn | 29.9% | 4.52% against the ¥3.0bn acquisition price |
Working back from DSCR 1.3x — LTV 62.7% at 1.0%, 56.8% at 2.0%
Debt capacity follows from dividing NOI by the DSCR to get the annual principal-and-interest payment the property can carry, then dividing that by the loan constant. With NOI of ¥135.46mn and a DSCR of 1.3x, the ceiling on annual principal and interest is ¥104.2mn. Over a 20-year level-payment amortization, the loan constant is 5.54% at a 1.0% rate, 5.82% at 1.5% and 6.12% at 2.0%, giving borrowing ceilings of ¥1.880bn (LTV 62.7%), ¥1.789bn (59.6%) and ¥1.704bn (56.8%) respectively. Moving the rate up one point from 1.0% to 2.0% shrinks the ceiling by roughly ¥177mn, or 5.9 points of LTV.
In practice lenders set an LTV cap alongside the DSCR. Here the lender’s LTV cap is assumed at 60% (the same assumption as in our earlier work). On that basis, at a 1.0% rate the 60% LTV cap binds before the DSCR ceiling of 62.7%, so the loan is ¥1.800bn and the DSCR comes in at 1.36x with room to spare. At 1.5% the DSCR-based ceiling of 59.6% falls just below the LTV cap, and from there on DSCR sets the loan amount. For this property, in other words, roughly 1.5% is the point at which the binding constraint switches from LTV to DSCR. In credit review during a rising-rate phase, checking DSCR and debt yield (7.95% at a 2.0% rate) before LTV gives a more accurate measure of repayment capacity.
The equity side is worth setting out too. Acquisition costs use the ¥3.0bn case from “Hotel Acquisition Costs 7.1%: A 6.5% Gross Yield Becomes 4.65% Net” (¥208.64mn, 6.95% of price). Required equity is ¥1.409bn at a 1.0% rate and ¥1.505bn at 2.0%. Cash-on-cash return after principal repayment is 2.1–2.5%, but that is because principal amortization over 20 years (¥70mn–82mn in the first year) leaves the cash flow — and the principal repaid accrues directly to the equity stake. Measured after interest but before principal, the yield is 6.7–8.3%.
We also ran a 10-year internal rate of return. On conservative assumptions — NOI flat for 10 years, an exit capitalization rate 0.25 points above the acquisition yield at 4.77%, and 2% disposal costs — the unlevered IRR is 3.08%. Against that, the levered IRR at a 2.0% rate and LTV 56.8% is 3.99%, and at 1.0% with LTV 60% it is 4.98% — both above unlevered. Positive leverage, where debt lifts the return, still holds at 2.0%. Where NOI grows 2% a year, the levered IRR at 2.0% rises to 7.76%.
| Item (100 rooms, ¥3.0bn price, NOI ¥135.5mn) | Rate 1.0% | Rate 1.5% | Rate 2.0% | Rate 2.5% (ref.) |
|---|---|---|---|---|
| Loan constant (20-year, level payment) | 5.54% | 5.82% | 6.12% | 6.41% |
| Borrowing ceiling meeting DSCR 1.3x | ¥1.880bn | ¥1.789bn | ¥1.704bn | ¥1.624bn |
| implied LTV | 62.7% | 59.6% | 56.8% | 54.1% |
| Debt yield (NOI ÷ loan) | 7.20% | 7.57% | 7.95% | 8.34% |
| Binding constraint (with 60% LTV cap) | LTV cap 60% | DSCR 1.3x | DSCR 1.3x | DSCR 1.3x |
| Loan amount adopted | ¥1.800bn | ¥1.789bn | ¥1.704bn | ¥1.624bn |
| Annual principal and interest | ¥99.7mn | ¥104.2mn | ¥104.2mn | ¥104.2mn |
| DSCR (resulting) | 1.36x | 1.30x | 1.30x | 1.30x |
| Required equity (incl. acquisition costs) | ¥1.409bn | ¥1.420bn | ¥1.505bn | ¥1.584bn |
| Cash-on-cash (after principal repayment) | 2.54% | 2.20% | 2.08% | 1.97% |
| Yield after interest (before principal) | 8.34% | 7.65% | 6.74% | 5.99% |
| 10-year levered IRR (NOI flat) | 4.98% | 4.52% | 3.99% | 3.53% |
| 10-year levered IRR (NOI +2%/yr) | 8.76% | 8.36% | 7.76% | 7.24% |
Interest is not the only lever on debt capacity. The chart below plots the maximum LTV by amortization term for each borrowing rate. Holding the rate at 2.0% and stretching amortization to 25 years widens the DSCR 1.3x ceiling to an LTV of 67.8%, and to 77.8% at 30 years. The move from 20 to 25 years alone is worth +11.0 points — about 1.9 times the +5.9 points gained from a one-point fall in the rate. How the amortization term is structured, within what the building’s economic useful life will support, drives debt capacity as much as or more than the rate itself.
The price that clears — the ceiling that holds LTV 60% is ¥2.84bn at a 2.0% rate
Now fix the LTV target first and work back to the maximum affordable price. With NOI unchanged at ¥135.46mn, the acquisition price that satisfies both LTV 60% and DSCR 1.3x tops out at ¥3.13bn (¥31.3mn per room) at a 1.0% rate, ¥2.98bn at 1.5%, ¥2.84bn (¥28.4mn per room) at 2.0% and ¥2.71bn at 2.5%. A ¥3.0bn price can be structured at 60% LTV up to around 1.5%; at 2.0% the design has to be squared either by dropping LTV to 56.8% or by extending the amortization term. For buyer and seller alike, a price ceiling stated per rate level is easy to use as common ground in negotiation.
| Target LTV | Rate 1.0% | Rate 1.5% | Rate 2.0% | Rate 2.5% |
|---|---|---|---|---|
| LTV 50% | ¥3.76bn ¥37.61mn/room | ¥3.58bn ¥35.78mn/room | ¥3.41bn ¥34.08mn/room | ¥3.25bn ¥32.49mn/room |
| LTV 55% | ¥3.42bn ¥34.19mn/room | ¥3.25bn ¥32.53mn/room | ¥3.10bn ¥30.98mn/room | ¥2.95bn ¥29.53mn/room |
| LTV 60% | ¥3.13bn ¥31.34mn/room | ¥2.98bn ¥29.82mn/room | ¥2.84bn ¥28.40mn/room | ¥2.71bn ¥27.07mn/room |
| LTV 65% | ¥2.89bn ¥28.93mn/room | ¥2.75bn ¥27.52mn/room | ¥2.62bn ¥26.21mn/room | ¥2.50bn ¥24.99mn/room |
The same logic extends to rate levels across submarkets. Holding occupancy (assumption) at 80%, the GOP margin at 42% and fixed costs constant, and moving only ADR, debt capacity per room moves almost proportionally with ADR. On estimated settled ADR for the business-hotel segment, the Aichi level of ¥7,800 supports ¥7.80mn per room at a 2.0% rate, Osaka at ¥10,400 supports ¥11.45mn, Fukuoka at ¥10,900 supports ¥12.16mn, and Tokyo at ¥14,300 supports ¥17.04mn — a 2.2-fold spread between Aichi and Tokyo. Dividing back by an LTV of 60% gives an indicative per-room price that clears in each submarket. Note that these calculations apply a single nationwide midpoint for property tax and insurance, so in submarkets with lower land values actual debt capacity will run above these figures.
| Prefecture | Estimated settled ADR | N (properties/month) | NOI/room | Debt capacity/room (1.0%) | Debt capacity/room (2.0%) | Price ceiling/room at LTV 60% (2.0%) |
|---|---|---|---|---|---|---|
| Aichi | ¥7,844 | 322–329 | ¥620k | ¥8.61mn | ¥7.80mn | ¥13.00mn |
| Hokkaido | ¥8,857 | 417–441 | ¥736k | ¥10.21mn | ¥9.25mn | ¥15.42mn |
| Osaka | ¥10,386 | 487–499 | ¥910k | ¥12.64mn | ¥11.45mn | ¥19.09mn |
| Fukuoka | ¥10,880 | 330–341 | ¥967k | ¥13.42mn | ¥12.16mn | ¥20.27mn |
| Kyoto | ¥14,046 | 314–329 | ¥1.329mn | ¥18.44mn | ¥16.71mn | ¥27.85mn |
| Tokyo | ¥14,273 | 894–924 | ¥1.355mn | ¥18.80mn | ¥17.04mn | ¥28.40mn |
LTV at seven listed REITs — 40.8–49.2% on a total-asset basis
As a comparison anchor, here are the LTVs disclosed by seven listed hotel REITs. On a total-asset basis they run from 40.8% at Hoshino Resorts REIT (3287) to 49.2% at Invincible Investment Corporation, with Ichigo Hotel REIT (3463), Japan Hotel & Residential REIT (3472) and Mori Trust REIT (8961) all at 46.8% and Kasumigaseki Hotel REIT (401A) at 46.4%. Japan Hotel REIT (8985) discloses a market-value LTV of 34.5%, and Invincible reports 41.9% on an appraisal basis. On policy, Hoshino Resorts REIT targets 42.0–43.0% on a total-asset basis for the time being, and Kasumigaseki Hotel REIT 40–50%.
A listed REIT’s LTV is the ratio supporting a diversified multi-property portfolio funded largely by unsecured borrowing, with a denominator of total assets at book value. The yardstick differs from a private fund or operating company borrowing against a single property as collateral. Even so, it is worth referencing as the level of leverage that lenders and investors in the listed market will accept now that rates have returned. This article’s model (LTV 56.8% at DSCR 1.3x and a 2.0% rate) sits 7.6–16.0 points above the listed REITs’ total-asset LTVs. Single-property lending, repaid out of that property’s own cash flow, is structured by designing the ceiling from the DSCR and LTV combination together.
On average borrowing rates, Invincible reports 1.46% (end of the June 2026 period) and Ichigo Hotel 1.29% (end of the January 2026 period), both below the 1.895% new long-term bank average. That reflects legacy fixed-rate borrowing still outstanding, which converges toward new-lending levels as refinancing proceeds. When assessing new financing for an individual property, the consistent starting point is the new long-term level in Table 2 rather than the listed REITs’ average rate.
| Investment corporation | Reference date | LTV | Definition as disclosed | Source |
|---|---|---|---|---|
| Japan Hotel REIT Investment Corporation (8985) | 30 June 2026 | 34.5% | Interest-bearing debt ratio (market-value LTV) | Financial summary |
| Invincible Investment Corporation (8963) | 30 June 2026 | 49.2% | Interest-bearing debt ÷ total assets (appraisal-based LTV is 41.9%) | June 2026 period financial results |
| Hoshino Resorts REIT Investment Corporation (3287) | 30 April 2026 | 40.8% | Total-asset basis | April 2026 period results presentation |
| Ichigo Hotel REIT Investment Corporation (3463) | 31 January 2026 | 46.8% | Borrowings ¥38,020mn ÷ total assets ¥81,291mn (derived from the balance sheet) | January 2026 period financial results |
| Japan Hotel & Residential REIT Investment Corporation (3472) | 31 May 2026 | 46.8% | Interest-bearing debt as a share of total assets | May 2026 period financial results |
| Mori Trust REIT Investment Corporation (8961) | 28 February 2026 | 46.8% | Period-end interest-bearing debt to total assets (diversified REIT including offices) | February 2026 period financial results |
| Kasumigaseki Hotel REIT Investment Corporation (401A) | 31 January 2026 | 46.4% | Total-asset basis (end of the 1st period) | January 2026 period results presentation |
Sensitivity — a 10% move in ADR shifts LTV by 6.8 points
Next, how far the maximum LTV at a 2.0% rate moves when the NOI assumptions change. A 10% fall in ADR takes NOI to ¥119.15mn and the LTV ceiling down 6.8 points to 50.0%. At an occupancy (assumption) of 75% it is 52.5%. Reserving for capital renewal at the level actually recorded by five listed REITs (1.46–1.70% of acquisition price, midpoint 1.58%; “Hotel Capex: ¥134k–¥624k per Room a Year — 5 REITs’ IR Disclosures”) pulls the LTV ceiling down to 42.6%. Because how heavily a lender provides for capital renewal feeds straight through to debt capacity, being able to show repair history and a 10-year renewal plan before acquisition is a concrete way to widen borrowing headroom.
The sensitivities run large in the other direction too. Setting the DSCR standard at 1.2x lifts the LTV ceiling to 61.5%; 1.4x takes it to 52.7%. A 25-year amortization gives 67.8%, and 30 years 77.8%. Adding to ADR, structuring the amortization, and the DSCR standard applied all move LTV by as much as or more than a full point of interest rate.
| Scenario (2.0% rate) | NOI | NOI yield | Maximum LTV | vs base |
|---|---|---|---|---|
| Base case | ¥135.5mn | 4.52% | 56.8% | — |
| ADR −10% | ¥119.2mn | 3.97% | 50.0% | -6.8pt |
| Occupancy (assumption) 75% | ¥125.3mn | 4.18% | 52.5% | -4.3pt |
| Capital renewal reserved at REIT levels (1.58% of price) | ¥101.6mn | 3.39% | 42.6% | -14.2pt |
| DSCR 1.2x | ¥135.5mn | 4.52% | 61.5% | +4.7pt |
| DSCR 1.4x | ¥135.5mn | 4.52% | 52.7% | -4.1pt |
| DSCR 1.5x | ¥135.5mn | 4.52% | 49.2% | -7.6pt |
| 25-year amortization | ¥135.5mn | 4.52% | 67.8% | +11.0pt |
| 30-year amortization | ¥135.5mn | 4.52% | 77.8% | +21.0pt |
Design points by reader
Credit officers at regional and shinkin banks
Apply both DSCR and LTV and the binding constraint on this property changes hands at around 1.5%. In a rising-rate phase, checking DSCR and debt yield (7.95% at 2.0%) first gives a more accurate read on repayment capacity. Capital-investment lending to the accommodation sector continues to be supplied, at +15.9% on pre-COVID.
Private funds drawing non-recourse debt
How the amortization is structured moves LTV most: +11.0 points from 20 to 25 years. When comparing against interest-only, bullet-repayment terms, align the DSCR definition (interest-only basis or principal-and-interest basis) across term sheets before drawing the comparison.
Operating companies considering a first acquisition
On a ¥3.0bn property, required equity including costs is ¥1.409–1.505bn (47–50% of the acquisition price). The price ceiling that holds LTV at 60% is ¥2.84bn at a 2.0% rate, or ¥28.4mn per room as a guide. Presenting repair history and a renewal plan widens borrowing headroom.
Conclusion
A funding plan for a hotel acquisition still comes together in a market with an interest rate attached. In a model of 100 rooms at ¥3.0bn and a 4.52% NOI yield, DSCR 1.3x over a 20-year amortization supports borrowing up to LTV 56.8%, or ¥1.704bn, at a 2.0% rate, and the 10-year levered IRR exceeds the unlevered return. One point of interest rate is worth 5.9 points of LTV; five years of amortization, 11.0 points; and 10% of ADR, 6.8 points.
Widening debt capacity is not only a matter of finding the cheapest lender. Structuring the amortization term, presenting a capital renewal plan, and adding to ADR through operations all work as hard or harder. Capital-investment funding for the accommodation sector is being supplied above pre-COVID levels, the new long-term rate stands at 1.895%, and listed REIT LTVs sit at 40.8–49.2% on a total-asset basis. Establishing, deal by deal, the price range that satisfies DSCR and LTV simultaneously is where assembling the financing begins.
Note: the calculations in this article are simplified model estimates. Actual financing terms and investment decisions require case-by-case credit review and feasibility study. Borrowing rates, DSCR, LTV caps and amortization terms vary by financial institution and by transaction.
Related articles
References and sources
■ Data sources
Estimated settled ADR is MetroEngines Research’s monthly figure by prefecture for the business-hotel segment (12-month arithmetic average, August 2025 to July 2026; Tokyo N=894–924 properties per month). Loans outstanding, contracted lending rates and lending by prefecture are Bank of Japan time-series statistics (Loans and Bills Discounted by Sector, end-June 2026; Average Contract Interest Rates on Loans and Discounts, July 2026; Deposits, Vault Cash, and Loans and Bills Discounted by Prefecture, end-July 2026). Listed REIT LTVs are the disclosed values at each investment corporation’s most recent period end, and the cost lines below GOP are measured figures from HotelBank’s opex detail series.
■ Calculation assumptions
The model property is a 100-room limited-service hotel acquired for ¥3.0bn. ADR ¥14,273, occupancy (assumption) 80%, room revenue ratio 92%, GOP margin 42%; the management fee and FF&E reserve are each 3% of total revenue; property tax and city planning tax are ¥242,500 per room; the insurance premium is ¥3.38mn a year. Financing terms are DSCR 1.3x, 20-year level-payment amortization (annualized), a lender LTV cap of 60%, and acquisition costs of ¥208.64mn. The 10-year IRR assumes 2% disposal costs and an exit price equal to projected NOI in the eleventh year of ownership divided by a 4.77% capitalization rate; in the NOI +2%/yr case, growth runs from the first year.
■ Limitations and caveats
ADR is an estimate and differs from any individual property’s actual transacted rates or accounting figures. The 80% occupancy (assumption) is an assumed input, not an actual result. Loans outstanding to the accommodation industry are classified by the borrower’s principal business and exclude lending to real estate companies and SPCs that own hotels. The average contracted rate is a weighted average across all industries and is not the rate on any individual hotel transaction. Listed REIT LTV definitions (total-asset, market-value, appraisal basis) differ by company, and both the denominator and the collateral structure differ from single-property lending. Property tax and insurance use a single nationwide midpoint, and corporate tax, interest-rate hedging and bullet repayment are not considered.
■ Market data
- MetroEngines Research & Consulting — estimated settled ADR (by prefecture, business-hotel segment, August 2025 to July 2026; Tokyo N=894–924 properties per month, among others), model calculations
■ Government and public statistics
- Bank of Japan Time-Series Data Search — Loans and Bills Discounted by Sector (end-June 2026, updated 10 August 2026); Average Contract Interest Rates on Loans and Discounts (July 2026, updated 1 September 2026); Deposits, Vault Cash, and Loans and Bills Discounted by Prefecture (end-July 2026, updated 28 August 2026)
- Bank of Japan, “Monetary Policy”
- Japan Real Estate Institute, “The 54th Japanese Real Estate Investor Survey” (as of April 2026)
■ REIT and IR materials
- Japan Hotel REIT Investment Corporation, “Financial Summary” (as of 30 June 2026)
- Invincible Investment Corporation, “June 2026 Period Financial Results” (25 August 2026)
- Invincible Investment Corporation, “Monthly Operating Status (July 2026)”
- Hoshino Resorts REIT Investment Corporation, “April 2026 (26th) Period Results Presentation” (15 June 2026)
- Ichigo Hotel REIT Investment Corporation, “January 2026 Period Financial Results”
- Japan Hotel & Residential REIT Investment Corporation, “May 2026 Period Financial Results” (22 July 2026)
- Mori Trust REIT Investment Corporation, “February 2026 Period Financial Results” (22 April 2026)
- Kasumigaseki Hotel REIT Investment Corporation, “January 2026 (1st) Period Results Presentation” (19 March 2026)
■ Earlier HotelBank articles (sources for model assumptions)
- 12 Municipal Hotel Incentives in Japan Move 100-Room IRR +0.08–1.03pt (per-room property and city planning tax levels)
- Hotel Fire Insurance: ¥1.01M Flood-Zone Gap, PML Moves LTV and IRR (insured value and rate assumptions)
- Hotel Water & Sewer Costs Vary 2.1x by Municipality: ¥7.85mn NOI Gap (annual water and sewerage cost for 100 rooms)
- Japan Hotel Waste Fees: 2.6x City Gap, 100-Room Cost and NOI Impact (annual waste disposal cost for 100 rooms)
- Hotel Statutory Inspection Costs: ¥3,400–12,600 per Room, NOI Impact (inspection cost by room-count band)
- Hotel Acquisition Costs 7.1%: A 6.5% Gross Yield Becomes 4.65% Net (acquisition costs in the ¥3.0bn case)