

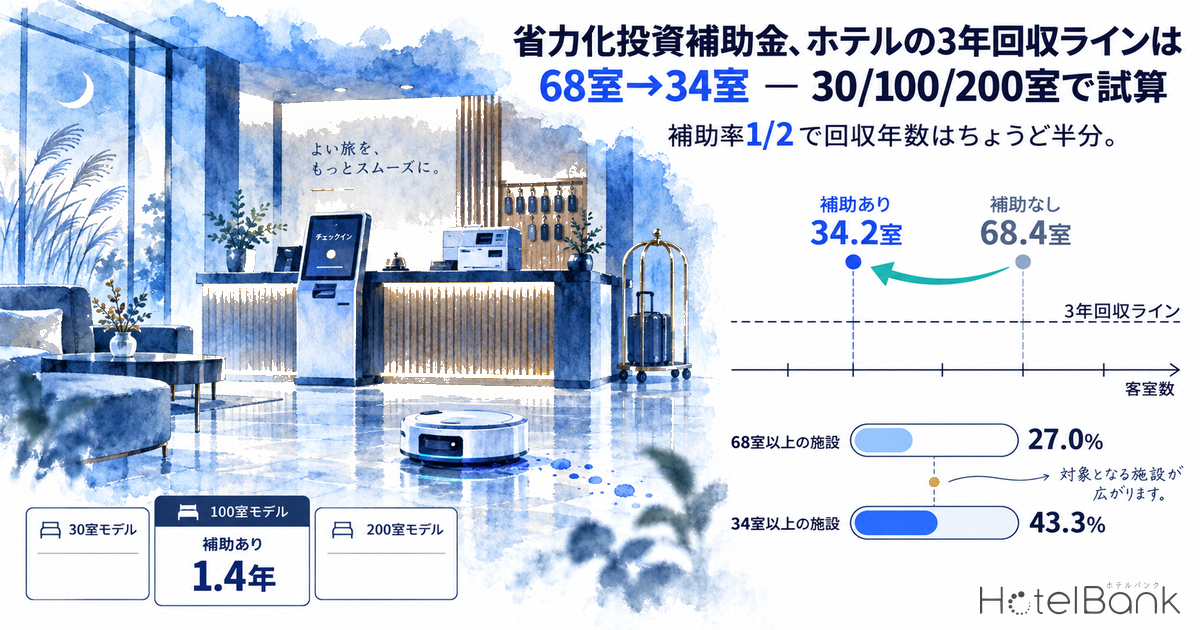
For labor-saving equipment in the lodging industry, the presence or absence of a subsidy changes the entire payback picture. The SME Labor-Saving Investment Subsidy (Catalog Order Type and General Type) and the Japan Tourism Agency’s Labor-Saving Investment Subsidy Program for Tourist Destinations and the Tourism Industry all apply a standard subsidy rate of one-half, meaning half of the equipment cost is covered by public funds. This article models the annual labor-cost savings and simple payback period for automated check-in kiosks, cleaning robots, and cash handling machines across three property models — 30, 100, and 200 rooms — with and without a subsidy.
Metric Definitions Used in This Article
- ADR (average daily rate): An estimated settled rate (tax-excluded equivalent) calculated by applying a property-type correction coefficient to the lowest published plan rate each property lists on OTAs and similar channels (double occupancy, per room, tax included). Cross-checked against property-level results disclosed by listed hotel REITs (91 properties, most recent 3 months), the median error is approximately 7%. These are estimates and differ from each property’s actual transacted rates and accounting figures. Area-level ADR is the median of the properties covered (the level of a typical property in that area).
- OCC (occupancy rate): The occupancy rate used in this article’s model is the room occupancy rate from the Japan Tourism Agency’s Overnight Travel Statistics Survey, full-year 2025 (preliminary).
- Simple payback period: Out-of-pocket cost ÷ annual savings. Interest, residual value, maintenance costs, and replacement costs are not considered.
- Data sources: MetroEngines Research & Consulting; Japan Tourism Agency; Ministry of Health, Labour and Welfare; Organization for Small & Medium Enterprises and Regional Innovation, JAPAN (SMRJ); Ministry of Internal Affairs and Communications / Ministry of Economy, Trade and Industry
- — A subsidy halves the payback period: Applying the one-half subsidy rate common to all three programs, the 100-room model goes from 2.9 to 1.4 years, the 200-room model from 3.1 to 1.6 years, and the 30-room model from 6.8 to 3.4 years.
- — The three-year payback line moves from 68.4 to 34.2 rooms: For a standalone automated check-in kiosk. Among Japan’s 32,130 tracked properties, the share that clears the line widens from 27.0% to 43.3%; on a room-count basis, properties with 34 rooms or more account for 87.1%.
- — 100 rooms and up clear three years even in the pessimistic case: At a 40% substitution rate and ¥1,177 per hour, post-subsidy payback is still 2.2 years at 100 rooms and 2.4 years at 200 rooms. The 30-room model swings widely, from 2.1 to 6.0 years depending on assumptions.
- — A ¥56 minimum wage increase lifts savings by 4.8%: Factoring in the FY2026 national weighted average of ¥1,177 (taking effect in stages between October 1 and December 2, 2026), annual savings for the 100-room model rise by roughly ¥101,000.
- — 14 of the 18 lodging-eligible catalog categories are kitchen-related: To cover front desk and housekeeping in depth, the design is to combine the Catalog Order Type with the General Type (8th round deadline: 17:00 on October 16, 2026) or the Japan Tourism Agency program.
Three programs are available, and all set the subsidy rate at one-half
Public support that lodging operators can use to install labor-saving equipment falls into three main programs: the “Catalog Order Type” and “General Type” of the SME Labor-Saving Investment Subsidy, plus the Japan Tourism Agency’s Labor-Saving Investment Subsidy Program for Tourist Destinations and the Tourism Industry. What all three share is a standard subsidy rate of one-half — in other words, half of the equipment cost effectively becomes external funding. That single point cuts the payback periods discussed below cleanly in half.
The Catalog Order Type was revised on March 19, 2026, raising the subsidy ceiling for operators with 20 or fewer employees. Operators with five or fewer employees moved from ¥2 million to ¥5 million, and those with 6 to 20 employees from ¥5 million to ¥7.5 million. The figures in parentheses are the ceilings when wage-increase targets are met, which requires raising the in-workplace minimum wage by 3.0% or more year on year, or increasing total payroll by 6% or more.
| Item | Catalog Order Type | General Type | JTA Labor-Saving Investment Subsidy |
|---|---|---|---|
| Subsidy rate | Up to 1/2 | SMEs 1/2 (2/3 with a large wage increase); small-scale operators 2/3 | 1/2 |
| Subsidy ceiling (parentheses = wage-increase target met) |
5 or fewer employees ¥5M (¥7.5M) 6–20 employees ¥7.5M (¥10M) 21 or more employees ¥10M (¥15M) |
5 or fewer employees ¥7.5M (¥10M) 6–20 employees ¥15M (¥20M) 21–50 employees ¥30M (¥40M) 51–100 employees ¥50M (¥65M) 101 or more employees ¥80M (¥100M) |
¥10M |
| Eligible items | General-purpose products registered in the product catalog | Equipment installation and system builds tailored to the individual site and business | Labor saving in front desk, reservations, housekeeping, meal preparation, shift management, and similar functions |
| Eligible operators | SMEs and equivalent (the program requires the applicant to be in a “labor shortage” state) | SMEs and equivalent | Lodging operators licensed under Article 3, Paragraph 1 of the Hotel Business Act |
| Most recent application window | Open on a rolling basis (applications accepted through approximately end of March 2027) |
8th round: applications open 10:00 on September 18, 2026 Deadline 17:00 on October 16, 2026 Awards announced early February 2027 (planned) |
The FY2025 supplementary budget allocation closed after running March 27 – May 29, 2026 |
Source: SMRJ “SME Labor-Saving Investment Subsidy” and Japan Tourism Agency “Labor-Saving Investment Subsidy Program for Tourist Destinations and the Tourism Industry”; compiled by MetroEngines Research & Consulting
On program design, the basic requirements of the General Type are worth noting. Applicants must achieve an average annual growth rate of 4.0% or more in labor productivity, an average annual growth rate of 3.5% or more in total payroll per employee, and set the in-workplace minimum wage at least ¥30 above the regional minimum wage. In other words, the General Type is built so that labor-saving investment and a wage-increase plan are designed together. Whether the operator can show a clear picture of redirecting the funds freed up by the equipment into better compensation becomes the central issue in the application. Tax policy also supports capital investment on the condition of wage increases; the relationship with bonus depreciation on buildings is modeled in detail in Japan Type E Tax Break: 15–25% Hotel Building Bonus Depreciation.
For the General Type, the 8th round opens on the application portal at 10:00 on September 18, 2026, with a deadline of 17:00 on October 16. Three to four rounds are planned per year, so operators who cannot make this one still have room to design for a later round. The Japan Tourism Agency’s labor-saving program closed its FY2025 supplementary budget window on May 29, 2026, so that track is currently a preparation phase aimed at the next fiscal year’s call.
Of the 18 lodging-eligible catalog categories, 14 are kitchen and cooking equipment
The Catalog Order Type works by selecting from pre-registered product categories. The published product category list (updated September 10, 2026) contains 199 categories, of which 18 include “lodging industry” in the eligible-sector column. Breaking those down by functional area, 14 are kitchen, cooking, or washing equipment.
| Functional area | Categories | Category names | Published indicative price |
|---|---|---|---|
| Front desk / settlement | 2 | Automated check-in kiosk / cash handling machine | Several million yen plus several hundred thousand yen installation / from around ¥1 million |
| Housekeeping | 1 | Cleaning robot | Several million yen |
| Food and beverage service | 1 | Serving robot | Several hundred thousand to several million yen |
| Kitchen / cooking / washing | 14 | Steam convection oven, commercial automatic dishwasher, blast chiller/freezer, thawing machine, reheating cabinet/cart, automatic fryer, conveyor oven, dough conditioner, food slicer/cutter, food heating mixer, beverage dispenser/thickened-tea server, dough divider-rounder for bread and similar products, food wrapping machine, food and beverage filling/dispensing machine | From ¥500,000 (up to around ¥30 million depending on category) |
Source: SMRJ “SME Labor-Saving Investment Subsidy (Catalog Order Type) Product Category List” (updated September 10, 2026; 18 lodging-eligible categories out of 199 total); compiled by MetroEngines Research & Consulting
This composition carries an important implication for how lodging operators should think about labor-saving investment. For properties that run their own breakfast buffet or banquet cooking, the Catalog Order Type offers a deep menu of options. But for properties that want to cover lodging-specific areas such as front desk work, guest room cleaning, and key management, the design becomes one of combining the catalog’s four relevant categories with the General Type — which covers custom-built equipment and systems — or the Japan Tourism Agency program, which extends to front desk operations, reservation management, and shift management. The practical approach is not to settle on a single program, but to use different ones for different functional areas.
The catalog’s product category overview states explicitly of automated check-in kiosks that “because the volume of check-in procedures translates directly into the size of the labor-saving effect, properties with several dozen rooms or more are more suitable.” That matches the modeling results below precisely. The program itself has already priced in the fact that scale determines the effect.
Modeling assumptions
All assumptions behind the time savings are shown in the table below, either with a source or as an explicitly stated modeling assumption. Occupancy and labor cost per hour use public statistics; task times and substitution rates are assumptions set by this article. Readers whose properties differ on these figures should check the swing in the sensitivity analysis further below.
| Assumption | Value | Basis |
|---|---|---|
| Room occupancy rate | 75.3% | Japan Tourism Agency “Overnight Travel Statistics Survey,” full-year 2025 (preliminary), business hotels |
| Average nights per reservation | 1.4 nights | Explicit modeling assumption (assumes primarily business demand) |
| Annual check-ins | Rooms × 365 × 75.3% ÷ 1.4 nights | Derived from the two rows above |
| Front desk handling time per check-in | 6.0 minutes | Explicit modeling assumption (check-in + check-out + key issuance combined) |
| Substitution rate, automated check-in kiosk | 60% | Explicit modeling assumption (identity verification, groups, and special handling remain staffed) |
| Common-area floor cleaning time | 100 rooms = 1.5 hours/day / 200 rooms = 2.5 hours/day | Explicit modeling assumption (floor cleaning of corridors, lobby, and similar areas) |
| Substitution rate, cleaning robot | 70% | Explicit modeling assumption (corners, stairs, and guest room interiors remain staffed) |
| Cash close-out and float preparation | 200 rooms = 0.7 hours/day, substitution rate 80% | Explicit modeling assumption (counted only when a cash handling machine is installed) |
| Labor cost per hour | ¥1,365/hour | FY2026 national weighted average regional minimum wage of ¥1,177 (MHLW recommendation) × 1.16 (employer share of social insurance and similar costs) |
| Equipment cost | Automated check-in kiosk ¥3.3M/unit Cleaning robot ¥2.8M/unit Cash handling machine ¥1.5M/unit | Explicit modeling assumption. Set within the indicative price range in the Catalog Order Type product category list (installation included) |
| Subsidy rate | 1/2 | The standard subsidy rate common to all three programs |
| Payback period | Out-of-pocket cost ÷ annual savings | Simple payback. Interest, residual value, maintenance, and replacement costs are excluded |
Source: Japan Tourism Agency “Overnight Travel Statistics Survey,” Ministry of Health, Labour and Welfare “FY2026 Regional Minimum Wage Revisions,” and SMRJ “Product Category List”; compiled by MetroEngines Research & Consulting
To determine employee-count bands, the figures for the inn and hotel sector from the 2016 Economic Census for Business Activity were used: 18,447 establishments, 476,731 employees, and 991,925 guest rooms, giving 0.48 employees per guest room. Applying that coefficient, the 30-room model works out to roughly 14 employees (the “6–20” band), the 100-room model to roughly 48 and the 200-room model to roughly 96 (both in the “21 or more” band). In every model, the equipment cost multiplied by the one-half subsidy rate falls below the subsidy ceiling, so the ceiling is not a binding constraint in this analysis. That said, the definition of employee count under each program follows its own application guidelines, so it should be confirmed in the guidelines at the time of an actual application.
At 30, 100, and 200 rooms, the subsidy halves the payback period
Applying those assumptions produces the three-model results in the table below. The 30-room model uses an automated check-in kiosk only; the 100-room model an automated check-in kiosk plus a cleaning robot; and the 200-room model two automated check-in kiosks, two cleaning robots, and one cash handling machine.
| Item | 30-room model | 100-room model | 200-room model |
|---|---|---|---|
| Annual rooms sold | 8,245 rooms | 27,484 rooms | 54,969 rooms |
| Annual check-ins | 5,890 | 19,632 | 39,264 |
| Equipment installed | 1 check-in kiosk | 1 check-in kiosk 1 cleaning robot | 2 check-in kiosks 2 cleaning robots 1 cash handling machine |
| Hours saved (front desk) | 353 hours | 1,178 hours | 2,356 hours |
| Hours saved (cleaning and cash) | — | 383 hours | 843 hours |
| Total annual hours saved | 353 hours | 1,561 hours | 3,199 hours |
| Annual savings | ¥482,000 | ¥2,131,000 | ¥4,367,000 |
| Equipment cost (pre-subsidy) | ¥3,300,000 | ¥6,100,000 | ¥13,700,000 |
| Out-of-pocket cost after subsidy (1/2 rate) | ¥1,650,000 | ¥3,050,000 | ¥6,850,000 |
| Payback period (no subsidy) | 6.8 years | 2.9 years | 3.1 years |
| Payback period (with subsidy) | 3.4 years | 1.4 years | 1.6 years |
Source: MetroEngines Research & Consulting estimates (assumptions are listed under “Modeling assumptions”)
Source: MetroEngines Research & Consulting estimates
The 100-room and 200-room models land at 1.4 to 1.6 years with a subsidy. Even without one they come in at 2.9 to 3.1 years, so at this scale the investment case can stand on its own. The role of the subsidy is not to make an impossible investment possible, but to halve the time to full recovery and free up the remaining funds for the next investment or for better compensation.
The 30-room model is the contrast. Without a subsidy it takes 6.8 years, and with one, 3.4 years. The reason is that equipment cost does not scale with room count while savings roughly do. One automated check-in kiosk costs the same at 30 rooms as at 200, but the number of check-ins it processes differs by a factor of 6.7. That is where scale bites. Labor reduction built around facial-recognition check-in at the 80-room and 150-room scale, and its effect on GOP, is explored in Face Recognition Check-In: Survival Strategy for Mid-Size Business Hotels (80 vs 150 Room GOP Simulation).
The three-year payback line moves from 68 rooms to 34, widening coverage from 27.0% to 43.3%
Viewing the relationship between scale and payback period continuously makes the subsidy’s effect clearer. With a standalone automated check-in kiosk, annual savings run to roughly ¥16,100 per guest room. Recovering the ¥3.3 million equipment cost in three years requires ¥1.1 million in annual savings, which works back to 68.4 rooms. Apply the one-half subsidy rate so the out-of-pocket cost falls to ¥1.65 million, and the required savings drop to ¥550,000 a year — reaching the three-year payback at 34.2 rooms.
Source: MetroEngines Research & Consulting estimates (standalone automated check-in kiosk, 60% substitution rate)
How many properties those 68-room and 34-room thresholds actually correspond to was checked against real data. Taking as the base the 32,130 properties and 1,970,965 rooms with registered room counts among the hotels, ryokan, resort hotels, and city hotels tracked by MetroEngines Research, 8,684 properties (27.0%) have 68 rooms or more and 13,904 (43.3%) have 34 rooms or more. The one-half subsidy rate therefore lifts the share of properties meeting the three-year payback condition from 27.0% to 43.3% — a gain of 16.3 percentage points, or a difference of 5,220 properties.
Source: MetroEngines Research & Consulting (N=32,130 properties, 1,970,965 rooms; hotels, ryokan, resort hotels, and city hotels)
Looking at the distribution of property sizes, Japan’s lodging stock is dominated by small properties on a facility-count basis but concentrated in mid-to-large properties on a room-count basis. Properties under 20 rooms make up 42.4% of facilities but only 7.0% of rooms. Conversely, properties of 100 rooms or more account for 19.5% of facilities but 64.3% of rooms. When debating labor-saving investment, it is worth keeping in mind that “what share of facilities does this help” and “what share of rooms does this help” paint very different pictures. Properties with 34 rooms or more cover 87.1% of rooms.
For properties in the 20-room range, payback on a standalone automated check-in kiosk runs 3.5 to 5.1 years even with a subsidy. At that scale, the economics work better by designing across multiple functions at once — not front desk alone, but cleaning, meal preparation, and shift management as well — and using a framework such as the General Type or the Japan Tourism Agency program that supports the business as an integrated whole. Where the Catalog Order Type is a program for installing general-purpose products quickly, the General Type is one for assembling a solution around the individual site, and the smaller the property, the more that design freedom matters.
How far the results swing when assumptions move
Among the modeling assumptions, the two that most move the results are the substitution rate and the labor cost per hour. For the 100-room model (automated check-in kiosk plus cleaning robot, ¥3.05 million out of pocket), the chart below shows the payback period as the kiosk substitution rate varies from 40% to 80% (holding the cleaning robot at 70%) and the hourly wage varies from ¥1,177 to ¥1,700.
Source: MetroEngines Research & Consulting estimates (100-room model, after applying the 1/2 subsidy rate)
Even the most conservative combination — a 40% substitution rate at ¥1,177 an hour — comes in at 2.2 years, while an 80% substitution rate at ¥1,700 an hour gives 0.9 years. All 20 combinations land within 2.3 years. At the 100-room scale, payback stays under three years even with distinctly harsh assumptions. Put another way, the issue that drags out investment decisions at this scale is not the economics themselves but the operating design after installation — which tasks to shift onto the equipment, and where to reallocate the time that is freed up.
Because the sensitivity analysis was limited to the 100-room model, the table below applies the same swing to all three models. The pessimistic and optimistic cases correspond to the two ends of the chart above (40% substitution rate at ¥1,177/hour, and 80% at ¥1,700/hour); the cleaning robot at 70% and the cash handling machine at 80% are held constant in every scenario.
| Scenario | Kiosk substitution rate and labor cost | 30-room model | 100-room model | 200-room model |
|---|---|---|---|---|
| Pessimistic | 40% / ¥1,177 per hour | 11.9 years → 6.0 years | 4.4 years → 2.2 years | 4.8 years → 2.4 years |
| Central (this analysis) | 60% / ¥1,365 per hour | 6.8 years → 3.4 years | 2.9 years → 1.4 years | 3.1 years → 1.6 years |
| Optimistic | 80% / ¥1,700 per hour | 4.1 years → 2.1 years | 1.8 years → 0.9 years | 2.0 years → 1.0 years |
Source: MetroEngines Research & Consulting estimates (equipment costs and the 1/2 subsidy rate are the same as under “Modeling assumptions”; bold figures are with subsidy)
The 100-room and 200-room models clear three years even in the pessimistic scenario, at 2.2 to 2.4 years with a subsidy and 4.4 to 4.8 years without. The widest swing belongs to the 30-room model, which ranges from 2.1 to 6.0 years even with a subsidy. At that scale, measuring your own property’s annual check-in volume and per-check-in handling time before installation, and confirming how you set the substitution rate, does more than anything else to sharpen the accuracy of the investment decision.
This analysis converts hours saved directly into labor cost savings, but in practice there is also the option of not cutting headcount and instead reallocating the freed-up time to work that lifts revenue per guest. Areas such as in-house guidance, retail sales, upsell proposals, and review responses can show up in revenue if time is spent on them. In that case the effect has to be evaluated separately from the savings modeled here.
The higher the minimum wage goes, the more the savings automatically grow
According to the FY2026 regional minimum wage recommendations published by the Ministry of Health, Labour and Welfare in September 2026, increases of ¥54 to ¥65 were recommended in all 47 prefectures, bringing the national weighted average of the revised amounts to ¥1,177 (from ¥1,121 the previous year). The ¥56 increase is the second largest since the guideline system began in FY1978. The revised amounts are scheduled to take effect in stages between October 1 and December 2, 2026, following the objection procedure. For a prefecture-by-prefecture breakdown of the revised amounts and effective dates, see Japan Minimum Wage 2026: Chiba & Aichi ¥1,195, Oct 1-15 Rollout.
For the economics of labor-saving investment, this wage increase works as a tailwind. The quantity of time saved does not change, but the monetary value of each of those hours rises. When the hourly wage rises by ¥56, the fully loaded labor cost — including the employer share of social insurance and similar costs (×1.16) — rises by roughly ¥65 per hour. Annual savings rise by about ¥101,000 for the 100-room model, about ¥208,000 for the 200-room model, and about ¥23,000 even for the 30-room model.
| Model | Annual hours saved | Increase in savings from a ¥56/hour rise (incl. employer burden) | Percentage increase in savings |
|---|---|---|---|
| 30-room model | 353 hours | +¥23,000/year | +4.8% |
| 100-room model | 1,561 hours | +¥101,400/year | +4.8% |
| 200-room model | 3,199 hours | +¥207,800/year | +4.8% |
Source: MetroEngines Research & Consulting estimates based on Ministry of Health, Labour and Welfare “FY2026 Regional Minimum Wage Revisions”
What matters here is that this uplift is not a one-off. Minimum wages have been raised continuously in recent years, so the longer the equipment stays in service, the more cumulative savings exceed the original estimate. Conversely, deferring the investment means only the cost of performing the same tasks for the same hours piles up year after year. When evaluating the economics of labor-saving investment, a payback period calculated at today’s wage level is a conservative estimate.
Note that this article uses the minimum wage as the labor cost per hour, whereas actual hourly wages for front desk and housekeeping staff in the lodging industry often exceed the minimum wage depending on the region and role. In those cases the savings are larger than modeled here and the payback period shortens further. That is why the sensitivity analysis includes columns at ¥1,500 and ¥1,700 an hour. Treat the minimum-wage-based model as a way of establishing the floor of the economics.
The savings equal 0.7–0.9% of ADR, but unlike rate increases they do not depend on demand
Converting annual savings into a per-room rate makes the position of the investment easier to see. Estimated settled ADR for business hotels compiled by MetroEngines Research (the 12 months from September 2025 to August 2026) ranges from ¥6,900 in Shizuoka to ¥14,100 in Tokyo when the prefecture-level medians of 12 prefectures are lined up, with a median of ¥8,700.
| Model | Annual savings | Per room sold | Ratio to ADR of ¥8,700 | Ratio to ADR of ¥14,100 |
|---|---|---|---|---|
| 30-room model | ¥482,000 | ¥58 | 0.67% | 0.41% |
| 100-room model | ¥2,131,000 | ¥78 | 0.89% | 0.55% |
| 200-room model | ¥4,367,000 | ¥79 | 0.91% | 0.56% |
Source: MetroEngines Research & Consulting (estimated settled ADR is the prefecture-level median for business hotels across 12 prefectures, September 2025 – August 2026, N=140–914 properties/month)
The savings amount to 0.7–0.9% of ADR, or ¥58 to ¥79 per room sold. As a rate increase that may look small. But this uplift has two properties that a pricing strategy does not.
First, it does not depend on the demand environment. Raising ADR succeeds or fails according to the competitive situation and the strength of demand, and it involves a trade-off with occupancy. Savings from labor-saving equipment, by contrast, occur reliably as long as the property is operating, and grow proportionally as occupancy rises. Second, once realized they persist. ADR can give back its gains when the market turns, but as long as the equipment keeps running the savings remain — and, as noted above, the amount grows in step with wage increases.
As an investment decision, the comparison is between how hard it is to capture 0.9% of ADR through a rate increase and how hard it is to install equipment that, with a subsidy, pays back in 1.4 to 1.6 years. At 100 rooms and above, the latter is a thoroughly realistic option.
Summary
The economics of labor-saving investment change by exactly half depending on whether a subsidy applies, because the one-half subsidy rate flows straight through to the result. The 100-room model goes from 2.9 years without a subsidy to 1.4 years with one; the 200-room model from 3.1 to 1.6 years. The 30-room model still takes 3.4 years even with a subsidy, making front desk automation the area where scale differences show up most.
Looking at the automated check-in kiosk on its own, the three-year payback threshold is 68.4 rooms without a subsidy and 34.2 rooms with one. Among Japan’s 32,130 tracked properties, 27.0% have 68 rooms or more and 43.3% have 34 rooms or more, so the one-half subsidy rate widens the share meeting the economic threshold by 16.3 percentage points. On a room-count basis, properties with 34 rooms or more cover 87.1%.
On the program side, 14 of the 18 lodging-eligible Catalog Order Type categories are kitchen and cooking equipment. To cover front desk and housekeeping in depth, the design is to combine the catalog’s four relevant categories with the General Type or the Japan Tourism Agency program. Applications for the 8th round of the General Type open at 10:00 on September 18, 2026 and close at 17:00 on October 16. Because the General Type carries requirements such as average annual labor productivity growth of 4.0% and average annual total payroll growth of 3.5%, whether an operator can plan labor saving and wage increases together is central to the design.
The minimum wage increases taking effect in stages from October 2026 push up the cost of the same working hours, but they push up the value of the hours saved by exactly the same amount. A payback period calculated at today’s wage level becomes a conservative estimate once the coming years are priced in. Labor-saving investment is not a defensive measure for a period when staff are hard to find; it is a field where the range in which the economics stand up as an investment decision is widening.
Related reading
- Japan Minimum Wage 2026: +¥9,600/Room Labor Cost, 0.50% ADR Fix
- Optimal Hotel Size: Business ADR Bottoms at 30–59 Rooms, +52% at 250+
- Hotel Staff Dorms Move GOP Yield 0.66pt: 0.17 vs 11.2 Workers/Room
- 12 Municipal Hotel Incentives in Japan Move 100-Room IRR +0.08–1.03pt
- Japan Lodging Exits 2025: 267 Cases, New Openings Avg 23.7 Rooms
- Japan Type E Tax Break: 15–25% Hotel Building Bonus Depreciation
- Face Recognition Check-In: Survival Strategy for Mid-Size Business Hotels (80 vs 150 Room GOP Simulation)
- Japan Minimum Wage 2026: Chiba & Aichi ¥1,195, Oct 1-15 Rollout
- FY2026 Tourism DX Subsidy Guide for Hotels: 7 Programs for PMS & Smart Check-In
References and sources
Data sources
Subsidy program details are from the official pages of SMRJ and the Japan Tourism Agency (as of September 2026); room occupancy is from the Japan Tourism Agency “Overnight Travel Statistics Survey,” full-year 2025 (preliminary); the basis for labor cost per hour is the Ministry of Health, Labour and Welfare’s FY2026 regional minimum wage recommendation; employees per guest room is from the Economic Census for Business Activity (2016). The property-size distribution covers the 32,130 properties and 1,970,965 rooms with registered room counts among the hotels, ryokan, resort hotels, and city hotels tracked by MetroEngines Research, and estimated settled ADR is the prefecture-level median for business hotels across 12 prefectures, September 2025 – August 2026 (N=140–914 properties/month).
Modeling assumptions
Room occupancy 75.3% (business hotels, full-year 2025); average 1.4 nights; front desk handling 6.0 minutes per check-in; substitution rates of 60% for the automated check-in kiosk, 70% for the cleaning robot, and 80% for the cash handling machine; labor cost ¥1,365 per hour (national weighted average minimum wage of ¥1,177 × 1.16); equipment costs set within the indicative price ranges in the product category list; subsidy rate 1/2 (Table 3). The sensitivity analysis (Figure 4) and the three scenarios (Table 5) vary the automated check-in kiosk substitution rate from 40% to 80% and the hourly wage from ¥1,177 to ¥1,700.
Limitations and caveats
The payback period is a simple payback and excludes interest, residual value, maintenance costs, replacement costs, property-specific differences in installation work, and the administrative cost of applying. The subsidy calculation assumes the application is approved; eligible expenses, application requirements, and whether an application is approved are governed by each program’s application guidelines. Task times and substitution rates are assumptions made by this article and vary considerably with a property’s operating design. Hours saved are converted into labor cost savings; if the freed-up time is reallocated to other work, the cost reduction will not equal that amount. The employees-per-room coefficient is a 2016 statistic, and estimated settled ADR is an estimate (median error of approximately 7% when cross-checked against disclosed REIT results).
Subsidy programs (primary sources)
- SME Labor-Saving Investment Subsidy, “About the Catalog Order Type” (SMRJ) — subsidy rate and ceilings by employee band
- SME Labor-Saving Investment Subsidy, “Program revision of March 19, 2026” (same source) — higher subsidy ceilings and revised wage-increase requirements
- SME Labor-Saving Investment Subsidy, “Product Catalog” product category list (updated September 10, 2026) — 199 categories in total, 18 lodging-eligible, with indicative prices
- SME Labor-Saving Investment Subsidy, “About the General Type” (same source) — subsidy rate, ceilings, and basic requirements
- SME Labor-Saving Investment Subsidy (General Type) application schedule — opening, deadline, and award announcement for the 8th round
- Japan Tourism Agency, “Notice of the application period for the Labor-Saving Investment Subsidy Program for Tourist Destinations and the Tourism Industry” — eligible operators and application period
- Japan Tourism Agency Labor-Saving Investment Subsidy Program official website — subsidy rate, ceiling, and eligible initiatives
Government statistics
- Ministry of Health, Labour and Welfare, “Revised regional minimum wages have been recommended in all prefectures” (FY2026) — national weighted average ¥1,177, increase of ¥56, effective October 1 – December 2
- Japan Tourism Agency, “Overnight Travel Statistics Survey,” 2025 full-year (preliminary) — room occupancy by property type (overall 61.8%, business hotels 75.3%, city hotels 74.2%, resort hotels 56.9%, ryokan 38.4%)
- Ministry of Internal Affairs and Communications / Ministry of Economy, Trade and Industry, “Economic Census for Business Activity” (2016, e-Stat table ID 0003215481) — inns and hotels: 18,447 establishments, 476,731 employees, 991,925 guest rooms
Market data
- MetroEngines Research & Consulting — property-size distribution (N=32,130 properties, 1,970,965 rooms) and estimated settled ADR for business hotels (September 2025 – August 2026, 12 prefectures)