

Site evaluation for hotel development leans heavily on demand-side indicators. Catchment population, station passenger counts, tourist arrivals, the surrounding room stock — all of them measure who will come to stay. But the people who actually run the building once it is built are the people who can work there. Of Japan’s roughly 27,000 lodging facilities, few have been evaluated from the supply side of labor.
This article measures a “labor catchment ratio” — the working-age population within a 5km radius divided by the room count in that same radius — across 20 catchments nationwide, and converts it into the number of staff dormitory units required and the capital expenditure (Capex) per room. The conclusion up front: in catchments where this ratio falls below 1.5 workers per room, staff housing becomes a de facto mandatory facility, and it moves GOP yield by 0.18 to 0.66pt. Put the other way round, a business plan that prices this in from the start can still treat a thin-labor catchment as an area with substantial upside.
How this fits our existing series: HotelBank has previously treated the same 250m mesh population data as a demand-side and exit-side indicator (see Tokyo Bay 2040: Dual-Growth Zones for Hotel Investment, among others). This article reads the same data as the supply side of labor, and the new step is dividing it by room count. And where our earlier piece on 1,968 Specified Skilled Worker “Lodging” visa holders worked at the prefectural level, this one drills down to a 5km-radius catchment and carries the analysis through to dormitory Capex.
Metric Definitions Used in This Article
- Labor catchment ratio (workers/room): the working-age population (ages 15–64, 2025 estimate) within a 5km radius of the reference point, divided by the total room count (as of 2026) within that same 5km radius. An original HotelBank metric.
- ADR (average daily rate): an estimated settled rate (tax-exclusive equivalent) derived by applying a segment-specific adjustment factor to the lowest published plan level each property lists on OTAs (double occupancy, per-room rate, tax-inclusive). Cross-checked against property-level results disclosed by listed hotel REITs (91 properties, most recent 3 months), the median error is approximately 7%. These are estimates and differ from each property’s actual transacted rates and accounting figures. Area-level ADR is the median of the target properties (the level of a typical property in that area).
- OCC (occupancy rate): sold rooms as a share of total rooms in the area (an estimate based on OTA sales inventory). In this article it is used only as a modeling assumption.
- GOP yield: GOP (gross operating profit) ÷ total investment. This is our own modeled figure, and its definition may differ from the metrics used in actual investment decisions.
- Data sources: resident population = MLIT National Land Numerical Information (250m mesh future population projections) / employment = Economic Census for Business Activity (MIC & METI) / room counts and ADR = MetroEngines Research & Consulting
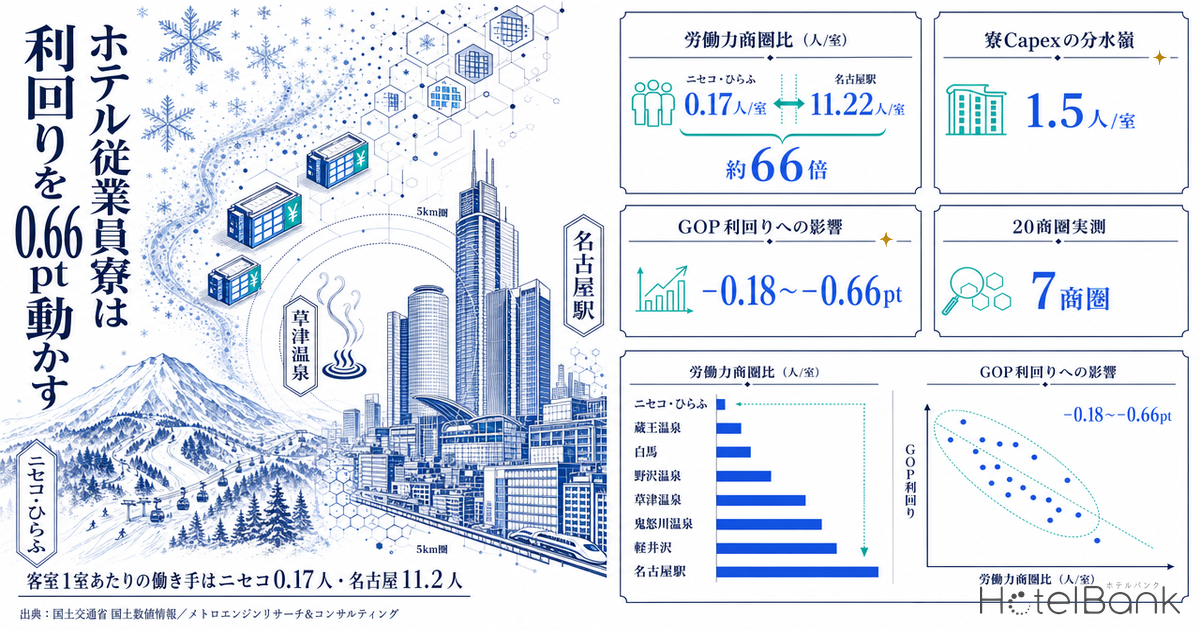
- — About 66x — the labor catchment ratio, the working-age population within 5km divided by the room count in that same radius, ranges from 0.17 workers/room in Niseko-Hirafu to 11.22 in Nagoya Station (20 catchments measured).
- — 1.5 workers/room is the dormitory Capex threshold. Assuming 0.30 staff per room and a 20% local hiring ceiling, 7 of the 20 catchments fall below it.
- — 0.18 to 0.66pt — how far staff housing pushes down GOP yield in a 100-room build-and-own model. That equals ¥153 to ¥590 per occupied room-night.
- — 0.49 to 0.80pt — even across nine combinations of 0.25–0.35 staff per room and a 10–30% local hiring ceiling, the range converges and the conclusion holds.
- — Rate matters — dormitory running costs do not scale with room rate, so the impact narrows from −0.82pt at an ADR of ¥20,000 to −0.51pt at ¥45,000.
Divide working-age population by room count and catchments differ by about 66x
We began by matching the working-age population within a 5km radius against the room count in that same 5km radius, for 20 catchments nationwide. Population comes from MLIT’s National Land Numerical Information 250m mesh future population projections (2025 estimate), aggregated in concentric circles; room counts are built up from the property master maintained by MetroEngines Research & Consulting, covering properties open and not yet closed as of 2026.
The result is shown below: the lowest, Niseko-Hirafu, sits at 0.17 workers per room, and the highest, Nagoya Station, at 11.22 — a spread of roughly 66x. The Niseko-Hirafu catchment has just 1,701 working-age residents against 10,169 rooms. Even if every working-age resident in the catchment worked in lodging, that would still amount to only 0.17 people per room.
The ratio alone, however, does not tell us whether a given level is high or low. The reference point is a unit requirement: how many staff does lodging need per room? According to the 2016 Economic Census for Business Activity (MIC & METI), private-sector “ryokan and hotels” nationwide comprised 18,447 establishments with 476,731 workers and 991,925 rooms. Divide those and you get 0.48 workers per room. That national average includes the labor-intensive ryokan format; lodging-focused and resort hotels run lower.
This article uses 0.30 workers per room as the base assumption to reflect operating efficiency, and tests a 0.25–0.35 range in the sensitivity analysis later. It is worth noting this is conservative relative to the 0.48 national average.
The thinner the catchment, the thinner it gets by 2040
The labor catchment ratio is not a static indicator. Pull 2040 total population projections from the same mesh data and most of the low-ratio catchments are set to lose more people. Against 2025, the Kusatsu Onsen catchment is projected at −32.3%, Nozawa Onsen −32.0%, Zao Onsen −28.4%, Hakuba −16.5% and Hakone-Yumoto −21.3%. For deals with management contracts or hold periods beyond ten years, the number that matters is not the labor catchment ratio at opening but the level at exit.
What is interesting is that the low-ratio catchments split into two futures. Niseko-Hirafu’s projected 2040 total population change is −3.9%, one of the smaller declines among the 20. That suggests the catchment itself is thickening as a destination for relocation and settlement, which is a relative upside on the labor side. Kusatsu Onsen and Nozawa Onsen, by contrast, combine a low ratio with a steep projected decline.
Look at the mesh level and the character of that “thinness” comes into focus. In the Niseko-Hirafu catchment, resident population clusters in a limited set of central meshes, with a wide blank beyond. Its elderly share, at 18.4%, is the lowest of the 20 catchments.
Niseko-Hirafu, 5km radius | resident population by mesh
Kusatsu Onsen, 5km radius | elderly share by mesh
Shade the Kusatsu Onsen catchment by elderly share and most of the inhabited meshes fall into the band above 32%. Across the catchment as a whole there are 2,958 working-age residents against 2,518 elderly residents, an elderly share of 43.0%. That age structure sits behind the labor catchment ratio of 0.74 workers per room.
Treat employment data as a secondary reference — coverage is uneven
The other material for measuring the supply side of labor is establishment and employment data from the Economic Census. Query a 1km radius and Nagoya Station returns 33 districts, 8,965 establishments and 207,026 workers (office-sector share 27.4%), a thick reading, while Niseko-Hirafu returns 1 district, 113 establishments and 1,075 workers (20.7%). As a secondary line for gauging how much existing labor demand has agglomerated, it is useful.
One caveat matters, though: this employment data has uneven coverage. Of the six locations queried here, Miyakojima-Hirara returned zero districts and zero establishments. That does not mean employment is zero; it means the boundary data for that location is not included. In reality the Hirara district contains a large number of establishments. Where coverage returns as “none,” the working rule has to be not to use employment data as evidence for demand or labor supply. Nor can the gap itself be generalized as an economic phenomenon.
| Location (1km radius) | Districts | Establishments | Workers | Office-sector share | Coverage |
|---|---|---|---|---|---|
| Nagoya Station | 33 | 8,965 | 207,026 | 27.4% | Covered |
| Hakuba | 1 | 784 | 3,725 | 6.7% | Sparse |
| Kusatsu Onsen | 1 | 584 | 3,754 | 4.3% | Sparse |
| Hakone-Yumoto | 1 | 223 | 2,326 | 4.0% | Sparse |
| Niseko-Hirafu | 1 | 113 | 1,075 | 20.7% | Sparse |
| Miyakojima-Hirara | 0 | — | — | — | Not covered (excluded from judgment) |
Sizing the dormitory requirement — the threshold is 1.5 workers per room
From here we model the number of dormitory units required. We narrowed the assumptions to three.
| Assumption | Value | Basis |
|---|---|---|
| Staffing requirement | Rooms × 0.30 workers/room (sensitivity: 0.25–0.35 workers/room) | A conservative setting that factors in operating efficiency, against the 0.48 workers/room national average in the 2016 Economic Census for Business Activity (ryokan and hotels: 476,731 workers ÷ 991,925 rooms) |
| Local hiring ceiling | Catchment working-age population × 20% (sensitivity: 10–30%) | Nationally, the 477,000 people working in ryokan and hotels represent just under 1% of total employment. A state in which 20% of a catchment’s working-age population works in lodging is an extremely high concentration even for a tourist destination, so it is set as an upper bound |
| Dormitory units required | Staffing requirement − locally hireable people (one unit per person; negative values set to 0) | Assumes that whatever cannot be hired locally requires housing to be provided |
Rearrange the formula and the condition for needing no dormitory reduces to “labor catchment ratio > 0.30 ÷ 0.20” — a single threshold of 1.5 workers per room. Set the assumptions at 0.25 workers/room and a 30% ceiling and the threshold moves to 0.83; at 0.35 workers/room and a 10% ceiling it moves to 3.5. But on the base assumptions, 1.5 workers per room is the dividing line. Seven of the 20 catchments fall below it: Niseko-Hirafu, Zao Onsen, Hakuba, Nozawa Onsen, Kusatsu Onsen, Kinugawa Onsen and Karuizawa.
Assume a 100-room hotel and the staffing requirement is 30 people. In the Niseko-Hirafu catchment only 11% of that can be filled locally, leaving 27 units of housing to provide. Zao Onsen follows at 26 units, Hakuba at 21, Nozawa Onsen and Kusatsu Onsen at 15 each, Kinugawa Onsen at 12 and Karuizawa at 7. That unit count is the starting point for the Capex, or fixed cost, that belongs in the business plan.
Cost per unit — about ¥7.0 million to build, ¥415,000–¥438,000 a year to lease
Next we set a cost per unit. The build-and-own case assumes a wood-frame apartment format at 25m² per unit (20m² of living space plus 5m² of allocated common area).
The construction unit cost is grounded in MLIT’s Construction Starts Statistics. In 2024, “residential-only buildings” nationwide totaled 59,571,227m² of floor area against ¥14.86 trillion in planned construction cost, which works out to ¥249,428/m² (¥825,000 per tsubo). That is +29.6% above the ¥192,481/m² recorded in 2019.
Build 25m² at that national average and one unit costs ¥6.24 million. Apply market tsubo rates for wood-frame apartments (roughly ¥840,000 in regional cities, around ¥1.1 million in urban areas) and a unit runs ¥6.35–¥8.32 million. Given that these sites are resort locations where materials and labor carry transport costs, this article adopts ¥7.0 million per unit as the base assumption. Land cost is excluded from the model on the assumption that construction takes place within the existing site.
Annual cost is set at ¥318,182 in depreciation, using the 22-year statutory useful life for wood-frame structures, plus ¥200,000 a year for maintenance, utilities and repairs — ¥518,182 per unit per year in total.
For leased corporate housing we use the prefectural monthly rent for privately rented housing from the Statistics Bureau’s 2023 Housing and Land Survey (excluding zero-rent units): Hokkaido ¥51,199, Yamagata ¥49,805, Tochigi ¥51,179, Gunma ¥49,447 and Nagano ¥52,170 (nationwide ¥65,496). Set the employer’s share at 70% and the annual cost is ¥415,000–¥438,000 per unit.
A point specific to the leasing route: on annual cost alone, leasing looks cheaper — but a catchment with a low labor catchment ratio naturally has few residents, and therefore a thin rental stock. The Niseko-Hirafu catchment has a working-age population of 1,701, and whether 27 units can be secured continuously from the market in a catchment that size needs separate verification. In practice a mix of building and leasing tends to be the realistic answer, and this article should be read as setting out the two ends of the range.
The GOP yield impact is 0.18–0.66pt — and higher rates absorb it
The revenue assumptions for the 100-room model are an ADR of ¥30,000 (tax-exclusive equivalent), OCC of 65% (a modeling assumption, not measured occupancy; full-year), non-room revenue at 35% of room revenue, a GOP margin of 30% and total investment of ¥4.0 billion. That gives room revenue of ¥712 million, total revenue of ¥961 million and GOP of ¥288 million, for a GOP yield of 7.21% before staff housing. The 30% GOP margin is a conservative setting for a first year of operation, against the 38.9% GOP actually recorded across the 91 managed properties disclosed by Invincible Investment Corporation (fiscal period ended December 2024).
| Catchment | Labor catchment ratio | Dormitory units (100 rooms) | Construction Capex | Build-and-own annual cost | GOP yield (build) | Lease annual cost | GOP yield (lease) |
|---|---|---|---|---|---|---|---|
| Niseko-Hirafu (Hokkaido) | 0.17 workers/room | 27 units | ¥189M | ¥13.99M | 6.55% (−0.66pt) | ¥11.61M | 6.92% (−0.29pt) |
| Zao Onsen (Yamagata) | 0.18 workers/room | 26 units | ¥182M | ¥13.47M | 6.57% (−0.64pt) | ¥10.88M | 6.93% (−0.27pt) |
| Hakuba (Nagano) | 0.43 workers/room | 21 units | ¥147M | ¥10.88M | 6.69% (−0.52pt) | ¥9.20M | 6.98% (−0.23pt) |
| Nozawa Onsen (Nagano) | 0.73 workers/room | 15 units | ¥105M | ¥7.77M | 6.83% (−0.37pt) | ¥6.57M | 7.04% (−0.16pt) |
| Kusatsu Onsen (Gunma) | 0.74 workers/room | 15 units | ¥105M | ¥7.77M | 6.83% (−0.37pt) | ¥6.23M | 7.05% (−0.16pt) |
| Kinugawa Onsen (Tochigi) | 0.88 workers/room | 12 units | ¥84M | ¥6.22M | 6.91% (−0.30pt) | ¥5.16M | 7.08% (−0.13pt) |
| Karuizawa (Nagano) | 1.13 workers/room | 7 units | ¥49M | ¥3.63M | 7.03% (−0.18pt) | ¥3.07M | 7.13% (−0.08pt) |
The largest impact is the Niseko-Hirafu catchment’s −0.66pt under the build-and-own case. Divide the ¥13.99 million annual cost by 23,725 room-nights sold a year and it comes to ¥590 per occupied room-night, or 1.97% of a ¥30,000 ADR. In other words, if you can add about 2% to the rate, the dormitory Capex is neutralized in earnings terms. In Karuizawa the figure is just ¥153 (0.51%).
For context on actual rates, median estimated settled ADR over the past 12 months runs ¥18,805 in Kutchan Town (N=21 properties), ¥12,519 in Hakuba Village (N=42), ¥17,298 in Kusatsu Town (N=85) and ¥22,206 in Karuizawa Town (N=52). Kutchan, though, swings to ¥63,522 in its peak winter month — the seasonality is extreme. A business plan that assumes ¥30,000 as a full-year average depends on how far peak-season rates can be pushed. We covered how snowfall works on both rate and cost, snow-clearing Opex included, in Snow as Cost or Asset: Winter RevPAR 53% vs Winter ADR 2.66x.
The other relationship worth holding onto is that the higher the rate, the smaller the yield impact of dormitory Capex. For the Niseko-Hirafu catchment’s 27 units under the build-and-own case, moving ADR and total investment together produces the following.
| ADR assumption (tax-exclusive equivalent) | Total investment | GOP | GOP yield before housing | GOP yield after housing | Difference |
|---|---|---|---|---|---|
| ¥20,000 | ¥3.0bn | ¥192M | 6.41% | 5.59% | −0.82pt |
| ¥30,000 (base) | ¥4.0bn | ¥288M | 7.21% | 6.55% | −0.66pt |
| ¥45,000 | ¥5.5bn | ¥432M | 7.86% | 7.35% | −0.51pt |
Because the annual cost of staff housing does not depend on room rate, its weight against the denominator falls as the rate rises. A location with a thin labor catchment only works as a business when paired with a high-rate positioning — a relationship worth settling at the stage when the development concept is decided.
Flex the assumptions and the range stays at 0.49–0.80pt — how robust the conclusion is
We tested sensitivity across two axes: staffing requirement (0.25–0.35 workers/room) and local hiring ceiling (10–30%). Results for the Niseko-Hirafu catchment, 100 rooms, build-and-own, are as follows.
| Staffing requirement \ Local hiring ceiling | 10% | 20% (base) | 30% |
|---|---|---|---|
| 0.25 workers/room | 23 units / 6.64% (−0.57pt) | 22 units / 6.66% (−0.54pt) | 20 units / 6.71% (−0.49pt) |
| 0.30 workers/room (base) | 28 units / 6.52% (−0.68pt) | 27 units / 6.55% (−0.66pt) | 25 units / 6.59% (−0.61pt) |
| 0.35 workers/room | 33 units / 6.41% (−0.80pt) | 32 units / 6.43% (−0.77pt) | 30 units / 6.48% (−0.73pt) |
All nine combinations land within a 0.49–0.80pt range. The unit count swings between 20 and 33 depending on how the assumptions are set, but the conclusion itself — a fixed assumption that moves yield by roughly half a point — does not. Put the other way round, build that range into the business plan from the outset and it will never show up later as a surprise.
Translating this into investment decisions and management contracts
Developers: secure the dormitory site alongside the guest rooms
In catchments below 1.5 workers per room, staff housing is not an ancillary facility but a precondition for the business to work. Factor the dormitory site into land acquisition and the terms will be better than securing it on the open market years later. Against total investment, the scale is ¥49–189 million for 100 rooms, or ¥490,000–¥1.89 million per room — small enough to design in.
Operators: state where housing costs sit in the management contract
Who builds the dormitory, who owns it and who carries maintenance during operation makes a difference worth 0.2–0.7pt on a GOP-based management fee. Bringing the labor catchment ratio to the negotiating table as an objective indicator lets the housing-cost assumption be argued quantitatively.
Investors: evaluate it together with the rate strategy
Because the annual cost of staff housing does not scale with room rate, a higher-rate positioning shrinks the yield impact (−0.82pt at an ADR of ¥20,000, −0.51pt at ¥45,000). A thin labor catchment becomes an investment opportunity when it is combined with a development concept built to command rate.
According to the Japan Tourism Agency’s White Paper on Tourism 2026, a survey of 522 lodging facilities conducted between December 2025 and January 2026 found that 72.2% were short of staff. Labor productivity and pay levels in lodging are both said to run at around 70% of the all-industry average, and the white paper points to the need for improved conditions through capital investment. Providing housing is one component of those conditions.
Limitations of this analysis
| Issue | Detail |
|---|---|
| Treatment of the commuting zone | The 5km radius is a mechanical concentric aggregation; the real commuting zone shifts with the road network, public transport and winter accessibility. In catchments with harsh winter road conditions the effective labor catchment is narrower still, while along arterial routes it widens. |
| Wide-area commuting and seasonal labor | This analysis treats commuters from outside the catchment and seasonal workers uniformly as people requiring housing. In practice some of that is covered by commuting from neighboring municipalities, and to that extent the required unit count is overstated. |
| Observation basis for room counts | Room counts are calculated as of each year-end from opening and closing dates in the property master, and represent what we are able to observe. 2026 is a year still being compiled, and the figure may rise as further listings are confirmed. |
| Granularity of the 2040 projection | The projection is a rate of change on total population, not a projection limited to working-age population. In catchments with a high elderly share, the decline in working-age population may be steeper than the decline in total population. |
| The one-person-per-unit assumption | The diversity of housing formats — shared rooms, family units — is set aside. The model stacks single-occupancy studio units one person at a time; in operational practice the unit count varies. |
| Status of the analysis | This is a simplified model. Actual investment decisions require a detailed feasibility study. |
Conclusion
Divide the working-age population within a 5km radius by the room count and the 20 catchments spread from 0.17 to 11.22 workers per room, a range of roughly 66x. Assume 0.30 staff per room and a 20% local hiring ceiling and the threshold at which dormitory Capex becomes necessary is 1.5 workers per room — with 7 of the 20 catchments below it.
In the 100-room model the impact is 0.18–0.66pt of GOP yield, or ¥153–¥590 per occupied room-night. Flex the assumptions and it stays within 0.49–0.80pt, so the conclusion is robust. And the higher the rate, the smaller that impact becomes.
That half a point or so is a design variable if it is priced in beforehand, and a gap that appears afterwards if it is not. Alongside land price, floor-area ratio and disaster risk, the labor catchment ratio is worth adding as a line item in site evaluation.
Related reading
- Tokyo Bay 2040: Dual-Growth Zones for Hotel Investment (+23.8%)
- Japan Hotels: 1,968 Skilled Foreign Workers, 1.55 per 1,000 Rooms
- Snow as Cost or Asset: Winter RevPAR 53% vs Winter ADR 2.66x
References and Sources
■ Data sources
Resident population, age structure and 2040 projections come from MLIT’s National Land Numerical Information 250m mesh future population projections, aggregated in concentric circles of 5km radius around each location’s coordinates (20 catchments). Room counts are built up from the property master we maintain, covering properties in operation as of 2026 based on opening and closing dates. Establishments and workers are from the 2021 Economic Census for Business Activity, aggregated within a 1km radius. Estimated settled ADR is an estimate derived by applying segment-specific adjustments to published OTA prices, using monthly medians over the past 12 months.
■ Modeling assumptions
Staffing requirement = rooms × 0.30 workers/room (sensitivity 0.25–0.35); local hiring ceiling = catchment working-age population × 20% (sensitivity 10–30%); one dormitory unit per person. The build-and-own case uses wood-frame construction at 25m² per unit and ¥7.0 million per unit, depreciated over a 22-year useful life, plus ¥200,000 a year in maintenance; the leasing case uses prefectural private rental rents from the Housing and Land Survey with a 70% employer share. The revenue model takes 100 rooms, ADR ¥30,000 (tax-exclusive equivalent), OCC 65% (a full-year assumption), non-room revenue at 35%, a GOP margin of 30% and total investment of ¥4.0 billion as base assumptions, with GOP yield defined as GOP ÷ total investment. Land cost is excluded, assuming construction within an existing site.
■ Limitations and caveats
The 5km radius is a mechanical concentric aggregation, and the real commuting zone shifts with the road network, public transport and winter accessibility. Because commuters from outside the catchment and seasonal workers are treated uniformly as requiring housing, the required unit count may be overstated. The 2040 projection is a rate of change on total population, not a projection limited to working-age population. Employment data has uneven coverage, and locations returning no coverage (Miyakojima-Hirara) are not used as evidence of labor supply. OCC and ADR are modeling assumptions and estimates rather than confirmed results; this is a simplified analysis, and actual investment decisions require a detailed feasibility study.
■ Market data
- MetroEngines Research & Consulting — room and property counts within a 5km radius (aggregated as of each year-end from opening and closing dates in the property master, N=20 catchments), estimated settled ADR (by city, past 12 months)
■ Government statistics and public data
- MLIT National Land Numerical Information (250m mesh future population projections, R6 National Institute estimate) — resident population, age structure and 2040 projections within a 5km radius
- MIC & METI “Economic Census for Business Activity” (2016) — ryokan and hotels: 18,447 establishments, 476,731 workers, 991,925 rooms (table ID: 0003215481)
- MIC & METI “Economic Census for Business Activity” (2021) / boundaries = 2020 Census small areas (e-Stat Statistical GIS) — establishments and workers within a 1km radius
- MLIT “Construction Starts Statistics” — planned construction cost and floor area for residential-only buildings (table ID: 0003114490, 2019–2024)
- Statistics Bureau of Japan “2023 Housing and Land Survey” — monthly rent for privately rented housing by prefecture (table ID: 0004021479, excluding zero-rent units)
- Japan Tourism Agency, White Paper on Tourism 2026 — survey of 522 lodging facilities, 72.2% short of staff
■ REIT and industry materials
- Invincible Investment Corporation, portfolio disclosure — 38.9% GOP across 91 managed properties (fiscal period ended December 2024), the reference point for this article’s GOP margin assumption
- Nikkei, “70% of lodging facilities short of staff; tourism white paper points to need for capital investment” (10 July 2026)
- Ieul Land Utilization, “Apartment construction cost is not just tsubo rate × tsubo” — market tsubo rates for wood-frame apartments (regional cities ¥600,000–800,000, Tokyo ¥900,000–1,100,000)