

In hotel development, the first variable to be fixed is often neither location nor price tier but room count. Site size and permitted floor area come first, and the number of rooms is back-calculated from them. Yet few studies measure, across Japan’s entire operating stock, how that room count actually affects rates and demand absorption. This article takes room-count band (property scale) as the unit of analysis and links scale to rates and inventory absorption using observed data.
First, how this differs from earlier work. Previous analyses that split the market by price tier (ADR band) or by area both asked “which price tier or location has an open gap.” Our earlier study of inventory absorption speed by property size ranked sell-through rates for the Obon peak across seven prefectures. This article layers two further axes on top — rates (estimated settled ADR) and ownership composition on the capital-markets side — and rebuilds the question of “how many rooms to build” across operating stock in all 47 prefectures. Where studies of the size distribution of new openings address the supply side, this article looks at what existing operating stock actually sells for and how it absorbs demand.
Metric Definitions Used in This Article
- ADR (Average Daily Rate): An estimated settled rate (tax-excluded equivalent) calculated by applying property-type correction factors to the lowest published plan level on OTAs and other channels (per room, 2 guests, tax-included). Checked against property-level results disclosed by listed hotel REITs (91 properties, most recent 3 months), the median error is about 7%. These are estimates and differ from each property’s actual settled rates and accounting figures. ADR by size band is the median of properties in the band (the level of a typical property in that band).
- LT (Lead Time): Days until check-in; LT0 is the day of arrival. This article uses observations within LT90 only.
- Remaining-room ratio: Rooms still available as sales inventory on OTAs and other channels as a share of each property’s total rooms (a room-based estimate). Only band-level medians are used; individual property values are not disclosed. This is an estimate based on inventory sold via OTAs and other channels and differs from the property’s actual occupancy.
- Early sell-out rate: Share of properties whose remaining rooms first reached zero at LT14 or earlier.
- OTA allocation: Maximum inventory observed on OTAs and other channels during the observation period as a share of total rooms. This article only aggregates properties whose allocation is 30% or more of total rooms.
- Data sources: MetroEngines Research & Consulting / MLIT Real Estate Information Library / REIT ownership master (as of August 31, 2026)
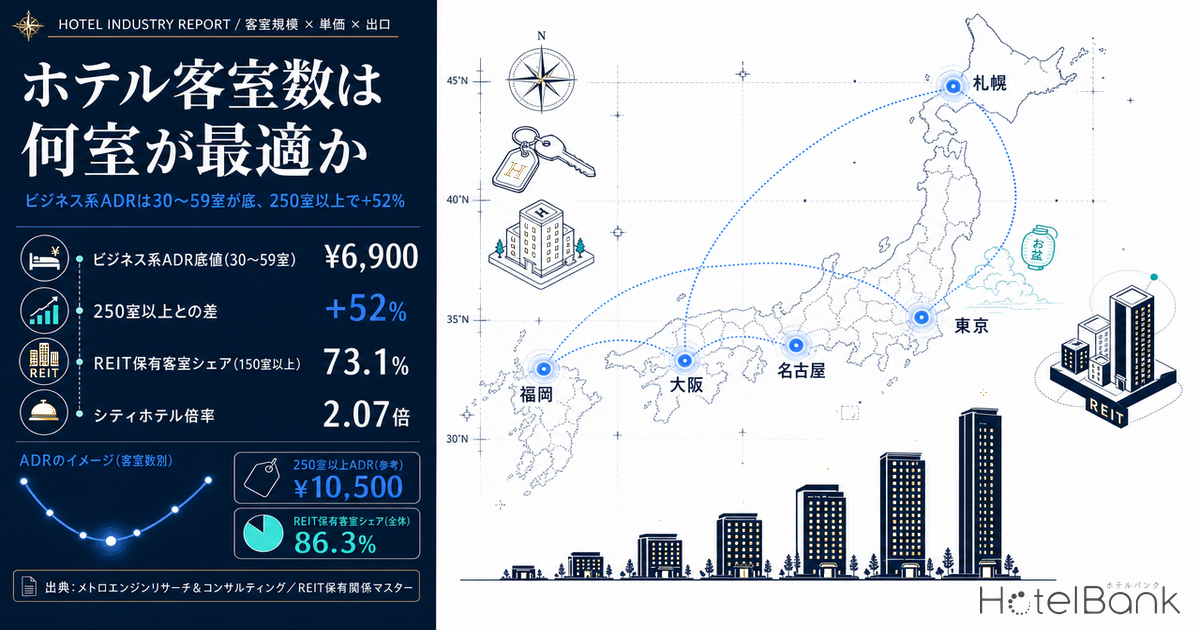
- — Business hotels’ median estimated settled ADR bottoms out at ¥6,900 in the 30–59 room band; properties with 250+ rooms reach ¥10,500, +52%. The direction of the scale–rate relationship only becomes visible once property type is held constant.
- — City hotels widen 2.07x, from ¥9,500 at 60–99 rooms to ¥19,700 at 250+ rooms, while ryokan stay within ¥14,800–16,600, almost independent of size. The effect of scale varies greatly by property type.
- — Large properties absorb inventory faster at every lead-time snapshot. The median remaining-room ratio at LT60 was 66.7% for 1–9 rooms versus 41.7% for 250+ rooms (August 15, 2026 arrival).
- — Dispersion within a size band is larger for smaller properties. The interquartile range of the LT7 remaining-room ratio was 66.7pt for 1–9 rooms versus 21.0pt for 250+ rooms. Outcomes are less predictable the smaller the property.
- — 86.3% of rooms held by seven listed hotel REITs are in 100+ room properties, and 73.1% in 150+ room properties. Only a narrow range of sizes has a deep pool of exit buyers (301 domestic properties, 52,362 rooms, as of August 31, 2026).
Japan’s Stock Splits: Small Properties by Count, Large Properties by Rooms
We start with the population. Within the coverage of MetroEngines Research, 27,162 lodging properties with 1,266,919 rooms are confirmed to be operating nationwide. Split by room-count band, the picture looks completely different depending on whether you count properties or rooms.
By property count, 1–9 room properties number 9,055 (33.3%) and 10–29 room properties 8,424 (31.0%), so 64.3% of all properties have fewer than 30 rooms. By room count, however, this sub-30 segment holds only 14.7% of the total. Conversely, properties with 150+ rooms number just 2,275 (8.4%) yet account for 559,405 rooms — 44.1% of the total. Counting the market by properties or by rooms gives opposite pictures.
This asymmetry feeds directly into development decisions. Most of the competitors listed in a business plan are small properties, while nearly half of the rooms actually in operation are supplied by large ones. The same count-versus-rooms divergence appears on the new-supply side; our breakdown of 2026 openings by both number of properties and number of rooms offers a point of comparison. Below, we measure rates and inventory absorption for each size band.
Estimated Settled ADR Traces a U-Curve Against Size — Bottoming Around 100 Rooms
Next, rates. For the three months of May–July 2026, we aggregated by size band the 6,856 properties for which estimated settled ADR could be calculated. The all-type median falls steadily from ¥15,900 at 1–9 rooms to ¥8,900 at 100–149 rooms, then turns back up to ¥12,700 at 250+ rooms. A clean U-shape.
This U-curve, however, should not be read as “rates are hard to achieve at around 100 rooms.” The mix of property types differs completely across size bands. In the 1–9 room band the leading types are vacation rentals, ryokan, and pensions; from 100 rooms up, business hotels and city hotels dominate. The high figures on the small end are not “high because small” — they largely reflect a composition effect, with ryokan and resorts concentrated among small properties.
Holding Property Type Constant, Business Hotels Become “Bottom at 30–59 Rooms, Higher the Bigger”
So we look again with property type fixed. Taking business hotels alone, the median bottoms at ¥6,900 in the 30–59 room band (n=441), then rises monotonically: ¥7,400 at 60–99 rooms, ¥8,100 at 100–149, ¥9,300 at 150–249, and ¥10,500 at 250+. The gap from the floor to the largest band is +52%. The left side of the all-type U-curve was a composition effect, but the rise on the right side persists even with property type held constant.
For city hotels the slope is even steeper: ¥9,500 at 60–99 rooms versus ¥19,700 at 250+ rooms, a 2.07x gap. Ryokan, by contrast, were almost unrelated to size: ¥14,800 at 10–29 rooms, ¥15,900 at 30–59, and ¥16,600 at 150–249 — every band falls within ¥14,800–16,600. The implication is that the power of scale to lift rates differs greatly by property type.
| Property type | 1-9 rooms | 10-29 rooms | 30-59 rooms | 60-99 rooms | 100-149 rooms | 150-249 rooms | 250+ rooms |
|---|---|---|---|---|---|---|---|
| Business hotel | ¥9,480 n=56 | ¥7,311 n=360 | ¥6,896 n=441 | ¥7,392 n=380 | ¥8,092 n=442 | ¥9,334 n=467 | ¥10,462 n=106 |
| City hotel | — | ¥9,942 n=41 | ¥11,304 n=61 | ¥9,540 n=82 | ¥11,362 n=90 | ¥14,062 n=111 | ¥19,702 n=63 |
| Resort hotel | ¥26,526 n=103 | ¥14,500 n=283 | ¥14,054 n=202 | ¥15,251 n=126 | ¥17,027 n=49 | ¥13,943 n=66 | ¥14,688 n=30 |
| Ryokan | ¥15,406 n=872 | ¥14,835 n=1581 | ¥15,893 n=521 | ¥15,108 n=167 | ¥14,955 n=74 | ¥16,565 n=34 | — |
The rise for business hotels is not confined to metropolitan areas. In the three major metropolitan areas (Tokyo, Osaka, Aichi, Kanagawa, Kyoto, Hyogo, Saitama, Chiba), the median goes from ¥8,400 at 30–59 rooms to ¥12,400 at 250+ rooms, +48%; in the rest of the country it goes from ¥6,600 to ¥9,100, +38%. The levels differ, but the direction is the same. Larger properties tend to occupy prime sites in front of stations and in city centers and skew toward higher grades and brands, so the gap is a composite that includes location and product differences. Still, a relationship of “bigger means lower rates” is observed in neither market.
Large Properties Absorb Inventory Faster; Small Properties Vary More
After rates comes demand absorption. For the August 15, 2026 arrival date (the Saturday of the Obon peak), we tracked the median remaining-room ratio by size band from LT60 to LT3 for 11,914 properties whose OTA allocation is 30% or more of total rooms. The population covers all 47 prefectures: of the 20,223 properties with inventory data, those meeting the allocation condition. For how much of their total rooms properties release to external channels in the first place, our earlier study measuring inventory allocation ratios across 12,941 properties shows the distribution.
At LT60, the median remaining-room ratio was 66.7% for 1–9 rooms and 41.7% for 250+ rooms, a 25.0-point gap. The ordering holds at every snapshot: LT30 (50.0% vs. 33.6%) and LT7 (33.3% vs. 21.6%). August 15 is one of the most demand-concentrated days of the year, but the same direction was reproduced on July 11 (an ordinary Saturday). At LT7 for July 11, 1–9 rooms stood at 33.3% versus 11.9% for 250+ rooms — the gap actually widens.
One caution: speed of absorption and “ease of selling out” point in opposite directions. The early sell-out rate — the share of properties whose remaining rooms first hit zero at LT14 or earlier — is higher the smaller the property: 42.0% for 1–9 rooms and 30.0% for 10–29 rooms, against just 6.0% for 250+ rooms. This is less a difference in demand strength than a matter of inventory granularity. A property with only a few rooms on sale exhausts its denominator with a handful of bookings. Comparing sell-out frequency across properties of different sizes does not measure demand strength.
More important for development decisions is the dispersion of outcomes. Taking the interquartile range of the LT7 remaining-room ratio within each band, 1–9 rooms reaches 66.7 points while 250+ rooms is only 21.0 points. The smaller the property, the more a single size band mixes properties that are nearly sold out with properties that are more than half empty. Indeed, the share of properties with 50% or more of total rooms still unsold at LT7 was 38.3% for 1–9 rooms but 8.3% for 250+ rooms.
| Room-count band | Properties | Median rooms | Main types | Median ADR | LT30 remaining | LT7 remaining | Early sell-out rate | LT7 dispersion |
|---|---|---|---|---|---|---|---|---|
| 1-9 rooms | 4,726 | 5 | Vacation rentals, ryokan | ¥15,887 | 50.0% | 33.3% | 42.0% | 66.7pt |
| 10-29 rooms | 3,358 | 15 | Ryokan, business hotels | ¥12,932 | 42.1% | 28.6% | 30.0% | 38.0pt |
| 30-59 rooms | 1,397 | 40 | Ryokan, business hotels | ¥11,191 | 37.8% | 26.2% | 20.8% | 29.6pt |
| 60-99 rooms | 819 | 79 | Business hotels, ryokan | ¥9,167 | 36.2% | 25.8% | 17.3% | 26.4pt |
| 100-149 rooms | 686 | 120 | Business hotels, city hotels | ¥8,904 | 37.0% | 24.0% | 12.8% | 23.5pt |
| 150-249 rooms | 711 | 188 | Business hotels, city hotels | ¥10,270 | 36.5% | 24.6% | 11.1% | 24.5pt |
| 250+ rooms | 217 | 322 | Business hotels, city hotels | ¥12,748 | 33.6% | 21.6% | 6.0% | 21.0pt |
Working Back from the Exit: Institutional Demand Concentrates in 150+ Room Properties
The other constraint on scale is the exit. From the ownership master of seven listed hotel REITs (Ichigo Hotel REIT (いちごホテルリート投資法人), Invincible Investment (インヴィンシブル投資法人), Nippon Hotel & Residential Investment (日本ホテル&レジデンシャル投資法人), Japan Hotel REIT (ジャパン・ホテル・リート投資法人), Hoshino Resorts REIT (星野リゾート・リート投資法人), Mori Trust REIT (森トラストリート投資法人), and Kasumigaseki Hotel REIT (霞ヶ関ホテルリート投資法人)), we aggregated by size band the 301 domestic properties and 52,362 rooms whose room counts are known (as of August 31, 2026).
The result is clear. The median held property has 140 rooms, and on a room basis 73.1% are in 150+ room properties and 86.3% in 100+ room properties. There are zero 1–9 room holdings, and only 6 properties in the 10–29 room band (0.3% of rooms). The sub-30 room segment, which holds 14.7% of rooms in the national stock, is virtually absent from listed REIT portfolios.
The median acquisition price per room also rises with scale: ¥14.4M for 60–99 rooms, ¥18.4M for 100–149 rooms, ¥22.8M for 150–249 rooms, and ¥32.9M for 250+ rooms (the ¥50.8M figure for the 30–59 room band sits in a different range because it includes high-priced ryokan and resorts). Listed REITs are not the only exit, but the implication is worth noting: plan outside the size bands where institutional buying demand is deep, and potential buyers at sale narrow to operating companies and private funds. The level of capital expenditure required after acquisition, compiled per room from five REITs’ IR disclosures, is another factor to weigh alongside the exit.
| Room-count band | Properties nationwide | Nationwide room share | REIT properties | REIT room share | Acquisition price / room (median) |
|---|---|---|---|---|---|
| 1-9 rooms | 9,055 | 3.5% | 0 | 0.0% | — |
| 10-29 rooms | 8,424 | 11.2% | 6 | 0.3% | — |
| 30-59 rooms | 3,548 | 11.7% | 35 | 3.0% | ¥50.8M |
| 60-99 rooms | 2,200 | 13.5% | 66 | 10.5% | ¥14.4M |
| 100-149 rooms | 1,660 | 15.9% | 55 | 13.2% | ¥18.4M |
| 150-249 rooms | 1,626 | 24.3% | 86 | 31.0% | ¥22.8M |
| 250+ rooms | 649 | 19.8% | 53 | 42.0% | ¥32.9M |
Prefectures Where Large Properties Cluster, Prefectures Carried by Small Ones — Location and Scale Are Decided Together
The choice of scale cannot be separated from location. Looking by prefecture at the share of rooms in properties with 100+ rooms, it is high in major metropolitan areas: Tokyo 80.1%, Osaka 77.5%, Fukuoka 73.9%, Chiba 73.5%, and Aichi 72.4%. Conversely, in some prefectures small properties provide most of the room supply: Nagano 25.4%, Yamanashi 29.9%, Tokushima 35.9%, and Nara 36.7%.
When planning a large development in a prefecture with a low share of large properties, two readings are possible: that competition is thin, and that the depth of demand to absorb that scale has not been proven. Just as the slope of ADR by size band differed by property type, “bigger is better” cannot be applied uniformly across the country here either.
How Many Rooms to Build — Translating Rate Gaps into Annual Room Revenue
Let us restate these observations in a form that fits a business plan. For a regional business hotel, the rate gap between choosing 30–59 rooms (¥6,600) and 150–249 rooms (¥8,800) is about ¥2,200 per room-night. Assuming 80% occupancy (a modeling assumption, full year) and 365 days, that equals a difference in room revenue of about ¥650K per room per year. In the three major metropolitan areas, the gap between 30–59 rooms (¥8,400) and 150–249 rooms (¥10,800) is about ¥2,400, equivalent to about ¥710K per room per year.
This restatement is a point estimate resting on a single set of assumptions, and both the ADR gap and occupancy carry a range at the planning stage. So for the scenario of moving a regional business hotel up one size band, from 30–59 rooms to 150–249 rooms, we placed the observed ADR gap (¥2,200) at the midpoint and re-ran it at ±30% of that value and at occupancy of 70–90% (both full-year modeling assumptions).
| Scenario | ADR gap (per room-night) | Occupancy (full year) | Annual difference per room | Annual difference at 100 rooms |
|---|---|---|---|---|
| Pessimistic | ¥1,600 | 72% | ¥420K | ¥42.05M |
| Base | ¥2,200 | 80% | ¥642K | ¥64.24M |
| Optimistic | ¥2,800 | 88% | ¥899K | ¥89.94M |
Viewed on two axes, the range becomes even clearer. The table below shows the annual room-revenue difference per room (¥ thousand) when varying the ADR gap and occupancy. The shaded cell is the base case. Even the most conservative combination reaches the ¥400K range per year, confirming that the effect of moving up one size band does not disappear merely through the choice of assumptions.
| ADR gap \ Occupancy (full year, modeling assumption) | 70% | 75% | 80% | 85% | 90% |
|---|---|---|---|---|---|
| ¥1,600 | 409 | 438 | 467 | 496 | 526 |
| ¥1,900 | 485 | 520 | 555 | 589 | 624 |
| ¥2,200 | 562 | 602 | 642 | 683 | 723 |
| ¥2,500 | 639 | 684 | 730 | 776 | 821 |
| ¥2,800 | 715 | 767 | 818 | 869 | 920 |
This is a rough room-revenue-based restatement; in practice, economies of scale in labor and utilities, whether breakfast is served, and brand fees all come into play. Even so, it is worth recognizing that the effect of moving up one size band operates not on the order of “a few hundred yen in rate” but on the order of “hundreds of thousands of yen per room per year.”
On the construction side, meanwhile, the cost of adding scale keeps rising. According to MLIT’s Building Starts Statistics, hotel construction cost per tsubo (approx. 3.3 m²) rose 41% in two years, from ¥1.383M in 2022 to ¥1.950M in 2024. An earlier HotelBank study that back-calculated per-room floor-area ratios from planning data estimated construction cost at ¥20.67M per room. That is close to the median REIT acquisition price per room seen above (¥22.8M for 150–249 rooms), which also means that the economics of building new and of acquiring are converging.
Under 30 rooms — high rates, but wide range of outcomes
Median ADR is high, but this includes a composition effect from the concentration of ryokan, vacation rentals, and resorts. The interquartile range of the LT7 remaining-room ratio is large at 38.0–66.7 points, so outcomes split widely within the same size band. It can be started with a small investment, but revenue predictability is the lowest of any segment.
30–99 rooms — the lowest business-hotel rates
Business hotels’ median estimated settled ADR forms a floor at ¥6,900 for 30–59 rooms and ¥7,400 for 60–99 rooms. At this scale it is hard to add full service and hard to capture the location advantages of large properties. Choosing this band calls for a design that creates an edge on construction and operating costs rather than on rates.
100+ rooms — rates, absorption and exit line up
Business-hotel ADR rises monotonically from ¥8,100 at 100–149 rooms to ¥10,500 at 250+ rooms. LT7 remaining-room ratios are also low, and within-band dispersion is the smallest at 21.0–23.5 points. 86.3% of REIT-held rooms are concentrated in this band, so the pool of potential exit buyers is also the deepest.
Limitations of This Analysis
Three points should be made explicit. First, the relationship between scale and ADR is not causal. Large properties tend to sit on prime sites in front of stations and in city centers and to carry higher-grade brands, so the observed rate gaps incorporate differences in location and product. They do not show the difference you would get by building on the same site with only the room count changed.
Second, the remaining-room ratio is an estimate based on published inventory on OTAs and other channels and differs from a property’s actual occupancy. The higher a property’s share of direct sales, corporate contracts, and groups, the larger the gap between absorption of published allocation and actual occupancy. We limited the analysis to properties whose allocation is 30% or more of total rooms to contain this effect, but it cannot be eliminated entirely.
Third, the inventory snapshots cover only two arrival dates: August 15 and July 11, 2026. We confirmed that the same direction was reproduced on both dates, but this does not represent the full-year picture including weekday and winter demand.
Summary
Scale affected all four axes: rates, absorption, dispersion, and exit. With property type held constant, business hotels’ estimated settled ADR rises +52% from a floor of ¥6,900 at 30–59 rooms to ¥10,500 at 250+ rooms, and city hotels widen 2.07x from 60–99 rooms to 250+ rooms. Ryokan, on the other hand, stay within a ¥14,800–16,600 range, with scale and rate barely linked.
Large properties absorb inventory faster at every lead-time snapshot, and within-band dispersion is larger for smaller properties. Looking only at sell-out frequency gives the opposite impression, but that is an artifact of the small denominator of published allocation. And at the exit, 86.3% of rooms held by listed REITs are concentrated in 100+ room properties.
There is no single right answer to “how many rooms to build.” But nationwide observations confirm that moving up one size band simultaneously lifts rates, predictability, and depth of exit demand — and that the magnitude of the effect differs greatly by property type. The room count in a business plan should be tested not only by back-calculation from the site’s permitted floor area but also against these three axes.
Related Articles
- Do Big Hotels Fill Last? 200+ Rooms Lead by 25.8pt at LT90
- Median 39.2% of Rooms Online — Allocation Across 12,941 Hotels
- Japan 2026: 1,242 Openings, 33,749 Rooms — 47% Villas, 42% Business
- Miyazaki & Saga Hotel Investment Whitespace: Zero Hotels at ¥18-25k
References and Sources
■ Data Sources
Inventory is based on observations of published inventory on OTAs and other channels across all 47 prefectures (August 15, 2026 arrival n=11,914 properties / July 11, 2026 arrival n=13,266 properties, limited to properties whose allocation is 30% or more of total rooms). Rates are estimated settled ADR (May–July 2026, n=6,856 properties). Property and room stock is 27,162 properties and 1,266,919 rooms on a confirmed-operating basis. The exit side uses the ownership master of seven listed hotel REITs (snapshot as of August 31, 2026; 301 domestic properties, 52,362 rooms).
■ Modeling Assumptions
All figures by size band are medians, not means. The annual room-revenue difference is a rough restatement on a room-revenue basis assuming 80% occupancy (full year), 365 days, per room, and excludes economies of scale in labor and utilities, whether breakfast is offered, and brand fees. The sensitivity analysis varies the ADR gap by ±30% of the observed value and occupancy across 70–90% (full year). Aggregates by property type show only bands where each cell has n≥20.
■ Limitations and Notes
The scale–ADR relationship is not causal; it is a composite observation that includes differences in location, grade, and brand. The remaining-room ratio is an estimate based on published inventory on OTAs and other channels and differs from a property’s actual occupancy. Inventory snapshots are limited to two arrival dates, August 15, 2026 and July 11, 2026, and do not represent the full year including weekday and winter demand. In the REIT ownership master, a digit misalignment was found in the source room-count field for Kasumigaseki Hotel REIT (霞ヶ関ホテルリート投資法人) (15 properties); this article re-aggregated using that REIT’s actual property-level room counts (726 rooms in total) and excluded it from the calculation of the median acquisition price per room.
■ Market Data
- MetroEngines Research & Consulting — Estimated settled ADR (n=6,856 properties, May–July 2026), room-based remaining-inventory trends (n=11,914 properties, August 15, 2026 arrival / n=13,266 properties, July 11, 2026 arrival), property and room stock on a confirmed-operating basis (27,162 properties, 1,266,919 rooms)
- REIT ownership master — 301 domestic properties and 52,362 rooms held by seven listed hotel REITs (snapshot as of August 31, 2026)
■ Government Statistics and Public Data
- Ministry of Land, Infrastructure, Transport and Tourism (MLIT), Building Starts Statistics — Hotel construction cost per tsubo (¥1.383M in 2022 → ¥1.950M in 2024)
- MLIT Real Estate Information Library
■ REIT and Industry Reports
- JLL, “Japan Hotel Investment Market” (new supply limited by soaring construction costs; 2026 Asia Pacific hotel investment forecast of US$13.3 billion)
- Travel Voice, “Latest trends in Japan’s hotel market: relatively cheap by global comparison, new hotel supply limited by soaring construction costs — JLL” (December 8, 2025, in Japanese)
- HotelBank, “How Much Does Hotel Construction Cost? Per-Tsubo Benchmarks and Cost Comparison by Construction Method” (in Japanese)