

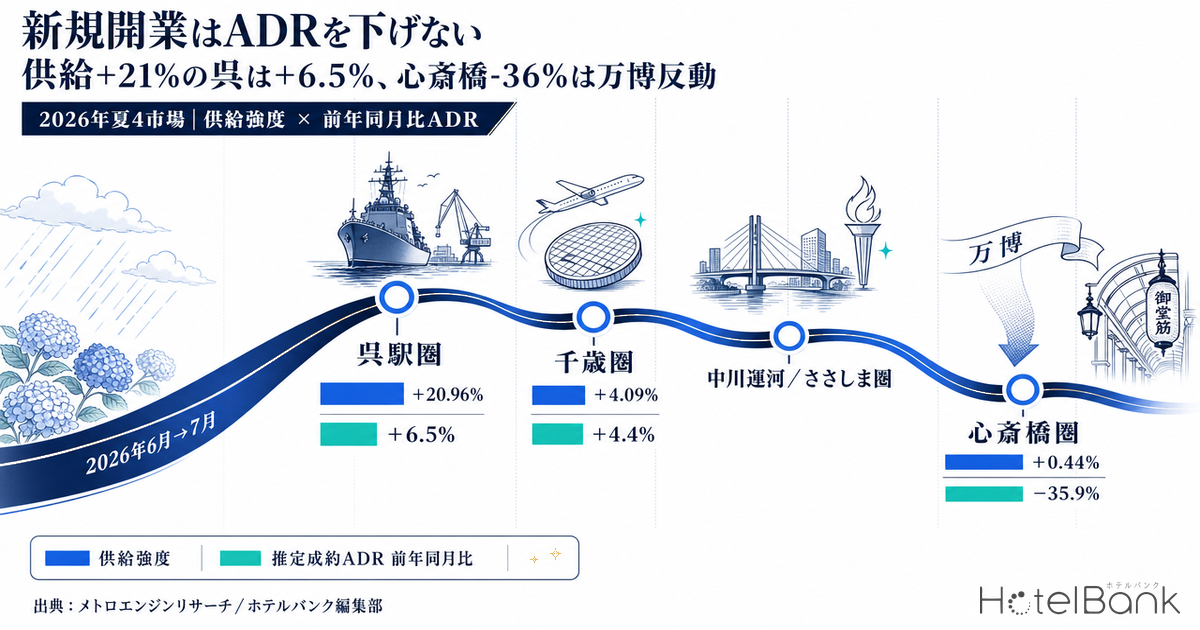
In the early summer of 2026, four markets with completely different characters each received one new hotel in the mainstream-demand tier (economy to upper-midscale): 223 rooms in Shinsaibashi, 142 in Chitose, 24 along the Nakagawa Canal in Nagoya, and 218 in Kure. They also share a common timing — all opened just before summer-holiday demand ramps up. Did these four properties push down the ADR of the existing hotels around them? Two to three months on, confirmed results now allow us to check. We read these same four properties through their grade differences before they opened; the confirmed numbers now let us measure how far that advance read diverged from what actually happened. The short answer: in Kure, where the supply impact was largest (+21.0% of existing room stock), surrounding ADR rose 6.5% year on year, while in Shinsaibashi, where the impact was smallest (+0.44%), it fell 35.9%. The ordering is cleanly inverted.
Metric Definitions Used in This Article
- ADR (average daily rate): An estimated settled rate (tax-excluded equivalent) calculated by applying a segment-specific adjustment coefficient to the lowest published plan level each property lists on OTAs (double occupancy, per-room rate, tax included). Cross-checked against property-level results disclosed by listed hotel REITs (91 properties, most recent three months), the median error is about 7%. These are estimates and differ from each property’s actual transacted rates and accounting figures. Area-level ADR is the median of the properties covered (the level of a typical property in that area).
- OCC (occupancy): Rooms sold as a share of total rooms in the area (an estimate based on OTA sales inventory). Used at the prefectural level only.
- Supply intensity: A proprietary metric for this article. The room count of a newly opened hotel divided by the room count that already existed in its catchment area (excluding the new rooms). It expresses “how big this opening is for that particular market.”
- Confirmed vs provisional months: Results through July 2026 are confirmed. August 2026 onward are estimates based on listed rate levels at the time of the survey and will move. The verification section of this article uses confirmed months only (June and July).
- Data source: MetroEngines Research
- — The Kure Station catchment had the largest supply intensity (+20.96% of existing rooms), and its July 2026 ADR was +6.5% year on year. Shinsaibashi, with the smallest supply (+0.44%), came in at -35.9%. The ordering is inverted.
- — The Shinsaibashi decline reflects normalisation from the Expo 2025 period (April-October 2025), not supply. Osaka Prefecture occupancy held high at 83.9% in June and 86.5% in July 2026 — this is a rate normalisation, not an occupancy trough.
- — All three of the new hotels with rate data landed above their catchment median (1.27x to 3.16x). They are not fighting over the same price band as existing hotels; if anything they lift the ceiling on local rates.
- — In practice, if supply intensity is below 1%, there is almost no reason to change pricing strategy. Count the demand calendar (Expo payback, semiconductor investment, defence-base development, international games) before the opening calendar.
Four Openings in Early Summer 2026 — The Mainstream-Demand Lineup
First, let us fix the scope. None of these are high-end luxury projects; all are mainstream-demand hotels that live on occupancy. Two details differed from the initial assumption once verified on the ground. The Gate Hotel Osaka by HULIC is not in front of Osaka Station but directly connected to the north ticket gate of Shinsaibashi Station on the Osaka Metro, and Toyoko Inn Kure-eki opened not in June but on 3 July 2026. The table below is confirmed information from each operator’s published materials.
| Hotel | Opening date | Location | Rooms | Price positioning |
|---|---|---|---|---|
| The Gate Hotel Osaka by HULIC | 15 June 2026 | Directly connected to the north gate of Shinsaibashi Station, Osaka Metro (floors 16-28) | 223 | Upper-midscale to upscale |
| Comfort Hotel Chitose | 15 June 2026 | About 6 min walk from JR Chitose Station west exit; about 7 min by JR to New Chitose Airport | 142 | Economy (limited service) |
| Setre Canal Nagoya | 18 June 2026 | Ungacho, Nakagawa Ward, Nagoya; about 5 min walk from Sasashima-raibu Station | 24 | Lifestyle midscale |
| Toyoko Inn Kure-eki | 3 July 2026 | About 3 min walk from the south exit of JR Kure Station (largest room count in Kure) | 218 | Economy (limited service) |
Source: Compiled by the HotelBank Editorial Team from each company’s published materials (press releases and official websites)
Together the four total 607 rooms. On a national scale that is a small number, but the total is not what matters. The same “one opening” means something entirely different depending on how large the market receiving it is. That is what we count next.
Supply Intensity Varies by a Factor of 160 — Kure at +21.0%, Sasashima at +0.13%
Taking each hotel’s coordinates as the centre, we mechanically counted the existing room stock around it. The radius is 1.5 km as a walking-competition catchment, with Chitose alone set at 5 km given its airport and industrial character. The newly opened rooms are excluded from the denominator.
| Catchment | Radius | Existing hotels | Existing rooms | New rooms | Supply intensity |
|---|---|---|---|---|---|
| Kure Station (Toyoko Inn Kure-eki) | 1.5 km | 34 | 1,040 | 218 | +20.96% |
| Chitose (Comfort Hotel Chitose) | 5.0 km | 47 | 3,472 | 142 | +4.09% |
| Shinsaibashi (The Gate Hotel Osaka by HULIC) | 1.5 km | 577 | 50,758 | 223 | +0.44% |
| Nakagawa Canal / Sasashima (Setre Canal Nagoya) | 1.5 km | 153 | 18,170 | 24 | +0.13% |
Source: MetroEngines Research (property master, based on properties with confirmed operation), compiled by the HotelBank Editorial Team
Supply intensity in the Kure Station catchment is +20.96%. Because the existing stock was only 1,040 rooms, adding 218 is the equivalent of one room in every five arriving at once. The Nakagawa Canal / Sasashima catchment, by contrast, is +0.13%. Within the 18,170-room depth of an area adjacent to Nagoya Station, 24 rooms are statistically close to noise. These are the same “four openings,” yet their size relative to their markets differs by roughly a factor of 160.
A single opening in isolation also misleads. Parallel moves in the same catchment need to be counted too. In the Shinsaibashi catchment, ten further properties totalling 1,019 rooms are confirmed for full-year 2026 beyond the four covered here (including openings scheduled for the second half). In the Chitose catchment, 198 rooms with a natural hot spring were added on 24 June and another 212 rooms on 7 August. Measured at the end of June, Chitose received two hotels and 340 rooms; through August, three hotels and 552 rooms — equivalent to +9.79% and +15.90% of existing rooms respectively. That makes Chitose the second most supply-concentrated area after Kure.
The Result — The More Supply a Market Took, the More Rates Rose
So what actually happened? For existing hotels (20 rooms or more) in each catchment, we compared the median estimated settled ADR with the same month a year earlier. Results through July 2026 are confirmed months, not listing snapshots.
| Catchment | Supply intensity | Jun 2025 | Jun 2026 | Jun YoY | Jul 2025 | Jul 2026 | Jul YoY |
|---|---|---|---|---|---|---|---|
| Kure Station | +20.96% | ¥5,564 | ¥5,520 | -0.8% | ¥5,488 | ¥5,844 | +6.5% |
| Chitose | +4.09% | ¥12,591 | ¥12,471 | -1.0% | ¥14,320 | ¥14,948 | +4.4% |
| Nakagawa Canal / Sasashima | +0.13% | ¥9,400 | ¥9,313 | -0.9% | ¥9,444 | ¥9,393 | -0.5% |
| Shinsaibashi | +0.44% | ¥15,249 | ¥10,003 | -34.4% | ¥15,950 | ¥10,216 | -35.9% |
Source: MetroEngines Research, compiled by the HotelBank Editorial Team (median estimated settled ADR of existing properties with 20 or more rooms in each catchment. N = 15-16 Kure / 16 Chitose / 72-76 Sasashima / 84-94 Shinsaibashi)
Source: MetroEngines Research, compiled by the HotelBank Editorial Team
Ordered by supply intensity, the July year-on-year changes read +6.5%, +4.4%, -0.5% and -35.9%. Only the two markets with the heaviest supply are positive, and only Shinsaibashi, with almost no supply, is sharply negative — the exact opposite of intuition. With a sample of four markets this is not a claim of statistical causation, but the simple picture in which “markets that receive new openings see rates fall” does not hold in this summer’s actual data. Our review of supply pressure against rates across all 47 prefectures, Does New Hotel Supply Cut ADR?, reached the same conclusion: supply depresses rates only in prefectures where the existing stock is thin.
The reason is clear. What moves area rates is not the supply side but the demand side. Below we break the four markets down one at a time.
Shinsaibashi — Rates Fell Because Last Year Was Exceptional, Not Because of Supply
The median for existing hotels in the Shinsaibashi catchment moved from about ¥16,000 in July 2025 to about ¥10,200 in July 2026, a 35.9% year-on-year decline. That move cannot be explained by 223 new rooms. Those 223 rooms are 0.44% of the existing 50,758; supply on that scale cannot move a market median by a third.
Overlaying the years makes what happened obvious at a glance.
Source: MetroEngines Research, compiled by the HotelBank Editorial Team
The 2024 and 2026 curves sit in almost the same band, and only 2025 spikes from April through October. That window aligns exactly with Expo 2025 Osaka, Kansai (13 April to 13 October 2025). In other words, 2026 has not “fallen” so much as returned from an Expo-inflated level toward a normal year. The roughly ¥9,300 of June 2026 is on the low side even against June 2024, but that is a post-Expo payback observed across the wider Kansai region.
It is worth confirming that demand itself has not thinned. Occupancy across Osaka Prefecture (estimated, based on OTA listed inventory) held high at 83.9% in June 2026 and 86.5% in July (covering 695-698 properties, about 110,000 rooms). Rooms are filling; what has come off is the Expo-period price premium. This is a rate normalisation, not an occupancy trough.
The cross-prefecture picture supports the same reading. For July 2026, estimated settled ADR year on year was -30.7% in Osaka against +1.4% in Hokkaido, -0.6% in Hiroshima, 0.0% in Fukuoka, -3.3% in Aichi and -4.8% in Tokyo. Setting Kansai aside (Kyoto -12.8%), the national picture is broadly flat.
Listed REIT disclosure points the same way. The July 2026 monthly results published by Invincible Investment Corporation (101 domestic hotels) show occupancy of 86.3% (as of July 2026, 101 domestic hotels, N = 101 properties), up 1.9 points year on year; ADR of ¥15,100, down 1.0%; and RevPAR of ¥13,039, up 1.2%. Across a national portfolio, occupancy is rising and rates are close to flat. Shinsaibashi’s -35.9% is not a sign of national oversupply but a figure to be read as an Osaka-specific event payback.
Source: Compiled by the HotelBank Editorial Team from Invincible Investment Corporation, “Monthly Operating Results for July 2026” (101 domestic hotels)
Kure — After the City’s Largest 218-Room Hotel Opened, Area Rates Went Up
Kure is the mirror image. Toyoko Inn Kure-eki, a 3-minute walk from the south exit of JR Kure Station, opened with 218 rooms, making it the largest hotel in the city by room count. The existing stock in its walking-competition catchment (1.5 km radius) is 34 properties and 1,040 rooms, giving a supply intensity of +20.96% — by far the largest of the four markets here.
Even so, the median for existing hotels in July, the month spanning the 3 July opening, was up 6.5% year on year (about ¥5,500 to about ¥5,800, N = 15 properties). June was also roughly flat at -0.8%, and there is no evidence that the arrival of 218 rooms broke prices in the surrounding market.
Source: MetroEngines Research, compiled by the HotelBank Editorial Team
This result shows how a large mainstream-demand opening often works as an expansion of the market rather than a division of it. Kure has tourism assets such as the Yamato Museum and the Kure Bay warship cruise, yet options for a large limited-service hotel near the station had been limited. Putting a meaningful block of rooms within a 3-minute walk of the station creates room to retain lodging demand that had been flowing to central Hiroshima instead. Some demand only materialises once there is somewhere to put it.
Kure also has a medium-term demand driver ahead. On 28 August 2026 the Ministry of Defense announced it had signed a contract to acquire the former Nippon Steel Kure works site, and will begin developing a multi-function defence complex covering warship maintenance and construction as well as disaster-response functions. The plan includes zones open to private-sector applicants; if realised, it would generate long-term business demand. Estimated ADR for the city of Kure from August 2026 onward has moved up into a ¥9,600-¥11,700 range, but these are provisional figures based on listed rate levels at the time of the survey, not confirmed results. They should be read only as an indication of direction.
Chitose — Semiconductor Demand Absorbed Three Hotels and 552 Rooms at Once
Chitose is the most supply-concentrated market in this set. Comfort Hotel Chitose (142 rooms) on 15 June was followed by a 198-room property with a natural hot spring on 24 June and another 212 rooms on 7 August. Against the existing 3,472 rooms within a 5 km radius, that is +9.79% through the end of June and +15.90% including August. The full picture of openings stacking up across Chitose and Tomakomai is set out in our analysis of the seven properties and 738 rooms opening in central Hokkaido in 2026.
Even so, the median for existing hotels held firm at -1.0% in June and +4.4% in July. July’s roughly ¥14,900 is the highest level among the four markets covered here.
Source: MetroEngines Research, compiled by the HotelBank Editorial Team
Behind this is the industrial cluster forming around the Rapidus next-generation semiconductor plant. Beyond construction workers, engineers and related companies from Japan and abroad continue to travel through, and semiconductor-related firms have opened one base after another in the city. Across Hokkaido as a whole, occupancy (estimated, based on OTA listed inventory) was extremely high at 89.3% in June 2026 and 92.3% in July (covering more than 1,900 properties across all segments in the prefecture). That three hotels came together in the same window is itself a sign of operator conviction about the depth of demand.
In fact, Comfort Hotel Chitose’s estimated settled ADR for July 2026 was about ¥18,900, roughly 27% above the surrounding existing-hotel median of about ¥14,900. Far from pulling the floor down, the new entrant is able to hold a higher price band. An economy-segment property can only take that position in a market where demand exceeds supply.
Nagoya — The Bigger Variable Than 24 Rooms Is September’s Asian Games
Setre Canal Nagoya is a 24-room lifestyle hotel where every room faces the Nakagawa Canal and the building includes a sauna. Its supply intensity is +0.13%, a scale that cannot affect the surrounding price structure. Consistent with that, the existing median in the Nakagawa Canal / Sasashima catchment was almost perfectly flat at -0.9% in June and -0.5% in July.
What matters in Nagoya is not the opening but the demand calendar. The 20th Asian Games (Aichi-Nagoya 2026) run for 16 days from 19 September to 4 October 2026, followed by the Asian Para Games. Estimated ADR in Nakamura Ward, which contains Nagoya Station, is tracking at about ¥18,000 in September against about ¥9,400 in July — roughly 1.9 times the level. Nakagawa Ward shows about ¥16,900 in September against about ¥8,200 in July.
Source: MetroEngines Research, compiled by the HotelBank Editorial Team
September onward is an estimate based on listed rate levels at the time of the survey, not a confirmed result. Even so, the ordering does not change: a 16-day international games is a variable orders of magnitude larger for Nagoya rates than a 24-room supply addition. This is a moment to read the demand calendar rather than the opening calendar.
Mapping Supply Density Across the Four Markets
The difference in “market depth” is hard to convey in numbers alone, so it is worth seeing on a map. Circle size is room count and colour represents the July 2026 estimated settled ADR level. The star marks each newly opened hotel.
Source: MetroEngines Research, compiled by the HotelBank Editorial Team
In Shinsaibashi and Sasashima the existing hotels are laid out as a continuous surface; in Kure and Chitose the density is low enough that the points can be counted. The same 200-room-class opening is buried in the existing cluster in the former and reshapes the skeleton of the market in the latter. That difference is why looking at national room totals tells you nothing when you are arguing about supply impact.
Where the Four New Hotels Actually Compete — Price Positioning
There is another reason supply does not feed through to rates: most new hotels are not fighting over the same price band as existing ones. Plotting room count on the horizontal axis and July 2026 estimated settled ADR on the vertical, we overlaid the existing hotels of all four markets.
Source: MetroEngines Research, compiled by the HotelBank Editorial Team
| New hotel | Estimated settled ADR, Jul 2026 | Catchment median | Vs median |
|---|---|---|---|
| The Gate Hotel Osaka by HULIC | ¥32,300 | ¥10,200 | 3.16x |
| Setre Canal Nagoya | ¥21,400 | ¥9,400 | 2.28x |
| Comfort Hotel Chitose | ¥18,900 | ¥14,900 | 1.27x |
Source: MetroEngines Research, compiled by the HotelBank Editorial Team (covering the three properties for which estimated settled ADR could be calculated)
All three sit above their catchment median. The Gate Hotel Osaka by HULIC is 3.16 times the Shinsaibashi median — it occupies a different price layer entirely. Setre Canal Nagoya, with 24 rooms and an all-inclusive design, is a different product from the limited-service hotels around it. Comfort Hotel Chitose is 1.27 times its median. New options appearing in a higher price band mean the ceiling has been lifted for existing hotels too. And indeed the existing medians in both Kure and Chitose rose after the openings.
Note that this price-position comparison covers the three properties for which an estimated settled ADR could be derived from listed rate data. For Toyoko Inn Kure-eki, the 218-room scale — the largest in Kure — is itself the biggest variable for that market, and its effect is what the catchment ADR trend in the previous section captures.
Practical Implications — Read the Demand Calendar Before the Opening Calendar
Three usable points emerge from this exercise for operators and investors of existing hotels.
1. Pre-emptively cutting rates in response to a nearby opening has weak support. Even in Kure, where supply intensity was +21.0%, surrounding ADR in the opening month was up 6.5% year on year. “A big hotel is opening nearby, so we should go cheap” is not supported by the actual data. Checking the catchment’s demand calendar first — events, industrial projects, games schedules — explains far more about rates.
2. When rates move sharply, suspect a prior-year special factor first. Shinsaibashi’s -35.9% came from the Expo period a year earlier, not from supply. When reading year-on-year figures, always check what happened in the denominator year. For Osaka and Kansai, April to October 2025 is a difficult comparison base, and running a parallel comparison against 2024 makes the underlying level much easier to see.
3. Measure supply intensity as a ratio, not an absolute number. 218 rooms and 223 rooms are nearly the same figure, yet one is a fifth of its market and the other is 0.44%. When assessing a new opening in your own catchment, putting the existing room count within a 1-1.5 km radius in the denominator makes it far easier to separate the projects worth worrying about from the ones that are not. As a rule of thumb, if supply intensity is below 1%, there is almost no reason to change pricing strategy.
And even when supply genuinely does thicken, there are moves available. Where new openings present a higher price band, as in Kure and Chitose, existing hotels gain headroom on rate. Timing investment decisions such as refurbishment or a stronger breakfast offer to the moment the ceiling rises is a sound approach.
Conclusion
For the four mainstream-demand hotels that opened in early summer 2026, verifying the estimated settled ADR of surrounding existing hotels in confirmed months (June and July) gives the following.
- The Kure Station catchment had the largest supply intensity (+20.96%) and July ADR of +6.5% year on year
- The Chitose catchment was second (+4.09%, or +9.79% for the three-hotel cumulative through end-June) at +4.4%
- The Nakagawa Canal / Sasashima catchment, with almost no supply (+0.13%), was flat at -0.5%
- The smallest, Shinsaibashi (+0.44%), was -35.9% — normalisation from the prior year’s Expo period
Despite opening at the same point in the calendar, just before the summer-holiday ramp, the outcomes differed completely by market. The premise that new supply suppresses area rates does not hold, at least across these four markets at this scale. What moves rates is not supply but structural demand factors: the Expo payback in Osaka, semiconductor investment in Chitose, defence-base development in Kure and an international games in Nagoya. Before chasing opening announcements, count what is creating demand in your own catchment — that is the ordering these four markets point to.
⚠ A note on ADR for future dates: The verification section of this article (June and July 2026) uses data from months whose results are confirmed. Figures shown for August 2026 onward (August-November for Kure, September-November for Nakamura and Nakagawa wards in Nagoya) are estimates based on rates published on OTAs at the time of the survey and will move as the check-in date approaches. Please note that they are not confirmed values.
On methodology: Existing hotels in each catchment were extracted mechanically as properties located within the radius around each new hotel’s coordinates (5 km for Chitose, 1.5 km elsewhere) with confirmed operation. ADR comparisons are limited to properties with 20 or more rooms, and medians are calculated only from properties for which rate data could be obtained. MetroEngines Research tracks approximately 168,000 properties in Japan, of which approximately 27,000 properties and 1.26 million rooms with confirmed operation on OTAs form the analysis set. Ryokan, minshuku and simple lodging houses not listed on OTAs are not included.
Related Reading
- Asian Games 2026: 1,500 Ship Rooms vs Nagoya’s 28,986-Room Stock
- Shiga Hotel Development: 1.5% New Supply, ¥11-16k Whitespace, 8.0% NOI
- Matsumoto ADR ¥13,400 vs ¥18,300 Ceiling: Absorbing 222 New Rooms
- Does New Hotel Supply Cut ADR? Only Below 13,000 Rooms, 47 Prefectures
- Chitose & Tomakomai Worker Lodging — 7 New Hotels, 738 Rooms in 2026
- Hiroshima 2026: 1,003 New Rooms, City Settled ADR Turns -4.1% in July
- Asian Games 2026: Toyohashi +18.7pt, Kuwana +14.4pt Beyond Nagoya
References and Sources
■ Data sources
Existing hotels located within the radius around each new hotel’s coordinates (5 km for Chitose, 1.5 km elsewhere) were extracted mechanically, and the median estimated settled ADR was calculated monthly for properties with 20 or more rooms for which rate data could be obtained. Area occupancy is an estimate based on OTA listed inventory (prefectural level). Room counts, opening dates and locations are confirmed from each company’s published materials and primary government and media sources. Listed REIT results come from each investment corporation’s monthly disclosure.
■ Calculation assumptions
Estimated settled ADR applies a segment-specific adjustment coefficient to the lowest published plan level each property lists on OTAs (double occupancy, per room, tax included), producing an estimated settled rate (tax-excluded equivalent). Area values use the median (the level of a typical property) rather than the mean. Supply intensity is defined as “rooms in the newly opened hotel divided by existing rooms in the same catchment (excluding the new rooms).” Verification uses only June and July 2026, whose results are confirmed; August 2026 onward is treated separately as a provisional estimate based on listed rate levels at the time of the survey.
■ Limitations and caveats
This covers a sample of four markets and does not claim a statistical causal relationship. ADR is an estimate; cross-checked against property-level disclosure by listed hotel REITs (91 properties, most recent three months), the median error is about 7%. It differs from each property’s actual transacted rates and accounting figures. Ryokan, minshuku and simple lodging houses not listed on OTAs are outside the analysis set. The catchment radii (1.5 km / 5 km) are a convenience based on walking-competition range and location characteristics and do not perfectly match actual competitive relationships. Figures from August 2026 onward are not confirmed results and will move as the check-in date approaches.
■ Market data
- MetroEngines Research — estimated settled ADR, property master, occupancy (estimated, based on OTA listed inventory)
■ Published materials on the four new hotels
- Hulic Hotel Management, “The Gate Hotel Osaka by HULIC opens on Monday 15 June 2026” (in Japanese)
- Hulic Hotel Management, “First Osaka property: THE GATE HOTEL Osaka by HULIC confirmed to open in June 2026” (in Japanese)
- Greens, “Comfort Hotel Chitose, the 100th Choice Hotels-brand hotel, opens 15 June 2026” (in Japanese)
- Holonic, “Setre Canal Nagoya opens Thursday 18 June 2026” (in Japanese)
- Toyoko Inn, “New hotel Toyoko INN Kure-eki: reservations open from 7 April” (in Japanese)
- Travel Watch, “Toyoko INN Kure-eki opens 3 July: 218 rooms, 3 minutes from the station” (2026, in Japanese)
■ Structural demand factors
- Ministry of Defense, “On the conclusion of a contract to acquire the former Nippon Steel Setouchi Works Kure Area site” (28 August 2026, in Japanese)
- City of Kure, “Nippon Steel Setouchi Works Kure Area: related information and enquiry desk” (in Japanese)
- Schedule for the 20th Asian Games (Aichi-Nagoya 2026), 19 September to 4 October 2026 (in Japanese)
- Real Economy, “Hotel openings come one after another in Chitose, buoyed by Rapidus” (in Japanese)
- Nikkei, “Thirty semiconductor-related companies set up in Chitose, where Rapidus is building; new hotels advance too” (in Japanese)
■ REIT disclosure