

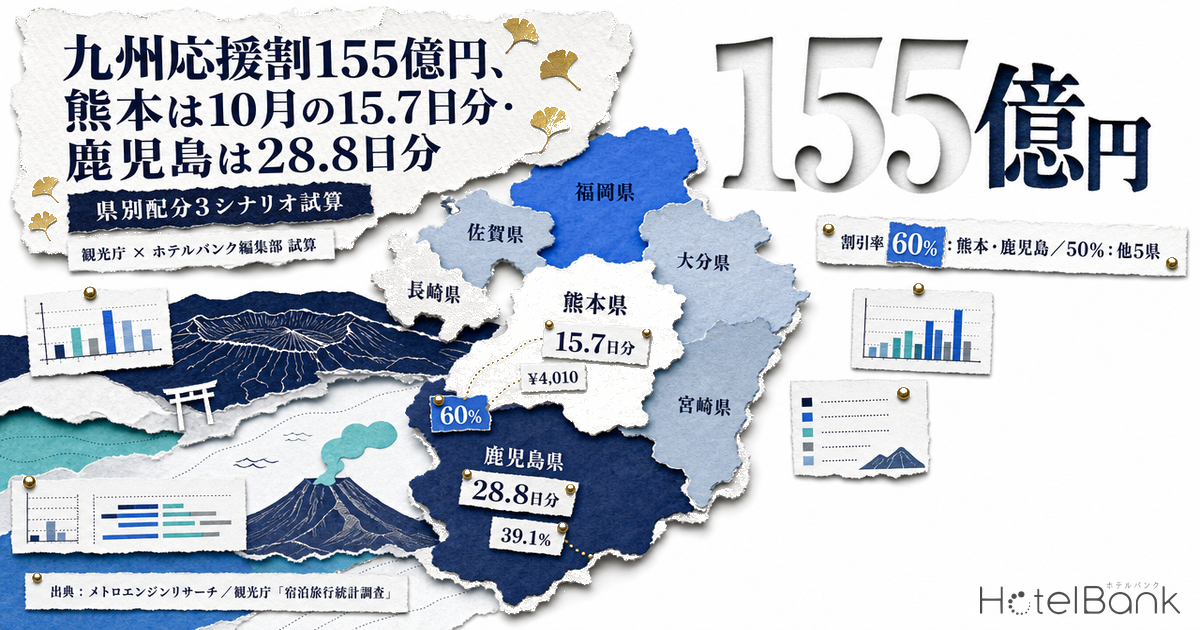
On 28 August 2026 the Japan Tourism Agency announced the Kyushu Fukko Ouenwari (九州ふっこう応援割), a demand-stimulus programme responding to the wave of accommodation cancellations that followed the 2026 Kumamoto Earthquake. It is funded with roughly ¥15.5 billion from the government’s contingency reserve. The discount is 50% as a rule and 60% in Kumamoto and Kagoshima, the two prefectures where cancellations hit hardest, and it applies to stays from 1 October. However, the allocation by prefecture had still not been published as of September 2026. For hotel operators and prefectural tourism officials alike, the practical question is how long their own prefecture’s funding will last. This article sets out three allocation scenarios and overlays the per-person, per-night discount with October inventory slack to quantify how quickly each prefecture would burn through its share.
Metric Definitions Used in This Article
- ADR (Average Daily Rate): An estimated settled rate (tax-excluded equivalent), calculated by applying a property-type correction factor to the cheapest advertised plan on OTAs (double occupancy, per-room, tax-included). Cross-checked against property-level results disclosed by listed hotel REITs (91 properties, most recent three months), the median error is about 7%. It is an estimate and differs from each property’s actual transacted prices and accounting figures. Area-level ADR is the median across the properties covered (the level of a typical property in that area).
- Advertised price (all-plan average, tax-included): The average price of publicly listed plans, from room-only through to meals-included (double occupancy, per-room). It rests on a different basis from estimated settled ADR, so this article shows it alongside as an upper-bound guide to the discount amount.
- Occupancy (estimated, OTA-listed-inventory basis): The share of rooms sold against total rooms in the area (an estimate based on OTA sales inventory). The unsold-room rate is its inverse, referred to in this article as inventory slack.
- LT (lead time): Days remaining until the check-in date. LT0 = same day.
- Data sources: MetroEngines Research / Japan Tourism Agency, “Overnight Travel Statistics Survey”
- — The prefectural split of the ¥15.5bn budget was still unpublished as of September 2026. Across three scenarios — room-stock share, person-night share and damage weighting — Kumamoto lands in a ¥2.16bn–¥2.78bn range and Kagoshima in ¥2.10bn–¥2.74bn.
- — The per-person, per-night discount is largest in Kumamoto at ¥4,010 among the seven prefectures and smallest in Miyazaki at ¥2,451. Kagoshima and Miyazaki sit at almost the same rate level, so the 10-point gap in discount rate translates directly into a ¥455 difference in outlay.
- — In the fastest case, at 100% take-up, the funding lasts 15.7 days in Kumamoto and 28.8 days in Kagoshima. At 50% take-up every prefecture lasts through all 31 days of October, and the seven prefectures together cover 2.40–4.65 million person-nights.
- — On 17 October check-ins (LT48), inventory slack is largest in Kagoshima, at a 39.1% unsold-room rate and 8,063 rooms of the seven prefectures. The 60% discount and the largest pool of empty rooms coincide in the same prefecture, leaving the greatest room to convert funding into additional guests.
- — Fukuoka, Kumamoto and Oita are already in the 80% occupancy band, so directing the funding at rate uplift — higher room categories, meals-included plans, consecutive nights — rather than at guest volume will grow local spending further on the same budget.
Confirming the Premises — What Is Settled and What Is Not
The published parts of the programme design are clear. Funding is about ¥15.5 billion, the target area is the seven prefectures of Kyushu, and the discount rate is 60% in Kumamoto and Kagoshima and 50% in the other five — Fukuoka, Saga, Nagasaki, Oita and Miyazaki. The caps are ¥20,000 per person for accommodation alone or a one-night package including transport, ¥30,000 for a transport package of two nights or more, and ¥35,000 for a touring product spanning two or more prefectures. It starts with stays from 1 October 2026.
What remains unpublished at the time of writing is the allocation by prefecture, the reservation start date and the end of the discount period, each of which is said to be set by the individual prefectures. Press reports say funds will be “allocated according to the extent of damage,” but the allocation criteria themselves have not been disclosed. The prefectural figures below are therefore all estimates by our editorial team, not published figures. The allocation logic and every denominator are set out in full so that readers can substitute their own prefecture’s numbers and recalculate.
| Item | Detail | Status |
|---|---|---|
| Total funding | About ¥15.5 billion (government contingency reserve) | Published |
| Discount rate | 60% in Kumamoto and Kagoshima / 50% in the other five prefectures | Published |
| Cap | ¥20,000 for accommodation alone for one night / ¥30,000 for a transport package of two nights or more / ¥35,000 for a touring product (all per person) | Published |
| Start | Stays from 1 October 2026 | Published |
| Allocation by prefecture | Reported as allocated according to the extent of damage | Unpublished |
| Reservation start date and period covered | Set individually by each prefecture | Unpublished |
Source: Compiled by the HotelBank Editorial Team from Japan Tourism Agency releases and press reports
Three Allocation Scenarios — Kumamoto ¥2.16bn–¥2.78bn, Kagoshima ¥2.10bn–¥2.74bn
With the allocation criteria unpublished, a single point forecast would be meaningless. Three allocation rules of differing character are therefore applied and presented as a range. Each is normalised so that the total comes to ¥15.5 billion.
| Scenario | Allocation basis | Rationale |
|---|---|---|
| A: Room-stock share | OTA-listed room count (152,220 rooms across the seven prefectures) | Proportional to supply scale — distributed by the size of the receiving capacity |
| B: Person-night share | Japan Tourism Agency, Overnight Travel Statistics, 2025 annual figures (62.57 million person-nights across the seven prefectures) | Proportional to realised demand — distributed by actual person-nights |
| C: Damage weighting | Based on the average of the A and B shares, with the weight for Kumamoto and Kagoshima (the 60% prefectures) multiplied by 1.5 | A mechanical rendering of “allocated according to the extent of damage” |
Scenarios A and B are remarkably close. In five of the seven prefectures the share difference stays within 1.5 points. In Kyushu, room supply and realised person-nights move roughly in proportion, so the choice of denominator changes little. The exceptions are Miyazaki (A 8.14% / B 6.18%) and Fukuoka (A 35.65% / B 38.64%): Miyazaki carries thin person-nights relative to its room count, and Fukuoka the reverse.
Under Scenario C, Kumamoto builds to ¥2.78bn and Kagoshima to ¥2.74bn, the two together accounting for 35.6% of the total. The gap between A and C is ¥620 million for Kumamoto and ¥640 million for Kagoshima. That swing of roughly ¥600 million feeds straight into the burn rates discussed below.
Source: Compiled by the HotelBank Editorial Team from MetroEngines Research and the Japan Tourism Agency “Overnight Travel Statistics Survey” (all amounts are estimates by our editorial team, not published figures)
| Prefecture | Discount rate | OTA-listed rooms | 2025 person-nights | A (¥bn) | B (¥bn) | C (¥bn) |
|---|---|---|---|---|---|---|
| Fukuoka | 50% | 54,266 rooms | 24,175,890 person-nights | 5.53 | 5.99 | 5.07 |
| Saga | 50% | 6,843 rooms | 2,356,240 person-nights | 0.70 | 0.58 | 0.56 |
| Nagasaki | 50% | 18,752 rooms | 7,383,830 person-nights | 1.91 | 1.83 | 1.65 |
| Kumamoto | 60% | 21,174 rooms | 8,281,360 person-nights | 2.16 | 2.05 | 2.78 |
| Oita | 50% | 18,167 rooms | 8,232,770 person-nights | 1.85 | 2.04 | 1.71 |
| Miyazaki | 50% | 12,390 rooms | 3,866,520 person-nights | 1.26 | 0.96 | 0.98 |
| Kagoshima | 60% | 20,628 rooms | 8,278,460 person-nights | 2.10 | 2.05 | 2.74 |
| 7-prefecture total | — | 152,220 rooms | 62,575,070 person-nights | 15.50 | 15.50 | 15.50 |
Source: MetroEngines Research (room counts are for properties listed for 17 October 2026 check-in, N=3,020 properties / 152,220 rooms) and the Japan Tourism Agency “Overnight Travel Statistics Survey,” 2025 annual preliminary figures. All allocation amounts are estimates by our editorial team, not published figures.
The Discount Per Person-Night — ¥4,010 in Kumamoto, ¥2,906 in Kagoshima, ¥2,451 in Miyazaki
What matters more in practice than the allocation itself is how much money goes out per night. The cap — ¥20,000 per person for accommodation alone — is out of reach at the rate levels of the seven Kyushu prefectures, so in effect “rate × discount rate” is the outlay per night.
Estimated settled ADR for October 2026 is highest in Oita at ¥15,696, followed by Saga at ¥14,533, Fukuoka at ¥14,118 and Kumamoto at ¥13,368. The lowest are Kagoshima at ¥9,685 and Miyazaki at ¥9,805, both under ¥10,000. Dividing these across double occupancy and applying the discount rate gives the per-person, per-night discount shown below.
| Prefecture | Discount rate | Estimated settled ADR (October, double occupancy) | Advertised price (all-plan average, tax-included) | Discount per person-night (estimated ADR basis) | Discount per person-night (advertised price basis) | Discount per room-night (estimated ADR basis) |
|---|---|---|---|---|---|---|
| Fukuoka | 50% | ¥14,118 | ¥28,229 | ¥3,530 | ¥7,057 | ¥7,059 |
| Saga | 50% | ¥14,533 | ¥30,958 | ¥3,633 | ¥7,740 | ¥7,266 |
| Nagasaki | 50% | ¥11,746 | ¥21,218 | ¥2,936 | ¥5,304 | ¥5,873 |
| Kumamoto | 60% | ¥13,368 | ¥25,710 | ¥4,010 | ¥7,713 | ¥8,021 |
| Oita | 50% | ¥15,696 | ¥35,618 | ¥3,924 | ¥8,904 | ¥7,848 |
| Miyazaki | 50% | ¥9,805 | ¥17,442 | ¥2,451 | ¥4,360 | ¥4,902 |
| Kagoshima | 60% | ¥9,685 | ¥17,816 | ¥2,906 | ¥5,345 | ¥5,811 |
Source: MetroEngines Research (October 2026; sample size for estimated settled ADR N=150–456 properties per prefecture), compiled by the HotelBank Editorial Team
Source: MetroEngines Research, compiled by the HotelBank Editorial Team (discounts estimated on the assumption that the ¥20,000 cap is not reached)
This is where the trade-off between rate and discount rate appears. Kagoshima has the lowest rate of the seven prefectures and should therefore cover more person-nights for the same money, but the 60% rate makes the outlay ¥2,906 per night — ¥455 above Miyazaki’s ¥2,451 at 50%. The two sit at nearly identical rates (¥9,685 and ¥9,805), yet the programme’s 10-point gap passes straight through into the outlay.
Kumamoto, conversely, carries a rate of ¥13,368 with 60% on top, giving ¥4,010 per person-night — the highest of the seven. Kagoshima’s position as the lowest-rate prefecture reflects the rate structure within the prefecture itself, analysed in detail in Kagoshima’s Capital Is Its Cheapest. Oita follows at ¥3,924 and Saga at ¥3,633. On an advertised-price basis the range widens, to ¥8,904 in Oita and ¥7,713 in Kumamoto. Since the rate actually applied will land between the two depending on whether room-only or meals-included plans dominate, the estimates below take the conservative estimated settled ADR basis and show the advertised price basis as the upside case.
Burn Rate — 15.7 of October’s Days in Kumamoto, 28.8 in Kagoshima
Next, how many days it takes to spend the allocation. The formula is simple.
Days to exhaustion = allocation ÷ (room stock × assumed sell-through × discount per room-night)
The assumed sell-through uses the occupancy for 17 October 2026 check-in (estimated, OTA-listed-inventory basis) discussed below. The denominator is the number of rooms sold for one night in that prefecture, and the fastest case is one in which every one of them uses the programme. In practice last-minute bookings, corporate contracts and out-of-scope reservations are mixed in, so 50% and 30% take-up cases are shown alongside.
| Prefecture | Rooms sold per night (17 Oct snapshot, estimated) | Discount per room-night | Daily spend (100% take-up) | A: days to exhaustion | B: days to exhaustion | C: days to exhaustion |
|---|---|---|---|---|---|---|
| Fukuoka | 43,521 rooms | ¥7,059 | ¥307.2M | 18.0 days | 19.5 days | 16.5 days |
| Saga | 4,893 rooms | ¥7,266 | ¥35.6M | 19.6 days | 16.4 days | 15.9 days |
| Nagasaki | 14,908 rooms | ¥5,873 | ¥87.6M | 21.8 days | 20.9 days | 18.8 days |
| Kumamoto | 17,109 rooms | ¥8,021 | ¥137.2M | 15.7 days | 14.9 days | 20.3 days |
| Oita | 14,570 rooms | ¥7,848 | ¥114.3M | 16.2 days | 17.8 days | 15.0 days |
| Miyazaki | 8,995 rooms | ¥4,902 | ¥44.1M | 28.6 days | 21.7 days | 22.2 days |
| Kagoshima | 12,562 rooms | ¥5,811 | ¥73.0M | 28.8 days | 28.1 days | 37.6 days |
Source: MetroEngines Research, compiled by the HotelBank Editorial Team (all allocations and days to exhaustion are estimates by our editorial team, not published figures. 100% take-up = the fastest case, in which every room sold uses the programme)
Source: MetroEngines Research, compiled by the HotelBank Editorial Team (all figures estimated. October has 31 days)
October has 31 days. Under Scenario A, Kagoshima at 28.8 days and Miyazaki at 28.6 days come close to covering the whole month. Kumamoto at 15.7 days, Oita at 16.2 and Fukuoka at 18.0, by contrast, exhaust their theoretical funding around the middle of the month. The same ¥15.5 billion lasts nearly twice as long in some prefectures as in others.
Applying the damage weighting of Scenario C extends Kumamoto by 4.6 days to 20.3 and Kagoshima by 8.8 days to 37.6. Kagoshima gains enough headroom to run past October into November, while Kumamoto — where the 60% discount meets a higher rate — stays inside October even with the weighting. That asymmetry is why Kumamoto and Kagoshima cannot be treated as a single “60% bloc.”
| Prefecture | 100% take-up | 50% take-up | 30% take-up | Person-nights covered (estimated ADR basis) | Person-nights covered (advertised price basis) |
|---|---|---|---|---|---|
| Fukuoka | 18.0 days | 36.0 days | 60.0 days | 1,565,578 person-nights | 782,983 person-nights |
| Saga | 19.6 days | 39.2 days | 65.3 days | 191,783 person-nights | 90,031 person-nights |
| Nagasaki | 21.8 days | 43.6 days | 72.7 days | 650,246 person-nights | 359,967 person-nights |
| Kumamoto | 15.7 days | 31.4 days | 52.3 days | 537,620 person-nights | 279,537 person-nights |
| Oita | 16.2 days | 32.4 days | 54.0 days | 471,427 person-nights | 207,746 person-nights |
| Miyazaki | 28.6 days | 57.2 days | 95.3 days | 514,688 person-nights | 289,331 person-nights |
| Kagoshima | 28.8 days | 57.6 days | 96.0 days | 722,930 person-nights | 392,994 person-nights |
| 7-prefecture total | — | — | — | 4,654,272 person-nights | 2,402,589 person-nights |
Source: MetroEngines Research, compiled by the HotelBank Editorial Team (person-nights based on the Scenario A allocation. All figures estimated)
At 50% take-up every figure for days to exhaustion doubles: Kumamoto reaches 31.4 days and Kagoshima 57.6, so the funding lasts through October. Person-nights covered across the seven prefectures total roughly 4.65 million on the estimated settled ADR basis and about 2.40 million on the advertised price basis. That 2.40–4.65 million person-night range is the practical reach of a ¥15.5 billion budget. For reference, October demand across the seven prefectures can be put at roughly one-twelfth of the annual 62.57 million person-nights, or about 5.2 million — so the funding covers a little under half of Kyushu’s October demand.
Overlaying October Inventory Slack — Kagoshima’s 39.1% Unsold Rate Is the Largest Pool
As important as how long the funding lasts is whether it reaches new guests or is simply applied to bookings already on the books. Inventory slack for October check-ins is the evidence for that judgement.
For check-ins on Saturday 17 October 2026, comparing occupancy as of 30 August (LT48; estimated, OTA-listed-inventory basis) across the seven prefectures, Kagoshima is lowest at 60.9%, with 8,063 of 20,628 rooms unsold — an unsold-room rate of 39.1%. Miyazaki follows at 72.6% (3,389 rooms unsold) and Saga at 71.5% (1,952 unsold). At the other end, Kumamoto is at 80.8%, Fukuoka at 80.2% and Oita at 80.2%, all already in the 80% band. Of the 35,650 rooms unsold across the seven prefectures, Kumamoto and Kagoshima — the two at 60% — hold 12,121, or 34.0%. This prefectural distribution of slack is measured on a different observation date in Kyushu Subsidy: Kumamoto & Kagoshima Hold 34.9% of Oct Unsold Rooms.
| Prefecture | Discount rate | Total rooms | Occupancy (estimated, OTA-listed-inventory basis) | Rooms unsold | Inventory slack (unsold-room rate) | Days to exhaustion (Scenario A) |
|---|---|---|---|---|---|---|
| Fukuoka | 50% | 54,266 rooms | 80.2% | 10,740 rooms | 19.8% | 18.0 days |
| Saga | 50% | 6,843 rooms | 71.5% | 1,952 rooms | 28.5% | 19.6 days |
| Nagasaki | 50% | 18,752 rooms | 79.5% | 3,849 rooms | 20.5% | 21.8 days |
| Kumamoto | 60% | 21,174 rooms | 80.8% | 4,058 rooms | 19.2% | 15.7 days |
| Oita | 50% | 18,167 rooms | 80.2% | 3,599 rooms | 19.8% | 16.2 days |
| Miyazaki | 50% | 12,390 rooms | 72.6% | 3,389 rooms | 27.4% | 28.6 days |
| Kagoshima | 60% | 20,628 rooms | 60.9% | 8,063 rooms | 39.1% | 28.8 days |
| 7-prefecture total | — | 152,220 rooms | — | 35,650 rooms | 23.4% | — |
Source: MetroEngines Research (17 October 2026 check-in, observed 30 August 2026 = LT48, N=3,020 properties), compiled by the HotelBank Editorial Team
Source: MetroEngines Research, compiled by the HotelBank Editorial Team (LT = days until check-in; check-in draws nearer towards the right)
Tracking the move from LT90 to LT48, all seven prefectures rise gently, with no sharp acceleration in bookings. Kagoshima goes from 55.7% at LT90 to 60.9% at LT48, a build of just 5.2 points. Kumamoto slipped back from 77.5% at LT90 to 75.8% at LT65 as inventory returned, then recovered to 80.8% over the following fortnight. The programme announcement on 28 August falls at around LT50, and every prefecture shows a further step up in sell-through in the days that followed.
Overlaying burn rate on inventory slack makes each prefecture’s position clear.
Source: MetroEngines Research, compiled by the HotelBank Editorial Team (circle size = Scenario A allocation. Days to exhaustion and allocations are both estimates)
Plotting inventory slack (unsold-room rate for 17 October 2026 check-in, observed 30 August 2026 = LT48) on the horizontal axis against days to exhaustion (Scenario A, 100% take-up) on the vertical, Kagoshima sits well out to the upper right. It holds the largest pool of empty rooms of the seven at a 39.1% unsold rate, and because its rate is low the funding lasts 28.8 days. The 60% discount and the greatest inventory slack coincide in the same prefecture, leaving more room than anywhere else to convert funding into additional guests. Miyazaki, at a 27.4% unsold rate and 28.6 days, falls in the same quadrant.
Fukuoka, Kumamoto and Oita, by contrast, are already in the 80% band, so a substantial part of the funding will go towards demand that already exists. That does not mean there is no upside. In high-occupancy prefectures, directing the funding towards raising the value of each night — upgrades to higher room categories, meals-included plans, consecutive nights — rather than towards adding guests will grow local spending further on the same budget. Where the unsold rate is around 20%, presenting the discount as funding for an upgrade rather than as a lower price is the design that fits.
Saga has slack, at a 28.5% unsold rate, yet its days to exhaustion are short at 19.6. Its rate of ¥14,533 is the second-highest of the seven, so the outlay per night is large. The prefecture’s total room stock is small at 6,843 rooms and the allocation is limited to ¥560M–¥700M. Whether to concentrate the money on weekends in a short burst or spread it thinly across weekdays over a longer period will swing the outcome more in Saga than anywhere else.
Seven-Prefecture Map — Room Stock and Discount Rate
Room stock by prefecture (circle size) and discount rate (colour) are overlaid on the map. Clicking a circle shows the Scenario A, B and C allocations, the days to exhaustion, and the rooms unsold at the 17 October snapshot.
Source: MetroEngines Research. All allocations and days to exhaustion are estimates by our editorial team, not published figures.
Practical Notes — What to Decide in the Month Before the Announcement
With the prefectural allocation and reservation start dates unpublished, what operators can do is put themselves in a position to move under any scenario. Three points.
1. Decide first how the post-discount price will look.Kumamoto’s estimated settled ADR of ¥13,368 (double occupancy) with 60% on top gives a discount of ¥8,021 per room, or ¥4,010 per person. In the 50% prefectures it is ¥7,059 in Fukuoka and ¥7,848 in Oita, both per room. The ¥20,000 cap does not bite in Kyushu’s rate band, so rather than worrying about the cap, the design question that comes first is what post-discount price to display. Whether it is shown room-only or meals-included matters: on an advertised-price basis the discount stretches to ¥8,904 in Oita and ¥7,740 in Saga. How the discount feels from the guest’s side, and how to choose a property and dates, is set out in Kyushu Fukko Ouenwari: 60% Off in Kumamoto, Kagoshima, ¥20,000 Cap, a useful reference point when drafting promotional copy.
2. Plan for the first half of the month where the burn is fast, and for the full period where there is slack.On these estimates Kumamoto, Oita and Fukuoka reach their theoretical funding between the first half and the middle of October. At 50% take-up the money lasts through the month, but at the upper end of the range it is worth assuming concentration in early October and making sure that inventory for the second half of the month can also be filled with plans that do not depend on the programme. Kagoshima and Miyazaki, conversely, are estimated to last beyond October, so an inventory plan that looks ahead to autumn-foliage and weekend demand from November fits better.
3. Where unsold inventory is thick, design for capturing new guests.Kagoshima’s 8,063 unsold rooms and Miyazaki’s 3,389 are the physical room the programme has to draw in new demand. Treating the period as a window for building awareness outside the prefecture and further afield — pairing consecutive-night discounts with the touring product, capped at ¥35,000 — raises the efficiency of each booking won. Touring products must span two or more prefectures, so cross-border combinations such as Kagoshima–Kumamoto or Miyazaki–Oita are more favourable on the cap.
Conclusion
The Kyushu Fukko Ouenwari’s ¥15.5 billion reaches its 1 October start with the prefectural allocation still unpublished. Under three allocation scenarios, Kumamoto falls in a ¥2.16bn–¥2.78bn range, Kagoshima ¥2.10bn–¥2.74bn and Fukuoka ¥5.07bn–¥5.99bn. The per-person, per-night discount is largest in Kumamoto at ¥4,010 and smallest in Miyazaki at ¥2,451; lower-rate prefectures cover more person-nights for the same money, yet Kagoshima, carrying 60%, spends ¥455 more per night than Miyazaki.
Converted into burn rate, Scenario A gives Kumamoto 15.7 days, Oita 16.2 and Fukuoka 18.0, against Kagoshima’s 28.8 and Miyazaki’s 28.6. At 50% take-up every prefecture lasts through October. Person-nights covered across the seven total 2.40–4.65 million.
Overlaying inventory slack at the 17 October snapshot, Kagoshima holds the largest pool of the seven — a 39.1% unsold rate and 8,063 rooms — so the 60% discount and the longest-lasting funding sit in the same prefecture. Kagoshima and Miyazaki have the greatest room to convert funding into additional guests, while Fukuoka, Kumamoto and Oita, already in the 80% band, will grow local spending further on the same budget by directing funding at rate and grade. Once the prefectural allocations are announced, substituting the actual amounts into the shares used here recalculates any prefecture’s burn rate directly.
⚠ Note on forward-dated data: ADR and occupancy for October 2026 in this article are estimates based on the advertised prices and listed inventory published on OTAs at the time of the survey, and they move as the check-in date approaches. Occupancy for 17 October check-in in particular is an interim reading observed on 30 August 2026 (LT48), not a final figure. Prefectural allocations and days to exhaustion are all estimates by our editorial team, not figures published by the Japan Tourism Agency or by the prefectures.
Related Reading
- Kyushu Subsidy: Kumamoto & Kagoshima Hold 34.9% of Oct Unsold Rooms
- Kyushu Recovery Subsidy Set: 60%/50% Split, ¥20,000 Cap Hits Top 10%
- Kyushu Subsidy: 10pt Border Step Cuts Kurokawa-Yufuin Gap to ¥665
- Kumamoto Quake 2026: 2016 Recovery Curve as Kyushu’s 7-Pref Benchmark
- Kyushu Fukko Ouenwari: 60% Off in Kumamoto, Kagoshima, ¥20,000 Cap
- Kagoshima’s Capital Is Its Cheapest: ADR ¥6,819 vs Kirishima ¥14,330
References and Sources
■ Primary programme information and press coverage
- Japan Tourism Agency, “Kyushu Fukko Ouenwari” (materials published 28 August 2026)
- Japan Tourism Agency to launch the “Kyushu Fukko Ouenwari” in October, discounting travel and accommodation by 50%, and by 60% in Kumamoto and Kagoshima (Travel Voice, 28 August 2026)
- Travel support programme “Kyushu Fukko Ouenwari” confirmed from October: ¥20,000 off per night, tours subsidised up to ¥35,000 (Travel Watch, 28 August 2026)
■ Government statistics
- Japan Tourism Agency, “Overnight Travel Statistics Survey” (2025 annual preliminary figures, person-nights by prefecture)
- Japan Tourism Agency press release, “Overnight Travel Statistics Survey (2025 annual preliminary figures)”
■ Market data
- MetroEngines Research — OTA-listed room counts for the seven Kyushu prefectures (17 October 2026 check-in, N=3,020 properties / 152,220 rooms), estimated settled ADR and advertised prices for October 2026 (N=150–456 properties per prefecture), occupancy (estimated, OTA-listed-inventory basis) and inventory movement by lead time