

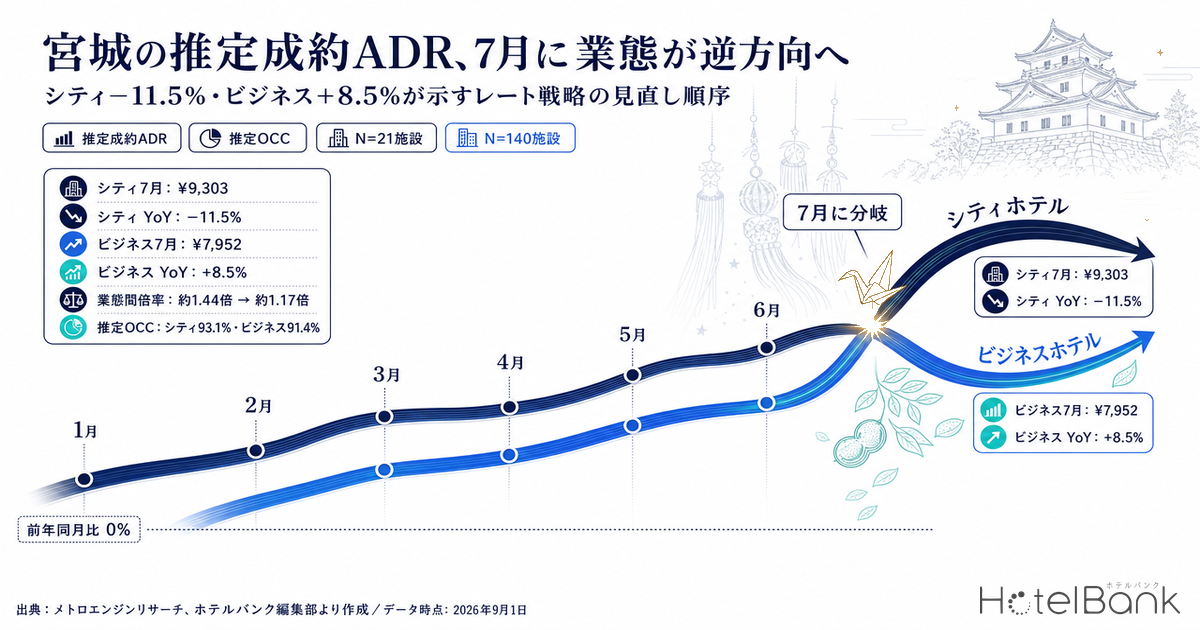
Through most of the first half of 2026, city hotels and business hotels in Miyagi Prefecture pushed their settled ADR estimates higher in step with each other. Then in July 2026, the most recent month for which finalized figures are available, the two segments moved in opposite directions for the first time. City hotels came in at ¥9,303 (N=21 properties), down −11.5% against ¥10,517 (N=20 properties) a year earlier, while business hotels reached ¥7,952 (N=140 properties), up +8.5% from ¥7,331 (N=140 properties). Same prefecture, same month, same metric — and a gap of nearly 20 points between them. This article re-sequences the year-on-year comparison of finalized months from January to July 2026 by segment, examines what diverged in July, and sets out the order in which rate strategy should be revisited when a divergence like this appears.
Scope: city hotels (N=20-21 properties) and business hotels (N=139-142 properties) in Miyagi Prefecture. The price metric used throughout is the settled ADR estimate (the transacted price level estimated from OTA and other sales data, tax-exclusive equivalent); occupancy is an estimate based on OTA-listed inventory. Definitions for both appear at the end of the article. Data as of September 1, 2026.
- — In July 2026, Miyagi split into opposite signs within a single prefecture and a single month: the settled ADR estimate for city hotels fell −11.5% year on year (¥9,303) while business hotels rose +8.5% (¥7,952).
- — That said, the city figure of ¥9,303 is virtually level with July 2024’s ¥9,224 (+0.9%). Reading it as a return to normal from an elevated July 2025 base fits the three-year shape better than reading it as a collapse in 2026.
- — The premium between the two segments narrowed in a single year from roughly 1.44x to roughly 1.17x. That cuts in opposite directions: a prompt to re-examine pricing for the upper segment, and room to move upward for the lower one.
- — Estimated OCC in July 2026 stayed high at 93.1% for city hotels and 91.4% for business hotels. Recovering the rate decline through occupancy alone would require an estimated OCC of 105.2% (converted from the observed figures for July 2026, N=21 properties) — which puts the next effective lever on the rate side, not the occupancy side.
Both segments ran ahead in the first half, then the picture changed from June
Start with the overall shape. Averaged across the finalized months of January to July 2026, the settled ADR estimate for city hotels in Miyagi was ¥9,537, up +10.3% from ¥8,644 in the same period a year earlier. Business hotels came to ¥7,533, up +9.9% from ¥6,855. Bundle the first half together and the two segments lifted rates by roughly the same margin.
But a bundled figure hides the divergence. Matching finalized months against each other month by month, city hotels (+9.0% / +11.9% / +11.2% / +15.3%) and business hotels (+9.3% / +11.2% / +8.5% / +7.7%) moved in the same direction from February through May, with city hotels gaining slightly more. That relationship reversed in June (city −3.7%, business +1.7%) and opened up completely in July.
One caveat on January: city hotels recorded ¥11,362 (N=20 properties), up 49.1% year on year, but that is a single-month outlier arising in a month with a thin sample of 20 properties, and no market direction can be read from that one point alone. In fact, rebuilding the average across February to July with January excluded puts city hotels at +4.7%, below business hotels at +7.8%. The very impression that city hotels led through the first half rested on that single January reading.
Source: MetroEngines Research; compiled by the HotelBank Editorial Team
Overlaying the years for city hotels, the 2026 line (solid) ran above 2025 (pale blue) almost continuously from February onward, crossed in June, and slipped below 2025 in July. July 2025’s ¥10,517 stands out as the highest July of the three years, and July 2026’s ¥9,303 has returned to almost exactly where July 2024 sat at ¥9,224 (+0.9%). In other words, the three-year shape fits a return from the elevated base set in July 2025 to a normal level better than it fits a collapse in rates in 2026.
Source: MetroEngines Research; compiled by the HotelBank Editorial Team
Business hotels trace a different shape. The 2026 line never falls below 2025 at any point from January through July, stepping the level up in stages. July 2026’s ¥7,952 is +9.4% against July 2024’s ¥7,268 — the rate level itself has shifted over two years. The sample is also thick at N=140 properties, which makes single-month noise a poor explanation.
The segment gap that opened in July — broken down by the numbers
Laying the year-on-year figures for finalized months side by side makes the starting point and the size of the divergence clear.
| Stay month | City 2026 | City 2025 | YoY | Business 2026 | Business 2025 | YoY |
|---|---|---|---|---|---|---|
| January | ¥11,362 | ¥7,618 | +49.1%* | ¥7,601 | ¥6,111 | +24.4% |
| February | ¥8,758 | ¥8,032 | +9.0% | ¥7,267 | ¥6,646 | +9.3% |
| March | ¥8,919 | ¥7,968 | +11.9% | ¥7,211 | ¥6,482 | +11.2% |
| April | ¥9,459 | ¥8,503 | +11.2% | ¥7,564 | ¥6,973 | +8.5% |
| May | ¥10,648 | ¥9,237 | +15.3% | ¥8,027 | ¥7,454 | +7.7% |
| June | ¥8,312 | ¥8,632 | −3.7% | ¥7,107 | ¥6,990 | +1.7% |
| July | ¥9,303 | ¥10,517 | −11.5% | ¥7,952 | ¥7,331 | +8.5% |
| Jan-Jul average | ¥9,537 | ¥8,644 | +10.3% | ¥7,533 | ¥6,855 | +9.9% |
City hotels N=20-21 properties in 2026 / 20 properties in 2025; business hotels N=139-142 properties in 2026 / 140-143 properties in 2025. All comparisons are finalized figures (history basis) against finalized figures. *January for city hotels is treated as an outlier arising in a month with a thin sample and is not used as a basis for single-month judgment.
Source: MetroEngines Research; compiled by the HotelBank Editorial Team
Source: MetroEngines Research; compiled by the HotelBank Editorial Team
Set out as year-on-year bars, the two bars move at almost the same height from February to May, one of them drops below zero in June, and in July they separate completely into −11.5% and +8.5%. What is worth noting is that the divergence happened in both directions at once — a decline for city hotels and a rise for business hotels. A move on one side alone could be put down to overall market conditions, but when opposite signs appear in the same prefecture in the same month, the issue is more likely to lie in the composition of demand and in price positioning than in the total volume of demand. Segments switching signs within the same month is not unique to Miyagi: the same pattern was observed on a finalized-figures basis over the same period in Iwate Settled ADR H1 2026: Business −3.2% in June, City +4.3%.
Nor is the divergence confined to Miyagi. Placing the other prefectures referenced in this article alongside it for the same finalized month of July 2026, the direction — weak city hotels, resilient business hotels — is common to all of them, and Miyagi stands out as the prefecture where the swing is largest on both sides.
| Prefecture | City, July 2026 | YoY | Business, July 2026 | YoY |
|---|---|---|---|---|
| Miyagi | ¥9,303 | −11.5% | ¥7,952 | +8.5% |
| Iwate | ¥7,664 | +5.9% | ¥6,300 | +4.1% |
| Hyogo | ¥12,131 | −7.5% | ¥7,673 | +1.5% |
| Shizuoka | ¥13,252 | −0.7% | ¥7,324 | +2.4% |
Target month: July 2026 (finalized). The same month a year earlier is also finalized. N (city / business, range across 2025-2026) — Miyagi 20-21 / 139-143, Iwate 18 / 84-85, Hyogo 47 / 166-168, Shizuoka 30-31 / 219-221. City hotels fell below the prior year in three prefectures — Miyagi, Hyogo and Shizuoka — while business hotels were positive in all four. Miyagi has both the largest city-hotel decline (−11.5%) and the largest business-hotel gain (+8.5%) of the four, making it the prefecture where the directional gap between segments is widest.
Source: MetroEngines Research; compiled by the HotelBank Editorial Team
The price gap between the segments has itself narrowed. In July 2025, city hotels at ¥10,517 stood about ¥3,200 above business hotels at ¥7,331 — roughly 1.44 times. By July 2026 the gap is about ¥1,351 and the multiple has compressed to roughly 1.17 times. Put another way, the premium the upper segment commands has thinned over the course of a single year.
Total demand has not fallen — look at estimated OCC for July
When rates fall below the prior year, the first thing to check is whether guests were not coming or whether they came and were sold at a lower price. Estimated OCC for July 2026 in Miyagi (based on OTA-listed inventory) averaged 93.1% for city hotels across the month (18-21 properties covered, 2,811-2,963 listed rooms) and 91.4% for business hotels (120-126 properties, 16,417-17,261 rooms). Both segments sit in the 90s — this is not a picture of surplus inventory.
Splitting by day of week shows the shape of demand.
| Day | Mon | Tue | Wed | Thu | Fri | Sat | Sun |
|---|---|---|---|---|---|---|---|
| City, estimated OCC | 88.5% | 92.7% | 91.9% | 92.9% | 94.4% | 98.7% | 92.4% |
| Business, estimated OCC | 85.2% | 91.2% | 91.8% | 93.3% | 92.6% | 97.3% | 87.6% |
Target month: July 2026 (actual). Each day of week occurs 4-5 times in the month. Estimated OCC is based on OTA-listed inventory and is defined differently from actual room occupancy.
Source: MetroEngines Research; compiled by the HotelBank Editorial Team
Saturday is the peak for both segments, at 98.7% for city hotels and 97.3% for business hotels. On a daily basis, Saturday July 18, 2026 reached 100.0% for city hotels and 99.3% for business hotels — a state in which almost no inventory can be found across the prefecture. The trough is Monday, at 88.5% for city hotels and 85.2% for business hotels. Monday July 20 (a public holiday) came in at 85.8% for city hotels and 82.0% for business hotels, making the final day of the three-day weekend the softest day of the month. How Saturdays in Miyagi build up by lead time is tracked from 45 days out in Sendai Tanabata 2026: Aug 8 Starts at 80.8% at T-45, Climbs Fastest.
What this says is that the July decline in city-hotel rates is hard to explain by an absence of guests. Occupancy levels held, and even while the month contained days on which inventory was all but exhausted on Saturdays, the monthly settled ADR estimate came in 11.5% below the prior year. Rather than discounting to avoid unsold rooms, the more likely place to look first is whether the price itself was simply set at a lower level than a year earlier.
Before deciding whether to move rate or occupancy, it helps to put the exchange rate between the two into numbers. The table below indexes the observed point for Miyagi city hotels at 100 and lays out the room revenue index (ADR x OCC) as rate and occupancy are varied. The base is a settled ADR estimate of ¥9,303 and estimated OCC of 93.1% (both July 2026, finalized / N=21 properties).
| Settled ADR estimate \ Estimated OCC | 85.0% | 90.0% | 93.1% (observed) | 96.0% | 98.7% |
|---|---|---|---|---|---|
| ¥8,800 | 86.4 | 91.4 | 94.6 | 97.5 | 100.3 |
| ¥9,303 (observed, July 2026) | 91.3 | 96.7 | 100.0 | 103.1 | 106.0 |
| ¥9,800 | 96.2 | 101.8 | 105.3 | 108.6 | 111.7 |
| ¥10,300 | 101.1 | 107.0 | 110.7 | 114.2 | 117.4 |
| ¥10,517 (July 2025 level) | 103.2 | 109.3 | 113.0 | 116.6 | 119.8 |
Scope: Miyagi city hotels (July 2026, N=21 properties). Index = (settled ADR estimate x estimated OCC) / (¥9,303 x 93.1%) x 100. Estimated OCC is based on OTA-listed inventory and is defined differently from actual room occupancy. This table is an arithmetic sensitivity based on market-level figures and does not guarantee the revenue of any individual property.
Source: MetroEngines Research; compiled by the HotelBank Editorial Team
What it shows is that there is little headroom left on the occupancy side. Recovering the −11.5% year-on-year rate decline through occupancy alone would require estimated OCC to rise from 93.1% to 105.2% — above 100%. Even Saturday (98.7%) falls short of that, which means occupancy is already close to fully used. Read the same table vertically and restoring rate from ¥9,303 to the July 2025 level of ¥10,517 puts the revenue index at 109.3 — above the observed point — even if occupancy eases to 90%. Comparing in both directions confirms that for Miyagi city hotels the next effective lever sits on the rate side, not the occupancy side.
For reference, settled ADR estimates from August 2026 onward are estimates based on current sales conditions, not finalized figures. City hotels sit at ¥11,515 for August and ¥12,980 for September, business hotels at ¥9,840 and ¥10,824 — but these are mid-sales snapshots, so a straight comparison with the prior year’s finalized figures has to wait until month-end finalization. Cross-checks of these estimates against disclosed operating results show a median error of 6.6%; applying that band symmetrically puts city hotels in a range of ¥10,755-¥12,275 for August and ¥12,123-¥13,837 for September, and business hotels at ¥9,191-¥10,489 and ¥10,110-¥11,538. Even at the bottom of the band both segments sit above July’s finalized figures, so the direction points to continued rate growth into the summer — but pricing built on the top of the band is a judgment worth deferring until the figures are finalized. Either way, these are material for reading direction, not achieved results.
For revenue managers running city and business hotels in Miyagi — implications and an action plan
1. Before settling on “the market came down,” check the base year of the comparison.
City hotels’ ¥9,303 in July 2026 is −11.5% against the prior year’s ¥10,517, but virtually level with July 2024’s ¥9,224 (+0.9%). When your own property posts a double-digit negative year-on-year, whether that reflects a lower market level or an unusually high prior year can be separated simply by lining up the year before that. Looking only at a single-year comparison makes it easy to decide to bring pricing back to a level it should not return to.
2. Re-examine the ordering of rates on the assumption that the segment premium has thinned.
The price gap in which city hotels stood at roughly 1.44 times business hotels in July 2025 has compressed to roughly 1.17 times in July 2026. On the city side, the narrowing distance to the lower segment is a reason to check whether your added value is fully reflected in price. On the business side, the smaller gap to the upper segment can be read as room opening up on the upside. In either case, the discussion becomes concrete once you start from where your own rates sit relative to the market settled ADR estimate (¥9,303 for city, ¥7,952 for business).
3. In a month where occupancy stays high and rate falls, start by questioning how price was set.
Estimated OCC in July 2026 was 93.1% for city hotels and 91.4% for business hotels, with Saturdays at 98.7% and 97.3% respectively. With occupancy holding at a high level, it is natural to look first at price design rather than at weak demand to explain soft rates. It is particularly worth checking whether any ceiling remains on the upper end of the rate range on Saturdays, when inventory is all but exhausted.
4. Treat the Monday and Sunday troughs as a demand-capture design problem, not a pricing one.
The lowest estimated OCC by day of week is Monday (88.5% for city, 85.2% for business), followed by Sunday (92.4% and 87.6%). Because cutting price here risks dragging the average rate down into the high-occupancy Saturday band as well, the design should lean toward targeted measures that fill those days.
| Time horizon | Measure | Decision trigger | Objective |
|---|---|---|---|
| Today to this week | Re-align your July 2026 results against both July 2025 and July 2024 | Because the market for city hotels in July carries two faces — −11.5% year on year and +0.9% against 2024 | Separate an elevated prior-year base from a lower market level |
| Today to this week | Review the upper end of Saturday rates, starting with the tightest inventory days of the month | If July Saturday estimated OCC is at exhaustion levels — 98.7% for city and 97.3% for business | Reduce missed capture on high-demand days |
| Within two weeks | Restate your rate range as a ratio to the market settled ADR estimate for the same segment | If your own rates stay persistently below ¥9,303 for city or ¥7,952 for business | Judge price by relative position rather than absolute amount |
| Within two weeks | Shift how Mondays and Sundays are filled from across-the-board discounting to targeted measures | While Monday remains the week’s lowest estimated OCC by day of week (88.5% for city, 85.2% for business) | Protect the average rate in the weekend band |
| Toward next month | Bring the rate revision calendar forward to match the shape of the first half (strong February-May, softening in June-July) | Because February-May carried uniformly strong year-on-year growth of +9.0% to +15.3% for city and +7.7% to +11.2% for business | Avoid leaving pricing on the table in strong months |
| Toward next month | Agree in advance that figures from August onward are treated as directional material and re-verified once finalized | Because the August and September values are estimates based on current sales conditions, not finalized figures | Avoid overreacting to a mid-sales snapshot |
This table organizes considerations that can be drawn from market data and does not guarantee results.
Conclusion — three yardsticks to hold in a month that diverges
Yardstick 1: hold two base years. Line up not only the prior year but the year before that. July 2026 for Miyagi city hotels is −11.5% year on year and, at the same time, +0.9% against July 2024. Look at only one of those and you land on an entirely different conclusion.
Yardstick 2: track the multiple between segments. Alongside year-on-year change in absolute terms, watch how many times the upper segment sits above the lower one. In Miyagi the July multiple compressed from roughly 1.44 to roughly 1.17. That compression cuts in opposite directions: a prompt to re-examine pricing for city hotels, and room on the upside for business hotels.
Yardstick 3: always read rate and occupancy together. In July 2026 Miyagi held estimated OCC high at 93.1% for city hotels and 91.4% for business hotels, and yet only the city-hotel settled ADR estimate fell below the prior year. A month in which rate falls while occupancy does not is not fully explained from the demand side. As long as rate and occupancy are viewed separately, this kind of divergence gets missed.
Bundled together, the first half of 2026 in Miyagi looks like a calm picture of roughly 10% year-on-year growth in both segments. Split by month and by segment, however, the direction breaks apart between June and July, and the premium between segments has visibly thinned over the course of a year. The order in which to act in a month that diverges cannot be settled by looking at averages alone.
About the Data
Definition of estimated OCC (OTA-listed inventory basis): OTA-listed inventory occupancy = 100 − 100 x OTA-listed remaining rooms / total rooms. It is an estimate based on how listed inventory on OTAs is being taken up, and is defined differently from actual room occupancy (it reads higher). The target month covered in this article is July 2026 (actual), and the scope is city hotels and business hotels in Miyagi Prefecture.
Booking curve: based on observations from 45 days before the stay date up to the present.
Definition of the settled ADR estimate: the transacted price level estimated from OTA and other sales data (lowest-plan level x segment coefficient, ensembled across multiple channels), on a tax-exclusive equivalent basis. Past months are finalized figures; the current and future months are estimates based on current sales conditions. Cross-checks against disclosed operating results show a median error of 6.6%. All year-on-year comparisons in this article are made between finalized figures, and values from August 2026 onward are not compared directly with finalized figures.
Breakdown of N: settled ADR estimate — Miyagi city hotels (January-March 2026 N=20 properties, April-July N=21 properties / 2025 N=20 properties) and Miyagi business hotels (2026 N=139-142 properties / 2025 N=140-143 properties). Estimated OCC — for July 2026 on a daily basis, city hotels 18-21 properties with 2,811-2,963 listed rooms, business hotels 120-126 properties with 16,417-17,261 rooms.
■ Data sources
Both the settled ADR estimate and estimated OCC come from MetroEngines Research monthly area aggregations (prefecture x segment). For the settled ADR estimate, data for Miyagi city hotels (category: city) and business hotels (category: business) was retrieved for January 2024 through December 2026, and only the finalized figures (history basis) covering January 2024 through July 2026 were used for year-on-year comparison. Estimated OCC was retrieved daily for July 2026 in Miyagi, from which the monthly average and day-of-week averages were calculated. The comparison prefectures Iwate, Hyogo and Shizuoka were retrieved on the same aggregation and the same period basis.
■ Calculation assumptions
All year-on-year changes are calculated between finalized figures (history basis), and estimates for the current and future months are excluded from comparison. Monthly averages are simple averages of the values for each month, and the January-July average is a simple average across the seven months, with no weighting by property count. Day-of-week estimated OCC is the simple average of the relevant days of week within the target month (4-5 days). The room revenue index in Table 4 is the ratio of “settled ADR estimate x estimated OCC” divided by the observed point for city hotels in July 2026, and excludes selling costs, channel commissions and non-room revenue. The ranges for August 2026 onward apply the 6.6% median error from the cross-check of the settled ADR estimate against disclosed operating results symmetrically above and below.
■ Limitations and caveats
The settled ADR estimate is an estimate derived from OTA and other sales data, not the actual average room rate of each property (median error 6.6%). Estimated OCC is an estimate based on the take-up of OTA-listed inventory and reads higher than actual room occupancy. City hotels have a thin sample of 20-21 properties, which makes single-month swings more likely, and a single-month value such as January 2026 (+49.1%) cannot be treated as the direction of the market. This article describes market-level conditions and does not guarantee the revenue of any individual property or the effect of any measure. Nor can the causes of the segment difference (guest mix, events, renovations, new openings) be identified from this data, so no definitive causal explanation is offered.
Data as of September 1, 2026. Sales conditions and inventory change daily, so the figures in this article are a snapshot as of the time of retrieval.
Frequently Asked Questions
What is the difference between the settled ADR estimate and the advertised price shown on OTAs?
The settled ADR estimate is the transacted price level estimated from OTA and other sales data (lowest-plan level x segment coefficient, ensembled across multiple channels), expressed on a tax-exclusive equivalent, per-room basis. The advertised price is the amount presented before sale, and does not reflect discounts or the price band at which rooms actually sold. All figures in this article are stated consistently as the settled ADR estimate, and no advertised-price levels are referenced. Cross-checks against disclosed operating results show a median error of 6.6%.
When city and business hotels post opposite year-on-year signs in the same prefecture and the same month, what should be checked first?
There are three checks, in order. First, the base year of the comparison: Miyagi city hotels in July 2026 are −11.5% year on year but +0.9% against July 2024, and the meaning changes depending on whether the prior year was unusually high or the market level has fallen. Second, the multiple between segments, which in Miyagi compressed from roughly 1.44 times to roughly 1.17 times. Third, the level of occupancy — as long as rate and occupancy are viewed separately, this kind of divergence gets missed.
How should a month be interpreted when estimated OCC stays in the 90s but rate falls below the prior year?
“Inventory was left over so prices were cut” is a hard explanation to sustain in this case. In July 2026, Miyagi contained days on which Saturday inventory was all but exhausted, and yet the monthly settled ADR estimate came in 11.5% below the prior year. In that situation, recovering the rate decline through occupancy would require estimated OCC to be lifted above 100%, so it is natural to examine how price was set rather than the occupancy side. That said, the causes of the segment difference (guest mix, events, renovations, new openings) cannot be identified from this data.
Can settled ADR estimates from August 2026 onward be compared directly with the prior year’s figures?
No. Values from August onward are estimates based on current sales conditions rather than finalized figures. All year-on-year comparisons in this article are calculated between finalized figures. Even when using them as directional material, the safer practice is to read them within the band produced by applying the 6.6% median estimation error directly (¥10,755-¥12,275 for Miyagi city hotels in August 2026) and to re-verify once the month has been finalized.
How should a sharply swinging single-month value such as +49.1% for city hotels in January 2026 be treated?
We recommend not using it as a basis for single-month judgment. Miyagi city hotels have a thin sample of 20-21 properties, and in a month with a small denominator the pricing and occupancy movements of individual properties feed straight into the average. In fact, rebuilding the average across February to July with January excluded puts city hotels at +4.7%, below business hotels at +7.8%, and changes the appearance of the first half entirely. Reading these figures alongside the thickness of the sample is a precondition.