

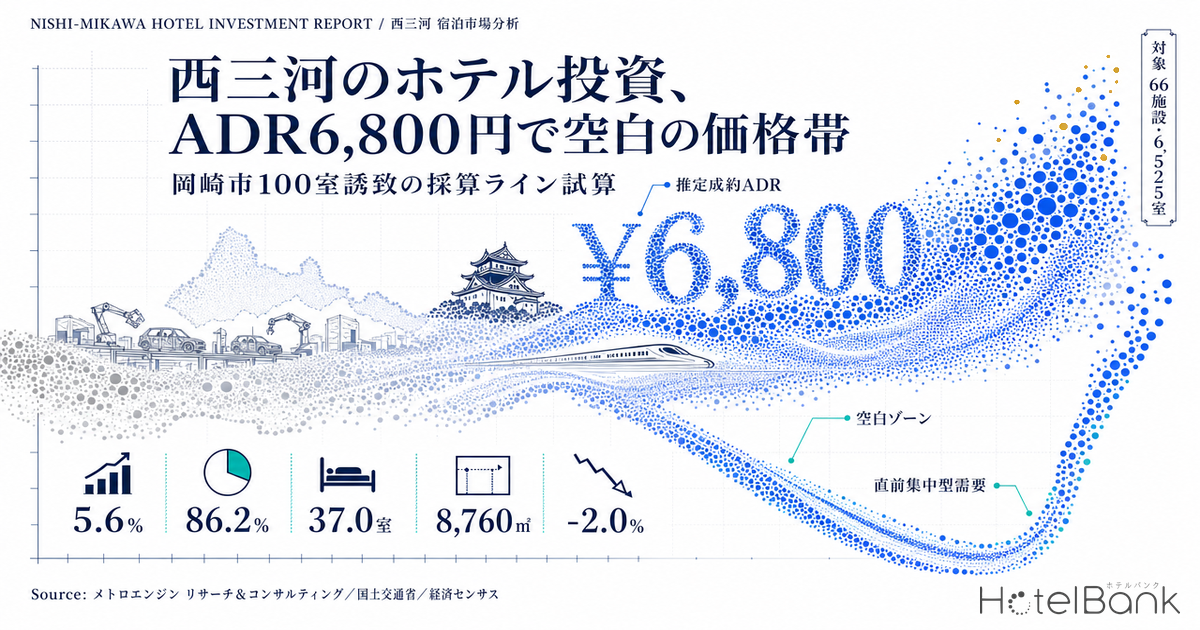
Nishi-Mikawa, in Aichi, is one of Japan’s densest business-travel markets: Toyota Motor and its principal suppliers cluster their headquarters and plants within a 20 km radius. Yet as a lodging market, Nishi-Mikawa is almost never discussed on its own terms — it sits in Nagoya’s shadow. This article maps the 66 properties and 6,525 rooms across the seven cities of Toyota, Okazaki, Anjo, Kariya, Chiryu, Nishio and Hekinan along two axes — estimated settled ADR and inventory pickup pace (occupancy by booking lead time) — to quantify which price band is actually vacant. We then run a feasibility estimate on the 100-room-plus hotel site Okazaki is currently tendering, using the published lease terms and prevailing construction costs.
Metric Definitions Used in This Article
- ADR (average daily rate): an estimated settled rate (tax-exclusive equivalent) derived by applying a segment-specific adjustment coefficient to each property’s lowest published plan level on OTAs and similar channels (double occupancy, per-room rate, tax-inclusive). Cross-checked against property-level actuals disclosed by listed hotel REITs (91 properties, most recent three months), the median error is approximately 7%. These are estimates and differ from each property’s actual transacted rates or accounting figures. Area-level ADR is the median across the properties in scope (the level of a typical property in that area).
- Occupancy (estimated, OTA-listed inventory basis): sold rooms as a share of total rooms in the area. This is an estimate based on how listed OTA inventory is absorbed, and differs from each property’s true operating occupancy.
- LT (lead time): days until the check-in date. LT30 = 30 days before check-in. Larger values indicate earlier points in time.
- Data sources: MetroEngines Research & Consulting / MLIT Real Estate Information Library / Ministry of Internal Affairs and Communications and METI, Economic Census for Business Activity / Okazaki City published materials
- — Rooms above an estimated settled ADR of ¥12,000 number just 366, or 5.6% (five properties). Of the 6,525 rooms across 66 properties in the seven Nishi-Mikawa cities, 86.2% sit below ¥10,000, and the band above is all but empty.
- — Of the 33 properties with more than 100 rooms, only one clears ¥12,000 (Okazaki, 132 rooms). Urban upper-midscale supply that combines scale with rate effectively does not exist.
- — The 1 km radius around Kariya Station has 37.0 rooms per 1,000 workers — only 40% of the 94.2 rooms around Mikawa-Anjo Station. Room stock is thin relative to the density of business demand.
- — Kariya stands at 52.4% at LT30 and absorbs a further 28.4pt by LT1 — a late-booking market. Difficulty holding rate over long lead times is one reason prices are stuck.
- — Okazaki’s tender site (8,760.06㎡, 100+ rooms) needs an estimated settled ADR of ¥11,906 for a 5% NOI yield at 100 rooms. That hurdle climbs steeply with scale: ¥16,189 at 150 rooms and ¥20,556 at 250 rooms.
Conclusion — demand density matches Nagoya; rates are two-thirds of it. The gap sits one tier above ¥12,000
The conclusion first. The estimated settled ADR across the six main Nishi-Mikawa cities averaged roughly ¥6,800 over the trailing 12 months. Over the same period Nakamura Ward in Nagoya ran at about ¥10,400 and Naka Ward at about ¥9,700 — placing Nishi-Mikawa at roughly two-thirds of central Nagoya’s rate level. Moreover, the median monthly ADR across the six cities was down an average of −2.0% year on year from January to July 2026, essentially flat, while Nakamura Ward rose 9.4% and Naka Ward 6.3% over the same months. The pattern suggests that the inbound-driven rate increase has stalled at central Nagoya and has not reached Nishi-Mikawa.
Demand depth, however, holds up well against Nagoya. Within a 1 km radius of Kariya Station there are 25,182 workers across 1,145 establishments, yet only 932 hotel rooms. That converts to 37.0 rooms per 1,000 workers — roughly 40% of the ratio around Mikawa-Anjo Station (94.2). The thinness of room stock relative to the density of business demand shows up not in price but in slow inventory absorption, and that is what defines this market.
Turning to the price-band distribution, 86.2% of the 6,525 rooms sit below an estimated settled ADR of ¥10,000, and only 366 rooms — 5.6% — clear ¥12,000. Three of the five properties above ¥12,000 are leisure properties along Mikawa Bay in Nishio City, which means that urban upper-midscale product capable of absorbing business demand is, across the whole of Nishi-Mikawa, essentially limited to a single 132-room property in Okazaki. The sections below test whether this white space is genuinely investable, working through demand, supply and feasibility in turn.
Price-band distribution — 86% of rooms below ¥10,000, only 366 rooms above ¥12,000
Start with the price-band structure of supply. The scope is 66 properties and 6,525 rooms located in the seven Nishi-Mikawa cities (Toyota, Okazaki, Anjo, Kariya, Chiryu, Nishio and Hekinan) that have at least 15 rooms and for which a trailing-12-month estimated settled ADR could be calculated.
| Estimated settled ADR band | Properties | Rooms | Room share | Typical segment |
|---|---|---|---|---|
| Up to ¥6,000 | 15 | 787 | 12.1% | Small business hotels |
| ¥6,000–8,000 | 29 | 3,225 | 49.4% | Chain limited-service (largest band) |
| ¥8,000–10,000 | 13 | 1,612 | 24.7% | Upper limited-service, station-front |
| ¥10,000–12,000 | 4 | 535 | 8.2% | With large communal bath and added facilities |
| ¥12,000–15,000 | 2 | 160 | 2.5% | Urban full-service |
| ¥15,000–20,000 | 2 | 183 | 2.8% | Urban full-service |
| ¥20,000 and above | 1 | 23 | 0.4% | Onsen ryokan (leisure) |
The ¥6,000–8,000 band alone accounts for 3,225 rooms, close to half the total, and the cumulative share below ¥10,000 reaches 86.2%. The three bands at ¥12,000 and above together come to just five properties and 366 rooms (5.6%). One of those — 23 rooms — is an onsen ryokan, which leaves only four properties and 343 rooms above ¥12,000 with the scale and facilities to absorb urban business and training demand.
The question is whether that gap exists because the market will not pay for higher-priced hotels, or simply because no one has built them. The next section turns to the demand-side indicators.
Positioning — two gaps appear on the room-count × ADR scatter
Plotting the 66 properties by room count (horizontal axis) against estimated settled ADR (vertical axis) shows the market splitting into two clear clusters.
Dense The occupied zone
¥6,000–10,000 × 60–210 rooms
38 properties and 4,479 rooms of chain limited-service crowd this zone. A new entrant can differentiate only on price.
Gap 1 Urban upper-midscale
¥12,000–18,000 × 100–200 rooms
Only one property qualifies (Okazaki, 132 rooms, about ¥16,300). The combination of scale and rate that would serve business, training and regional conference demand barely exists.
Gap 2 Small-scale high-end
Above ¥18,000 × 30–60 rooms
No properties qualify. The only property above ¥20,000 is a 23-room onsen ryokan, and there is nothing in the urban centers.
What stands out most on the scatter is how empty the upper-right quadrant is — above 100 rooms on the horizontal axis and above ¥12,000 on the vertical. There are 33 properties with more than 100 rooms, but only one sits at or above ¥12,000 (Okazaki, 132 rooms, estimated settled ADR of about ¥16,300); the other 32 all fall below ¥12,000. Put the other way, Nishi-Mikawa has effectively one property that carries enough rooms for scale economics while competing on rate.
Reading that gap as an opportunity, though, requires evidence that demand is willing to pay ¥12,000. The useful test here looks not at price but at the speed at which inventory clears.
Inventory pickup pace — Kariya is 52% at LT30, then absorbs 28pt in the final stretch
Tracking how listed OTA inventory clears by the number of days to check-in (lead time, or LT) shows that demand arrives on completely different schedules from city to city, even among comparable industrial centers. The curves below average three midweek dates: Wednesday 10 June, Wednesday 8 July and Wednesday 15 July 2026. All three check-in dates have passed, so the absorption outcome is settled.
| City | Properties | Rooms | LT60 | LT30 | LT14 | LT1 | LT30→LT1 pickup |
|---|---|---|---|---|---|---|---|
| Chiryu | 3 | 448 | 77.5% | 81.2% | 81.8% | 89.4% | +8.2pt |
| Nishio | 10-11 | 358-419 | 70.2% | 71.8% | 76.1% | 82.0% | +10.2pt |
| Toyota | 25-26 | 2,221-2,223 | 65.0% | 69.4% | 75.5% | 90.2% | +20.8pt |
| Okazaki | 12 | 957 | 48.6% | 60.6% | 67.3% | 83.7% | +23.1pt |
| Anjo | 11-13 | 1,392 | 53.1% | 57.4% | 66.2% | 84.4% | +27.0pt |
| Kariya | 7 | 773 | 50.0% | 52.4% | 59.3% | 80.8% | +28.4pt |
Kariya sits at 52.4% occupancy at LT30 (three-weekday average for June–July 2026, estimated on an OTA-listed inventory basis) — the lowest of the six cities — but then absorbs 28.4pt to reach 80.8% by LT1, the day before check-in. Anjo (+27.0pt) and Okazaki (+23.1pt) show the same late-booking profile. Chiryu, by contrast, has already built to 77.5% at LT60, and picks up only 8.2pt from LT30 onward.
That difference reflects not the volume of demand but when the demand materializes. Kariya, Anjo and Okazaki are likely to have a higher share of corporate demand where travel dates are set at short notice. In a market driven by late bookings, properties struggle to hold a high rate across long lead times, and prices tend to converge. Part of the structural reason Nishi-Mikawa’s ADR is stuck at two-thirds of Nagoya’s lies here.
The implication for investors is straightforward. No one in this market yet offers a product that captures late-breaking demand at a high rate — corporate contracts, same-day guaranteed availability, on-site meeting rooms and other features that serve last-minute decisions.
Demand density × room stock — the Kariya Station area has 37 rooms per 1,000 workers
The source of that late-booking demand is the working population, so we compare it against the room stock that has to absorb it, using the same 1 km station radius throughout. Employment figures come from the Economic Census for Business Activity; room counts are aggregated to the extent MetroEngines Research & Consulting tracks them.
| Hub (1 km radius) | Establishments | Workers | Per establishment | Office-sector share | Hotel rooms | Rooms per 1,000 workers |
|---|---|---|---|---|---|---|
| Kariya Station | 1,145 | 25,182 | 22.0 | 21.0% | 932 | 37.0 |
| Toyota-shi Station | 1,471 | 18,511 | 12.6 | 19.3% | 1,110 | 60.0 |
| Mikawa-Anjo Station | 608 | 13,232 | 21.8 | 19.6% | 1,247 | 94.2 |
| Okazaki Station (JR) | 910 | 10,767 | 11.8 | 10.2% | 307 | 28.5 |
| Higashi-Okazaki Station (Meitetsu) | 972 | 10,286 | 10.6 | 26.8% | 655 | 63.7 |
What distinguishes the Kariya Station area is that although it has fewer establishments than the Toyota-shi Station area (1,145 versus 1,471), it has more than 30% more workers, at 25,182. At 22.0 workers per establishment — the highest of the five hubs — it is a textbook business district built around large employers. Large establishments generate a continuous stream of visits from clients, contractors and group companies, which makes them a more stable base for lodging demand than a cluster of small firms.
Against that, room stock stands at 932. The resulting 37.0 rooms per 1,000 workers is 40% of the Mikawa-Anjo figure (94.2) and 60% of Toyota-shi’s (60.0). Mikawa-Anjo is a Shinkansen stop and draws lodging demand from a wider catchment, so the comparison is not exact — but the room supply around Kariya Station is clearly thin relative to the scale of employment.
That thinness, however, does not automatically translate into room for additional supply. Kariya’s inventory clears late, and close to half of it is still open at LT30. Adding rooms without raising rates would simply increase the number of properties carrying inventory to the last minute. What the market needs is not more rooms but a product that absorbs the same demand at a higher rate.
Rate trend — Nishi-Mikawa is down 2.0% year on year, diverging from central Nagoya’s rise
To test whether Nishi-Mikawa’s rates are structurally stuck or merely in a temporary correction, the monthly estimated settled ADR is shown as a year-over-year overlay.
The monthly median for the six main Nishi-Mikawa cities ran in a range of roughly ¥6,500–¥7,700 in 2025 and ¥6,300–¥7,200 from January to July 2026, averaging −2.0% year on year. By month, only March was positive, at +9.1%, while negative months dominate: −6.6% in June, −6.4% in July and −5.9% in January. Over the same January–July 2026 window, Nakamura Ward in Nagoya averaged +9.4% year on year and Naka Ward +6.3% — a clear increase.
That said, the −2.0% figure compares monthly medians across the six cities, and the direction diverges when each city is measured on its own. Four cities rose — Nishio +28.0%, Okazaki +4.9%, Toyota +1.8% and Kariya +1.4% — while two fell, Anjo −5.3% and Chiryu −2.8%. The median series declines because Anjo and Chiryu consistently occupy the middle of the six-city distribution, not because every Nishi-Mikawa city is cutting rates. Okazaki, the city whose feasibility this article models, is on the rising side, so reading Nishi-Mikawa as “a market that uniformly cannot raise rates” would be inaccurate. The area median may be flat, but the spread between cities is widening — a point worth holding onto when assessing site feasibility.
The divergence is also the flip side of Nishi-Mikawa’s lodging demand having narrowed almost entirely to domestic corporate travel. Because it does not track the rate increases driven by inbound and leisure demand, it can equally be read as more resilient to the economic cycle than central Nagoya. For funds underwriting long holds, low volatility is not necessarily a drawback. How far the swing in rates differs between city and business hotels across Aichi as a whole is examined against 18 months of confirmed figures in Aichi Settled ADR 18 Months: City Swings 25.0pt, Business 14.0pt.
Location and land prices — commercial land in front of Kariya Station is up 7.3%, the strongest in Nishi-Mikawa
From a site-acquisition standpoint, we next check published land prices at each hub, extracting Land Price Publication points in commercial-use zones around each station from the MLIT Real Estate Information Library.
| Location | Nearest station / distance | Use zone | FAR | 2024 | 2025 | 2026 | YoY |
|---|---|---|---|---|---|---|---|
| Kariya, Sakuramachi 1-24 | Kariya Station, 0 m | Commercial zone | 400% | ¥339,000 | ¥368,000 | ¥395,000 | +7.3% |
| Toyota, Wakamiyacho 1-8-1 and adjacent | Toyota-shi Station, 70 m | Commercial zone | 500% | ¥325,000 | ¥338,000 | ¥352,000 | +4.1% |
| Okazaki, Myodaiji-Honmachi 4-14 | Higashi-Okazaki Station, 130 m | Commercial zone | 600% | ¥298,000 | ¥308,000 | ¥311,000 | +1.0% |
| Anjo, Mikawa-Anjo Honmachi 2-1-1 and adjacent | Mikawa-Anjo Station, 320 m | Commercial zone | 400% | ¥274,000 | ¥287,000 | ¥301,000 | +4.9% |
| Okazaki (Okazaki Station East, block 18 and adjacent) | Okazaki Station, 250 m | Commercial zone | 400% | ¥241,000 | ¥253,000 | ¥257,000 | +1.6% |
| Okazaki, Myodaijicho Ikeshita 25-2 and adjacent | Higashi-Okazaki Station, 850 m | Neighborhood commercial zone | 300% | ¥139,000 | ¥144,000 | ¥148,000 | +2.8% |
The point in front of Kariya Station (Sakuramachi 1-24) reached ¥395,000/㎡ in 2026, up 7.3% year on year — the strongest increase in Nishi-Mikawa, and 16.5% above its 2024 level of ¥339,000 over two years. With commercial land across Aichi Prefecture decelerating to 3.2% growth in 2026 from 3.7% the prior year (Nikkei, March 2026), Kariya’s station front rising at more than double the prefectural average indicates that the land market is correctly pricing its employment density.
Conversely, acquiring land in front of Kariya Station to develop a hotel means recovering a ¥395,000/㎡ land cost from a product running at an estimated settled ADR of roughly ¥6,100 — not an easy proposition. The one structure currently on offer in Nishi-Mikawa that sidesteps this contradiction is Okazaki City’s fixed-term land lease scheme.
Okazaki’s 8,760㎡ tender — 100+ rooms, fixed-term land lease, opening from FY2028
On 27 April 2026, Okazaki City published the application guidelines for its “Okazaki City Hotel and Private Revenue Facility Attraction Project.” Part of the public-private program in the Otogawa Riverfront District (the QURUWA Strategy), the framework has the city granting a fixed-term business land lease and leasing the land for consideration, with the selected operator developing and running a hotel. It is currently the only hotel development opportunity in Nishi-Mikawa with published terms, which makes it concrete material for investors to test.
| Site 1 | Myodaiji-Honmachi 1-1-1 and six other parcels / 8,760.06㎡ |
| Breakdown | City-owned 7,695.19㎡ + privately owned 1,064.87㎡ |
| Site 2 | Myodaiji-Honmachi 1-22 / 1,013.89㎡ |
| Use zone | Commercial zone (80% building coverage, 400% FAR) |
| Fire and district plan | Quasi-fire prevention zone / Myodaiji-Honmachi district |
| Access | 7 min walk from Meitetsu Higashi-Okazaki Station / 7 min drive from Okazaki IC (Tomei) |
| Lease fee (2 June revision) | Site 1: ¥232/㎡/month; Site 2: ¥202/㎡/month |
| Lease term | 10 to under 50 years (per proposal) |
| Room count | 100 rooms or more |
| Room mix | Single + twin (at least 20% double-occupancy or larger) |
| Lobby | Open to non-guests, sized to capacity |
| Function rooms | Able to host training sessions and meetings |
| Food service | Available at breakfast, lunch and dinner |
| Parking | Spaces commensurate with room count or more |
| Proposal review | 29 October 2026 |
| Opening | FY2028 or later |
The specification itself is what stands out. At least 100 rooms, at least 20% twins, training and meeting facilities, food service across breakfast, lunch and dinner, and a lobby open to the public — this is not a limited-service brief but a match for exactly the urban upper-midscale product identified as the gap in the previous section. Okazaki appears to be asking for a tier above the ¥6,000–8,000 concentration that dominates existing supply.
The city’s market sounding, conducted from December 2025 to January 2026, drew 10 groups comprising 15 companies, and it has been disclosed that several proposed room counts in the 100–300 range. On parking, participants split between those who considered a multi-story structure hard to justify on investment grounds and those who wanted surface parking within the site. Since even a 100-room property needs more than 100 surface spaces, a site of 8,760.06㎡ leaves little slack. On whether the assumed schedule — construction starting from June 2027 and opening in FY2028 — is realistic, Hotel Build Times: 2.80-Year Median, 1.96 Solo vs 4.00 Mixed-Use sets out the distribution of build durations measured across 67 planned projects and is worth reading alongside this. The guidelines also set aside roughly 960㎡ as a riverfront-function site, while approximately 133.16㎡ for surrounding environmental facilities and approximately 678.17㎡ reserved for a district-plan road may not be built on.
Feasibility — at 100 rooms, a 5% NOI yield requires an estimated settled ADR of ¥11,906
Using the published terms, we model feasibility under three development scenarios. Construction cost is presented in two stages: first on a 2025 actual basis, then with construction-cost inflation between groundbreaking and completion built in.
Construction cost assumptions. Based on MLIT Construction Starts Statistics, 2025 hotel construction cost averaged ¥1.952 million per tsubo across all structural types (¥2.405 million for steel frame, ¥2.026 million for reinforced concrete). Scenario A, a lodging-led product, uses ¥2.20 million per tsubo, while Scenarios B and C, which carry food and meeting facilities, use ¥2.40 million per tsubo, both on a 2025 actual basis. For the second stage, we applied Turner & Townsend’s construction cost forecasts (+5.3% in 2026, +5.0% in 2027, +4.5% from 2028) and, taking mid-2028 as the midpoint of the construction period implied by the guidelines’ schedule (fixed-term lease contract from March 2027, construction start from June 2027, opening in FY2028 or later), compounded them forward. The resulting multiplier is 1.130, taking Scenario B from ¥2.40 million to ¥2.71 million per tsubo.
Ground rent assumptions. Applying the ¥232/㎡/month lease fee to Site 1’s 8,760.06㎡ gives annual ground rent of about ¥24.39 million. Note that the summary guidelines state that “the lease fee is expected to be reduced to one-third of the fee calculated on the basis of a real estate appraisal (a bill is scheduled for submission to the March 2027 regular session).” Because this is a fixed-term land lease, no land acquisition cost arises, and the model deducts ground rent from GOP as an operating expense.
| Item | A. Lodging-led, 100 rooms | B. Upper-midscale, 150 rooms Most worth testing | C. Large full-service, 250 rooms |
|---|---|---|---|
| Rooms | 100 | 150 | 250 |
| Gross floor area per room | 32㎡ | 40㎡ | 45㎡ |
| Gross floor area | 3,200㎡ | 6,000㎡ | 11,250㎡ |
| Cost per tsubo (2025 actual basis) | ¥2.20m | ¥2.40m | ¥2.40m |
| Total investment (2025 actual basis) | ¥2.39bn | ¥4.88bn | ¥9.15bn |
| Cost per tsubo (inflation-adjusted, mid-2028) | ¥2.49m | ¥2.71m | ¥2.71m |
| Total investment (inflation-adjusted) | ¥2.70bn | ¥5.51bn | ¥10.34bn |
| Total investment per room | ¥26.96m | ¥36.76m | ¥41.36m |
| Assumed estimated settled ADR | ¥9,000 | ¥13,000 | ¥11,000 |
| Assumed annual occupancy (full-year modeling assumption) | 74% | 76% | 74% |
| Ancillary revenue (as % of room revenue) | 10% | 35% | 30% |
| Total revenue | ¥267m | ¥730m | ¥966m |
| GOP margin | 45% | 33% | 30% |
| GOP | ¥120m | ¥241m | ¥290m |
| Annual ground rent | ¥24m | ¥24m | ¥24m |
| NOI yield (inflation-adjusted basis) | 3.6% | 3.9% | 2.6% |
| Estimated settled ADR required for a 5% NOI yield | ¥11,906 | ¥16,189 | ¥20,556 |
| Estimated settled ADR required for a 6% NOI yield | ¥13,922 | ¥19,164 | ¥24,482 |
The most important figure in the table is the last row: the required estimated settled ADR. Under Scenario A — 100 rooms, lodging-led — a 5% NOI yield requires an estimated settled ADR of about ¥11,900. That is roughly 1.7 times Okazaki’s current median of about ¥7,000, but the price-band distribution reviewed earlier already shows four properties and 535 rooms in the ¥10,000–12,000 band, so it is not out of reach.
Scenario B, by contrast, requires about ¥16,200 and Scenario C about ¥20,600. No urban hotel in Nishi-Mikawa achieves those levels today, so the feasibility hurdle rises sharply with scale. The same back-solve logic applied across Japan’s major markets is set out in Policy Rate 1.00%: Break-Even ADR Across Japan’s 8 Hotel Markets, which offers a comparison of how interest rate levels push the break-even line upward. While the sounding reportedly produced proposals spanning 100 to 300 rooms, the lower end of 100–150 rooms is the range that holds up on investment recovery.
Sensitivity analysis (Scenario B)
| Case | Total revenue | GOP | NOI | NOI yield |
|---|---|---|---|---|
| Base case (ADR ¥13,000 / occupancy 76%) | ¥730m | ¥241m | ¥217m | 3.9% |
| ADR −10% | ¥657m | ¥217m | ¥192m | 3.5% |
| Occupancy −5pt | ¥682m | ¥225m | ¥201m | 3.6% |
| ADR −10% and occupancy −5pt | ¥614m | ¥203m | ¥178m | 3.2% |
Scenario B holds 3.2% even in the downside case. The downside is contained, but the upside is equally capped by the weight of construction cost. Put another way, this project turns less on operating skill than on how far construction cost can be compressed. In that light, the fixed-term lease structure, with zero land acquisition cost, is decisive.
For reference, the nearby published land price (Okazaki, Myodaijicho Ikeshita 25-2 and adjacent; 850 m from Higashi-Okazaki Station; neighborhood commercial zone) stood at ¥148,000/㎡ in 2026. Acquiring 8,760.06㎡ at that level would cost about ¥1.30bn, against which annual ground rent of ¥24.39 million equates to 1.9%. Not having to own the land is precisely what makes NOI yields of 3.6% under Scenario A and 3.9% under Scenario B possible at all.
Two-axis sensitivity grid — Scenario B yields across 25 ADR × occupancy combinations
The preceding sensitivity analysis listed four cases. Holding the same formula and opening it out with estimated settled ADR on the vertical axis and assumed annual occupancy on the horizontal makes it immediately clear which variable drives this project. Every level shown is one already presented in this article (base, base ±10%, ±5 to 10pt, and the ADR required for 5% and 6% NOI yields); no new assumptions are introduced.
| Estimated settled ADR \ assumed annual occupancy | 66% −10pt | 71% −5pt | 74% A and C assumption | 76% B assumption | 81% +5pt |
|---|---|---|---|---|---|
| ¥11,700 base −10% | 2.9% | 3.2% ● | 3.3% | 3.5% ● | 3.7% |
| ¥13,000 base | 3.3% | 3.6% ● | 3.8% | 3.9% ● | 4.2% |
| ¥14,300 base +10% | 3.7% | 4.0% | 4.2% | 4.3% | 4.6% |
| ¥16,189 level required for a 5% yield | 4.2% | 4.6% | 4.8% | 5.0% ● | 5.3% |
| ¥19,164 level required for a 6% yield | 5.1% | 5.5% | 5.8% | 6.0% ● | 6.4% |
Read vertically, lifting the estimated settled ADR from ¥11,700 to ¥19,164 — a 63.8% increase — moves the NOI yield from 3.5% to 6.0%, a 2.5pt swing. Read horizontally, adding 15pt of occupancy from 66% to 81% moves it from 3.3% to 4.2%, only 0.9pt. Uncertainty in this project is governed by rate, not occupancy.
Seven of the 25 cells reach an NOI yield of 5% or better, and all seven sit in the two rows at ¥16,189 and above. The ¥14,300 row tops out at 4.6% even with an 81% full-year occupancy assumption, so occupancy alone cannot get there. Translated into three scenarios: pessimistic (¥11,700 × 66%) 2.9%, mid-case (¥13,000 × 76%) 3.9%, optimistic (¥14,300 × 81%) 4.6%. The conclusion from the earlier analysis — fill the gap by going up, not by going big — shows up here as the difference between how the vertical and horizontal axes behave.
Supply and risk — no new openings identified in Nishi-Mikawa since 2025
In investment terms, the risk of competing new supply ranks alongside rate risk. To the extent MetroEngines Research & Consulting tracks them, Aichi Prefecture saw 14 new openings in 2025 and 12 in 2026, but most were in Nagoya City, with the remainder in Inuyama, Togo, Toyokawa and Mihama. No new openings can be identified anywhere in Nishi-Mikawa’s nine cities and one town in either 2025 or 2026.
Similarly, building plans tracked in Aichi Prefecture under MLIT’s “Building Dynamics Statistics Survey” number two hotels (170 rooms in Naka Ward, Nagoya, and 100 rooms in Nishi Ward, Nagoya), neither in Nishi-Mikawa. Note that these are on a building-confirmation basis as of the survey date; further filings are expected to raise both project and room counts, so the figure should be read as a floor for the currently confirmed pipeline.
Alongside the thin supply pipeline, no listed hotel REIT holds a property in Nishi-Mikawa. The seven hotel-focused J-REITs hold 10 properties in Aichi Prefecture, located in Nagoya City (five), Tokoname, Tahara, Mihama in Chita District, Handa and Toyokawa — none in Nishi-Mikawa. That can be read as a market institutional capital has yet to enter, or conversely as one where securing liquidity at exit becomes a live question. It suits funds underwriting long holds, or corporate-led development financed through syndication with regional financial institutions.
For a long hold, the catchment’s demographics also warrant a check. According to MLIT National Land Numerical Information’s projected future population by 250 m mesh, the change in resident population within a 1.5 km station radius from 2025 to 2040 is −1.4% for Kariya Station (32,925 to 32,476), −2.1% for Okazaki Station (49,310 to 48,257) and −4.4% for Toyota-shi Station (31,069 to 29,706). The Kariya Station area has a working-age population share of 65.1% and an elderly share of 21.4%, and its pace of population decline is gentle even against the national average. Even assuming a 50-year fixed-term lease or a long asset hold, the risk of catchment contraction looks contained.
The risk factors sort into three. First, Nishi-Mikawa’s lodging demand correlates closely with capital expenditure and production in the automotive industry, leaving it heavily dependent on a single sector. Second, a booking profile dominated by late demand makes it hard to defend rate when demand weakens. Third, if construction cost inflation persists, the required ADR will run above the levels modeled here. All three are risks that can be mitigated by keeping scale — and therefore initial investment — down.
Conclusion — the gap is real, but the way to fill it is upward, not bigger
The analysis comes down to five points.
| Question | What the data shows |
|---|---|
| The price-band gap | Of 66 properties and 6,525 rooms, only 366 rooms (5.6%) clear an estimated settled ADR of ¥12,000. Among the 33 properties with more than 100 rooms, just one — 132 rooms in Okazaki — sits at ¥12,000 or above, so urban upper-midscale supply barely exists. |
| Demand density | The 1 km radius around Kariya Station holds 25,182 workers at 22.0 per establishment, a large-employer profile. Room stock is a thin 932, or 37.0 rooms per 1,000 workers. |
| Demand timing | Kariya runs 52.4% occupancy at LT30 and absorbs a further 28.4pt by LT1 — a late-booking market. Difficulty holding rate over long lead times is part of why prices are stuck. |
| Supply environment | No new openings can be identified in Nishi-Mikawa in either 2025 or 2026, and both hotels in the prefecture’s building-plan pipeline are in Nagoya. Hotel-focused J-REITs hold nothing in the area. |
| Feasibility | Okazaki’s fixed-term lease site (8,760.06㎡, 100+ rooms) needs an estimated settled ADR of about ¥11,900 for a 5% NOI yield at 100 rooms. The hurdle climbs steeply with scale, to about ¥16,200 at 150 rooms and about ¥20,600 at 250. |
The price-band gap in Nishi-Mikawa is real. The way to fill it, however, is not by adding rooms. Kariya’s thinness at 37.0 rooms per 1,000 workers signals room for additional supply, but it equally signals that with inventory still open until the last minute, adding rooms without raising rates will be hard to recover. As the model shows, scaling to 150 and then 250 rooms pushes the required ADR to about ¥16,200 and about ¥20,600 — steadily further from what the Nishi-Mikawa market actually supports.
Conversely, a design held to roughly 100 rooms that reliably captures late corporate demand through training and meeting facilities and food service needs about ¥11,900. That sits just above the existing ¥10,000–12,000 band (four properties, 535 rooms) and is within reach on product merit. Okazaki’s proposal review falls on 29 October 2026, with the preferred negotiating party to be selected in early November. As the only development opportunity in Nishi-Mikawa with published terms, it is well worth testing.
⚠ Note on the analytical data: The estimated settled ADR and occupancy figures in this article are estimates based on observation of sales inventory published on OTAs, and differ from each property’s actual transacted rates and true operating occupancy. The development scenario figures are simplified estimates based on published terms and general industry benchmarks; an actual investment decision requires a detailed feasibility study. Okazaki City’s project terms reflect materials published as of the time of writing (August 2026) and may change.
Related reading
- Policy Rate 1.00%: Break-Even ADR Across Japan’s 8 Hotel Markets
- Aichi Settled ADR 18 Months: City Swings 25.0pt, Business 14.0pt
- Hotel Build Times: 2.80-Year Median, 1.96 Solo vs 4.00 Mixed-Use
- Hotel vs Condo Land Rivalry: ADR-Implied Feasible Land Price Map
- Station Premium Ends at an 8-Minute Walk: 8 Stations, 1,012 Hotels
- Construction +41% & Labor Crunch Erase Japan’s 2027-2029 Hotel Supply
- Nagoya Pipeline 2026-2033: Conrad, Andaz & ¥32,628/¥34,115 ADR Flattening
References and Sources
■ Data sources
This article draws on three series with different populations. (1) Price-band distribution, positioning map and distribution map: 66 properties and 6,525 rooms located in the seven Nishi-Mikawa cities (Toyota, Okazaki, Anjo, Kariya, Chiryu, Nishio and Hekinan) with at least 15 rooms and for which an estimated settled ADR could be calculated for August 2025 to July 2026. (2) Monthly area estimated settled ADR and year-on-year change: the monthly median by city across the six main Nishi-Mikawa cities (excluding Hekinan). (3) Occupancy by lead time: estimates on an OTA-listed inventory basis, averaging the three weekday check-ins of 10 June, 8 July and 15 July 2026 by city, with property and room counts as shown in Table 2 covering all listed properties in each city. Employment data comes from the Economic Census for Business Activity (2021), land prices from the Real Estate Information Library, future population from National Land Numerical Information, and project terms from Okazaki City’s published materials. The 1 km and 1.5 km radii are circles centered on each station.
■ Modeling assumptions
Construction cost converts gross floor area to tsubo and applies ¥2.20 million per tsubo for Scenario A and ¥2.40 million per tsubo for Scenarios B and C (2025 actual basis), then a coefficient of 1.12 covering pre-opening costs, furniture, fixtures and equipment to arrive at total investment. Taking mid-2028 as the midpoint between groundbreaking and completion, a compounded multiplier of 1.130 was applied based on construction cost forecasts (+5.3% in 2026, +5.0% in 2027, +4.5% from 2028). Total revenue = estimated settled ADR × rooms × 365 days × assumed annual occupancy × (1 + ancillary revenue ratio); GOP = total revenue × GOP margin; NOI = GOP − annual ground rent of ¥24m; NOI yield = NOI ÷ inflation-adjusted total investment. All assumed annual occupancy figures are full-year modeling assumptions, not observed occupancy. No land acquisition cost is included, as the scheme is a fixed-term land lease.
■ Limitations and caveats
Estimated settled ADR applies segment-specific adjustment coefficients to observed OTA-published inventory; cross-checked against property-level actuals disclosed by listed hotel REITs (91 properties, most recent three months), the median error is approximately 7%. It differs from each property’s actual transacted rates and accounting figures. Occupancy is an estimate based on how inventory published on OTAs is absorbed, not each property’s true operating occupancy. Series (1) and (2) above treat Hekinan differently, so figures from the two should not be subtracted from one another. Employment data reflects the 2021 survey date, published land prices are as of 1 January of each year, and future population is on a resident-population basis, excluding daytime and transient population. GOP margins, ancillary revenue ratios and assumed annual occupancy are general segment benchmarks, not any specific property’s actuals. This article is a simplified estimate for initial market understanding; an investment decision requires a detailed feasibility study.
■ Market data
- MetroEngines Research & Consulting — estimated settled ADR (N=66 properties, August 2025 to July 2026), occupancy by lead time (estimated, OTA-listed inventory basis), room and property counts, new opening data (based on confirmed OTA listings)
■ Government statistics and public data
- MLIT Real Estate Information Library — Land Price Publication (2024–2026) and use zones
- MLIT National Land Numerical Information — projected future population by 250 m mesh (2024 National Institute estimates)
- Ministry of Internal Affairs and Communications and METI, “Economic Census for Business Activity (2021)” (boundaries: 2020 Population Census small areas)
- MLIT “Construction Starts Statistics” (hotel construction cost per tsubo)
- MLIT “Building Dynamics Statistics Survey” (hotel pipeline on a building-plan basis)
- Aichi Prefecture land price information (Land Price Survey and Land Price Publication)
■ Municipal publications
- Okazaki City, “Publication of the application guidelines for the Okazaki City Hotel and Private Revenue Facility Attraction Project” (press release, 27 April 2026)
- Okazaki City, “QURUWA District Hotel Attraction Promotion Project” (application guidelines [revised 2 June] and summary of sounding results)
■ REIT and industry data
- Invincible Investment Corporation portfolio disclosure (GOP margin actuals)
- MetroEngines Research & Consulting REIT ownership master (seven hotel-focused J-REITs, 302 properties, as of August 2026)
■ Press