

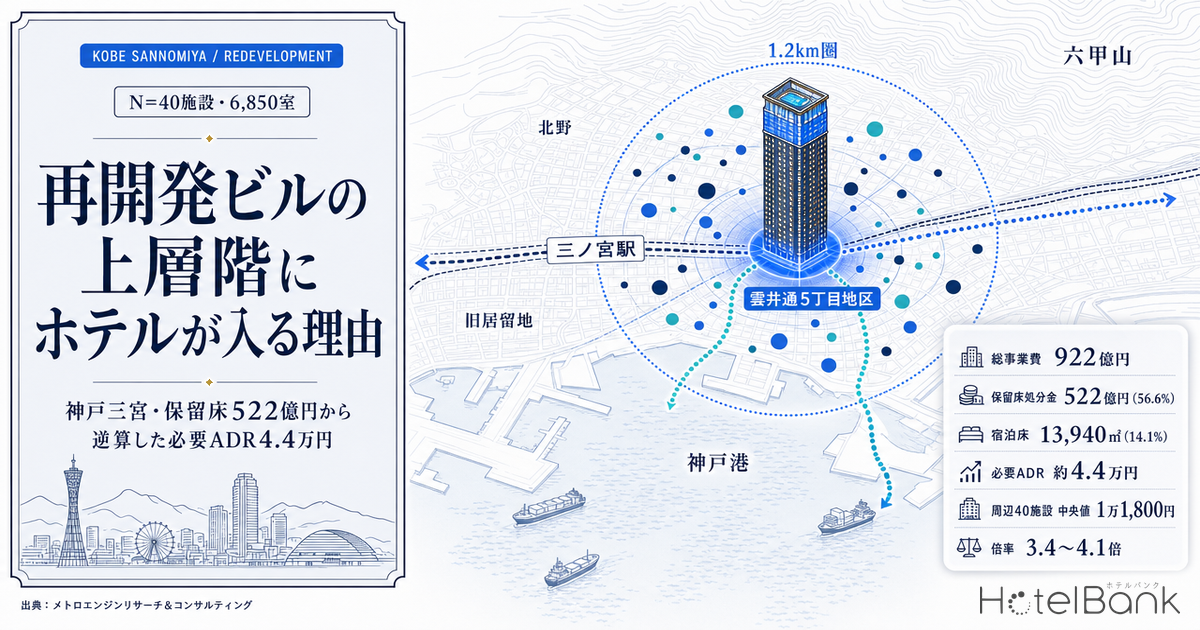
In front of Kobe’s Sannomiya station, a 32-storey, roughly 163m-tall mixed-use tower is rising. It is the Kobe Sannomiya Kumoidori 5-chome District Type 1 Urban Redevelopment Project. A bus terminal, a hall and a library occupy the lower floors, offices the middle floors, and lodging everything from the 24th floor up. This “the higher you go, the more it becomes guestrooms” cross-section is a pattern that keeps reappearing in station-front redevelopments across Japan. This article uses the actual figures in the project plan published by the City of Kobe, together with room-rate data for the Sannomiya area, to show that the arrangement is not the outcome of design but the consequence of a funding plan.
Metric Definitions Used in This Article
- ADR (average daily rate): An estimated settled rate (tax-exclusive equivalent) calculated by applying a category-specific adjustment factor to the lowest published plan rate each property lists on OTAs (double occupancy, per-room rate, tax-included). Cross-checked against property-level results disclosed by listed hotel REITs (91 properties, most recent three months), the median error is approximately 7%. These are estimates and differ from each property’s actual transacted rates and accounting figures. Area-level ADR is the median of the properties covered (the level of a typical property in the area).
- OCC (occupancy rate): The share of rooms sold against total rooms in the area (an estimate based on OTA sales inventory). It is an estimate based on how listed OTA inventory is absorbed and differs from a property’s actual overall occupancy. Used only at the prefecture and municipality level.
- Reserved floor space (horyuyuka): Floor space generated in an urban redevelopment project beyond the rights-conversion floor space allocated to prior rights holders. It is sold to third parties, and the proceeds serve as the main funding source for the project cost.
- Data sources: MetroEngines Research & Consulting / public documents from the City of Kobe, Hyogo Prefecture and the Ministry of Land, Infrastructure, Transport and Tourism
- — The revenue side of the ¥92.2bn total project cost consists of ¥52.2bn (56.6%) in reserved floor sale proceeds and ¥37.0bn (40.1%) in urban redevelopment subsidies. Sixty percent has to be recovered by selling floor space.
- — Public and civic floor space accounts for 42.1% of the 99,130㎡ gross floor area. Because more than four-tenths cannot be sold at a high market price, the recovery burden per square metre of the remaining revenue-generating floor space rises.
- — Against a designated FAR of 700%, the planned FAR is approximately 1,019% (1.46x). The roughly 26,300㎡ of additional capacity is the source of the reserved floor space created beyond the rights-conversion floor space.
- — On a pro-rata basis the 13,940㎡ of lodging floor space carries approximately ¥7.34bn, or roughly ¥113m per room at 65 rooms. The back-calculated required ADR is approximately ¥44,000.
- — The median estimated ADR across 40 properties within 1.2km of Sannomiya is ¥11,800, making the required ADR 3.4-4.1x that level. The project only works on the premise of creating a price band that does not exist nearby.
56.6% of the funding is floor sale proceeds — breaking down the ¥92.2bn in the project plan
An urban redevelopment project is an area-based development method under the Urban Renewal Act. Rights to the former land and buildings are converted into floor space in the new building (rights-conversion floor space), and the surplus floor space created by intensifying land use becomes reserved floor space that is sold to third parties. The proceeds, together with public subsidies, cover the project cost. Whether the reserved floor space sells at the assumed price therefore all but determines whether the project stands up.
In the case of the Kumoidori 5-chome district, the project plan published by the implementing entity, Kumoidori 5-chome Redevelopment Co., Ltd., with the City of Kobe’s approval (initial approval March 2021; second revised approval 22 January 2025), sets out the funding plan down to the exact amounts. The total is ¥92,246m. The revenue breakdown is as follows.
| Expenditure | ¥m | Revenue | ¥m | Share |
|---|---|---|---|---|
| Survey, design and planning costs | 3,595 | Urban redevelopment subsidy | 37,000 | 40.1% |
| Land preparation costs (demolition 6,081, compensation 17,827) | 23,908 | Public facility administrator contribution | 3,065 | 3.3% |
| Construction costs (building works 60,681 and other) | 62,565 | Reserved floor sale proceeds | 52,181 | 56.6% |
| Administrative and other costs | 1,878 | |||
| Interest on borrowings | 300 | |||
| Total | 92,246 | Total | 92,246 | 100.0% |
Of the just under ¥92.1bn in revenue, public money accounts for ¥40.065bn — ¥37.0bn in subsidies plus ¥3.065bn in public facility administrator contributions — or 43.4%. The remaining ¥52.2bn, fully 56.6%, is proceeds from selling floor space. The subsidy cost-sharing ratios are also published: according to Hyogo Prefecture’s investment project evaluation report, land preparation costs and joint facility development costs are split 4.5/10 national, 2/10 prefectural, 2.5/10 municipal and 1/10 developer, while survey, design and planning costs are split 1/3 national, 1/6 prefectural, 1/6 municipal and 1/3 developer.
What this shows is a simple fact. Subsidies fill four-tenths of the project cost, but six-tenths has to be recovered by selling floor space. The design philosophy of the project is therefore governed from the outset by the question of how much floor space that sells at a high price it can create. When discussing funding routes for hotel development, the reason redevelopment schemes are so often chosen is precisely this distinctive monetisation device called reserved floor space.
Who holds which floors — breaking down 99,000㎡ by use
The project plan discloses the roughly 99,130㎡ of gross floor area by use and by floor level. Looking at it makes clear why the building’s cross-section runs in the order it does.
| Use | Floors | Gross floor area | Share | Character of the floor space |
|---|---|---|---|---|
| Bus terminal facilities | B2F to 3F | 10,870㎡ | 11.0% | Built as a national direct-control road project |
| Retail facilities | B1F to 3F | 10,840㎡ | 10.9% | Revenue floor space including street-level stores |
| Civic facilities (hall and library) | B2F, 1F to 10F | 30,830㎡ | 31.1% | Developed by the City of Kobe |
| Office facilities | 9F to 23F | 24,700㎡ | 24.9% | Revenue floor space (rental office) |
| Lodging facilities | B2F, 2F, 10F, 23F to 32F, PH1 | 13,940㎡ | 14.1% | Revenue floor space (hotel) |
| Parking | B3F to 1F | 7,950㎡ | 8.0% | 224 cars, 364 bicycles, 17 motorcycles |
| Total | 3 basement / 32 above-ground / 2 penthouse floors | 99,130㎡ | 100.0% | Approx. 163m tall |
The uses of the lower floors are all but fixed by policy. The bus terminal is a national direct-control road project under the “Route 2 and Kobe Sannomiya Station Front Space Development Project Plan” formulated by the Ministry of Land, Infrastructure, Transport and Tourism and the City of Kobe, while the hall (a main hall of roughly 1,800 seats plus multipurpose space) and the library are civic facilities positioned within the City of Kobe’s own plans. Together they occupy 41,700㎡, or 42.1% of the gross floor area. That four-tenths-plus is not floor space intended to be sold high at market prices.
That leaves retail, office, lodging and parking to carry most of the ¥52.2bn in reserved floor sale proceeds. Of those, retail sits low in the building from B1F to 3F: the floorplates are large but the ceiling on unit value is tied to street-level retail rent levels. The office component spans 15 levels from 9F to 23F for 24,700㎡, with column-free floorplates of about 350 tsubo — among the largest in the Sannomiya area — as its selling point. And the lodging facility is placed at the very top, on floors 23 to 32.
What matters here is that different uses value floor height with different sensitivity. Office rents within the same building typically differ between low and high floors by only a few percent to the low teens. For a hotel, by contrast, the view feeds directly into the room rate. In a city like Kobe, hemmed in between sea and mountains with unambiguous scenic assets, that gap widens further. For the same square metre of floor space, the use that can place the highest marginal value on the top of the building is a hotel. That is why the upper floors become a hotel.
Building 1,019% on a 700% FAR site — the uplift creates the reserved floor space
The other precondition is floor area ratio (FAR). Querying the zoning data in the MLIT Real Estate Information Library for the coordinates of the project district shows the site is a commercial zone with a designated FAR of 700% and a building coverage ratio of 80% (immediately around Sannomiya Station it is 800%). The planned figures in the project plan, meanwhile, are a building site area of approximately 8,230㎡ against a FAR-counted floor area of approximately 83,870㎡, a FAR of approximately 1,019% and a building coverage ratio of approximately 93%.
| Building site area | approx. 8,230㎡ |
| Designated FAR (commercial zone) | 700% |
| FAR-counted area at the designated FAR | approx. 57,600㎡ |
| Planned FAR-counted area | approx. 83,870㎡ |
| Additional capacity | approx. 26,300㎡ (+45.6%) |
| Planned FAR | approx. 1,019% |
| Total project cost ÷ gross floor area | approx. ¥931,000/㎡ |
| Building works cost ÷ gross floor area | approx. ¥612,000/㎡ |
| Same, per tsubo | approx. ¥2.02m/tsubo |
| Reserved floor sale proceeds ÷ gross floor area | approx. ¥526,000/㎡ |
Construction cost is a rough unit rate obtained by dividing by a gross floor area that includes parking and public facilities. Per MLIT construction starts statistics, 2025 hotel construction costs averaged ¥1.952m/tsubo across all structural types and ¥2.405m/tsubo for steel-frame construction, so the ¥2.02m/tsubo for this steel-frame (partly SRC) project falls within that range.
At the designated FAR the FAR-counted area would stop at roughly 57,600㎡. The plan exceeds that by about 26,300㎡. That uplift is the source of the floor space created beyond the rights-conversion floor space — in other words, of the reserved floor space. The building coverage ratio is likewise approximately 93% against a designated 80%, but that is a level explicable by stacking up the allowances for fire-resistant buildings in fire prevention districts and for corner lots. An urban redevelopment project can equally be described as a device for institutionally securing an uplift in the FAR allowed under city planning and then monetising it in the form of floor space.
This is the point at which analysis of zoning, FAR and land prices — reading development headroom from the regulatory side — connects with analysis of the redevelopment scheme. The former asks where and how much can be built; a redevelopment project asks how to use the system to move the ceiling itself, and how to monetise the amount by which it moved.
The locational case — land prices up 41% in seven years, 133,000 workers within 1km
The grounds for expecting the reserved floor space to sell at the assumed price lie in the location. Querying the published land price survey points around the project district in the MLIT Real Estate Information Library shows that the two nearest points were both up 9.0% year on year as of 1 January 2026, with growth accelerating.
The survey point at Miyuki-dori 5-chome, 470m from Sannomiya Station, rose from ¥705,000/㎡ in 2019 to ¥995,000/㎡ in 2026, up 41.1% over seven years. The Yahata-dori 3-chome point, 580m away, rose from ¥755,000/㎡ to ¥1,010,000/㎡, up 33.8%, crossing the ¥1m/㎡ mark in 2026. After dipping into negative territory in 2021-2022, the acceleration from 2024 onward is unmistakable. Both are commercial-zone sites with a designated FAR of 600%, a building coverage ratio of 80% and fire prevention district status.
| Establishments | 10,545 |
| Workers | 132,934 |
| Of which office-based | 28,259 (21.3%) |
Aggregated over 141 small-area units from the 2020 Population Census. These are workplace-based rather than residence-based figures; they are not lodging demand as such, but they indicate the depth of the demand base for office floor space.
The scale of the transport interchange is also worth confirming. According to station passenger data in the National Land Numerical Information, daily boardings and alightings at JR Sannomiya Station peaked recently at 250,268 in 2019, fell to 183,956 in 2020, and had recovered to 231,870 by 2023 — 92.6% of the 2019 level.
Layered on top of that are Hankyu Kobe-Sannomiya (89,189 in 2023), Hanshin Kobe-Sannomiya (107,270), Kobe Municipal Subway Sannomiya (120,008), Sannomiya-Hanadokeimae on the same network (16,166) and Port Liner Sannomiya (66,406). The simple sum across the six stations is about 631,000 per day. The project plan cites the dispersal of stations and medium- and long-distance bus stops, and the resulting poor convenience of transferring between them, as a condition of the district — the picture being that consolidating the bus terminal is meant to improve it.
40 properties and 6,850 rooms within 1.2km — median estimated ADR ¥11,800, and a void in the ¥20,000s
So which price band will the lodging floor space placed there have to target? Extracting, from the hotels and ryokan with confirmed operations within a 1.2km radius of the project district, those with at least six months of estimated settled ADR over the most recent 12 months (August 2025 to July 2026) yields N=40 properties and 6,850 rooms in total. Their distribution is shown below.
Dense The occupied zone
Estimated ADR ¥6,400-¥18,500 x 30-310 rooms
37 of the 40 properties fall here. Limited-service and mid-sized city hotels form layers, leaving little room for a new entrant to differentiate.
Void 1 Mid-sized upper tier
Estimated ADR ¥20,000-¥60,000 x 50-250 rooms
Only one property sits inside this rectangle. In the station-front catchment of Sannomiya there is virtually no property that combines scale with a high rate.
Void 2 High-rise selling the view
The top property is a 30-room house on the Kitano slope
The highest estimated ADR in the catchment belongs to a 30-room boutique property, and it sits on the Kitano hillside rather than in front of the station. Tower-format high-rate product does not exist in the current stock.
The median estimated ADR is ¥11,800. Not a single property sits between ¥18,500 and ¥43,600 — the entire ¥20,000s band is empty. The top two are a 30-room boutique hotel on the Kitano slope (estimated ADR approximately ¥57,700) and a 116-room property towards the Former Foreign Settlement (approximately ¥43,700). In terms of category mix and rates across major cities, Sannomiya has the classic regional-hub composition of a thick economy layer plus a very thin high-rate layer.
This void does not mean the market will not tolerate high rates. Estimated settled ADR in Chuo-ku, Kobe has been rising steadily.
Comparing January-July averages: approximately ¥9,100 in 2024, approximately ¥10,500 in 2025 and approximately ¥11,000 in 2026. That is +4.6% year on year in 2026 and +21.0% against the same period in 2024. Supply and demand have also tightened. Estimated occupancy across Hyogo Prefecture in July 2026 was 89.3% for city hotels (42 properties, 8,072 rooms) and 90.9% for business hotels (145 properties, 16,690 rooms). For where central Kobe sits among the prefecture’s rate tiers, an analysis of Hyogo’s rate structure across five layers gives the full picture.
| Category | Properties | Rooms | Estimated occupancy | Average listed price |
|---|---|---|---|---|
| All properties | 710 | 32,678 | 88.7% | ¥24,600 |
| Business hotels | 145 | 16,690 | 90.9% | ¥13,600 |
| City hotels | 42 | 8,072 | 89.3% | ¥20,800 |
| Resort hotels | 42 | 2,221 | 83.7% | ¥37,900 |
| Ryokan | 189 | 3,580 | 82.8% | ¥35,500 |
Demand is strong and rates are rising. That there is still zero inventory in the ¥20,000s is because much of the existing stock consists of limited-service properties built between the 1980s and the 2000s, and renovation alone cannot change either room size or the view. The high-rate band is a layer that does not exist unless it is built. The upper floors of a redevelopment are among the few pieces of floor space that can fill that void.
The ¥7.3bn the lodging floors carry — a back-calculated required ADR of about ¥44,000
Putting these figures side by side reveals the economic hurdle imposed on the lodging floor space. Allocating the ¥52.2bn in reserved floor sale proceeds pro rata by gross floor area, the 13,940㎡ lodging facility (14.1% of the gross floor area) bears approximately ¥7.34bn.
According to the press release, this lodging floor space is planned for 60-70 guestrooms (standard rooms of approximately 35㎡). Dividing by the midpoint of 65 rooms gives approximately ¥113m per room — by no means a low level as a per-room acquisition price for an urban luxury hotel.
Working backwards to the room rate this floor space needs in order to stand up as an investment: the assumptions are a capitalisation rate (NOI cap rate) of 5.0%, a GOP margin of 30% (the level of a full-service city hotel), a room-revenue share of total revenue of 50-70%, estimated occupancy of 70-75% and 65 rooms. On that setting, the required NOI is approximately ¥367m a year and required total revenue approximately ¥1.223bn.
| Room-revenue share \ Estimated occupancy | 65% | 70% * | 75% * | 80% |
|---|---|---|---|---|
| 50% (heavy weighting toward banquets, weddings and F&B) | ¥39,700 | ¥36,800 | ¥34,400 | ¥32,200 |
| 60% (mid case) | ¥47,600 | ¥44,200 | ¥41,200 | ¥38,700 |
| 70% (heavy weighting toward rooms) | ¥55,500 | ¥51,500 | ¥48,100 | ¥45,100 |
| Rooms sold per year (65 rooms x 365 days) | 15,421 | 16,608 | 17,794 | 18,980 |
Swinging the cap rate, in the case of a 60% room-revenue share and 70% occupancy (a full-year calculation basis), gives approximately ¥39,800 at 4.5%, approximately ¥44,200 at 5.0% and approximately ¥48,600 at 5.5%. Even at the extremes, the required ADR stays within a range of ¥34,400 to ¥51,500.
| Sensitivity analysis (60% room-revenue share, 70% occupancy / full-year calculation basis) | Cap rate 4.5% | 5.0% | 5.5% |
|---|---|---|---|
| Required NOI (annual) | ¥330m | ¥367m | ¥404m |
| Required total revenue (annual) | ¥1.101bn | ¥1.223bn | ¥1.345bn |
| Required ADR | ¥39,800 | ¥44,200 | ¥48,600 |
| Multiple of the 40-property median (¥11,800) | 3.4x | 3.7x | 4.1x |
On the pro-rata assumption: This calculation allocates the reserved floor sale proceeds by a simple pro rata of gross floor area. In practice, upper-floor space is customarily disposed of at a higher unit price than lower-floor space, and the civic facilities (30,830㎡) and bus terminal facilities (10,870㎡) are handled on public-sector acquisition terms rather than at market prices. The amount the lodging floor space actually bears is therefore biased toward being larger than the ¥7.34bn shown here. The required ADR range should be read as a lower-bound guide.
That is 3.4-4.1x the ¥11,800 median estimated ADR within 1.2km of Sannomiya. This multiple explains in figures why a hotel has to go on the upper floors. A limited-service property selling at prevailing local rates cannot recover its pro-rata share of the reserved floor sale proceeds. Selling the floor space high enough to make the project work leaves no option but to create product in a price band that does not exist nearby — and that requires the view and the room size, the differentiators that can only be built at the top of the tower.
In fact, the published plan comprises 35㎡ standard rooms, a 30m-wide infinity pool and spa on the top floor, restaurants and bars exploiting the view, plus a chapel and banquet space, using the 13,940㎡ of lodging floor space for 60-70 rooms. Gross floor area per room works out at approximately 200-230㎡ (199㎡ at 70 rooms, 232㎡ at 60 rooms), showing that a substantial share of the area is allocated to facilities other than guestrooms. Combining weddings, banquets and F&B to lower the room-revenue share moves the required ADR toward the upper rows of the table. The mix of uses is itself designed to bring the required ADR down.
How far does this pattern generalise — four metrics for reading redevelopment hotel floors
The Kumoidori 5-chome figures yield a set of practical metrics for assessing hotel floor space embedded in a redevelopment project.
| Metric | Kumoidori 5-chome value | How to read it |
|---|---|---|
| Reserved floor sale proceeds ÷ total revenue | 56.6% | The higher this ratio, the stronger the need to sell floor space at a high price, and the more likely a high-value-added use is introduced |
| Public and civic floors ÷ gross floor area | 42.1% | The higher it is, the more the revenue floor space is squeezed, raising the recovery burden per square metre of what remains |
| Planned FAR ÷ designated FAR | approx. 1.46x | The size of the uplift governs the volume of reserved floor space; a project with a small multiple has thin reserved floor space |
| Back-calculated required ADR ÷ catchment median ADR | 3.4-4.1x | If the multiple runs well above 2x, the plan can be read as premised on creating a price band absent from the existing catchment |
The fourth multiple is the most practical of all. From an operator’s site-development perspective, it is a yardstick for the distance between the rate the redevelopment demands and the rate the operator’s own brand can achieve in that catchment. At a multiple of around 1.5x an existing format can be extended to fit; above 3x, both the brand and the product specification have to be imported from outside the catchment. This structure is why brands introduced into large station-front mixed-use developments tend to be pitched higher than the local market.
The risk factors are also worth setting out.
| Factor | Description | Position at Kumoidori 5-chome |
|---|---|---|
| Construction cost | Rising materials and labour costs push up construction costs, increasing the required reserved floor sale proceeds | The project plan received its second revised approval in January 2025. The ¥62,565m construction cost is the planned figure as of that approval |
| Buyers for the floor space | The project stalls if buyers for the reserved floor space cannot be secured | Mitsubishi Estate, Mitsubishi Logistics and TC Shinko Real Estate are already on board as designated project participants. The City of Kobe is the developer of the civic facilities |
| Durability of demand | The risk that lodging demand at opening falls short of the assumptions | Estimated occupancy in Hyogo Prefecture was high as of July 2026 at 89.3% for city hotels and 90.9% for business hotels |
| Achieving the rate | The difficulty of launching a price band that does not exist nearby | There is no inventory in the ¥20,000s estimated ADR range within 1.2km, so comparables themselves are scarce within the catchment |
On the project timeline: the implementing entity was established in June 2018, the city planning decision was announced in March 2020, implementation was approved in March 2021 (revised approval March 2022), the rights conversion plan was approved in May 2022, and demolition began in June of that year, bringing the project to where it stands now. The project plan sets the implementation period through the end of December 2028, while the press release puts completion at around fiscal 2027. Viewed through the distance band over which proximity to a station affects price, a position roughly 250m from JR Sannomiya Station ranks among the very best conditions.
Conclusion
A hotel occupying the upper floors of a redevelopment tower is not an aesthetic choice. It is the result of working backwards to the mix of uses that maximises recovery, given that ¥52.2bn of the ¥92.2bn total project cost has to be recovered by selling floor space. Policy fixes the uses of the lower floors, floorplate economics select offices for the middle, and at the top a hotel — able to convert a view premium into rate — delivers the highest marginal value.
The lodging floor space in this project carries ¥7.34bn on a pro-rata basis, or approximately ¥113m per room. The required ADR is approximately ¥44,000, 3.7x the median of the 40 nearby properties. Because it cannot work at prevailing local rates, the answer is to build product the area does not have. The conclusion of “luxury on the upper floors” follows mechanically from the size of the reserved floor sale proceeds.
Anyone assessing a redevelopment project should start by opening the funding plan in the project documents and checking the share of reserved floor sale proceeds and the share of public floor space. Those two figures alone predict, with considerable accuracy, how high a rate the project will demand of its lodging product.
⚠ Note on ADR for future dates: Estimated settled ADR for Chuo-ku, Kobe from August 2026 onward is an estimate based on rates published on OTAs as of the survey date, and will fluctuate as the check-in date approaches. Current levels will not necessarily be realised as they stand. The back-calculation in this article is also a simplified estimate based on published figures and general investment assumptions; it does not represent the developer’s plan or actual financial results.
Related reading
- Hotel Development Capacity 2026: Zoning, FAR & Land Price in 5 Markets
- Kaihin-Makuhari 1,000-Room ¥30bn Mixed-Use: Breakeven ADR ¥13,200
- Own a Hotel from ¥100,000 — Security Tokens Open a Third Funding Route
- Station Premium Ends at an 8-Minute Walk: 8 Stations, 1,012 Hotels
- Hotel Category Mix Explains Half of City ADR: 34 Municipalities
- Hyogo’s Hotel Market in 5 Layers 2026: ADR from ¥10,700 to ¥29,600
- Hotel Build Times: 2.80-Year Median, 1.96 Solo vs 4.00 Mixed-Use
- Hotel vs Condo Land Rivalry: ADR-Implied Feasible Land Price Map
References and sources
■ Data sources
Project costs, gross floor area by use and FAR are the figures stated in the project plan published by Kumoidori 5-chome Redevelopment Co., Ltd. with the approval of the City of Kobe (2nd revised approval, 22 January 2025). Subsidy cost-sharing ratios come from Hyogo Prefecture’s investment project evaluation report. Room counts, room sizes and project participants come from the joint press release by the project parties dated 3 June 2022. Published land prices, zoning and station passenger counts come from the MLIT Real Estate Information Library. Establishment and worker counts are from the Economic Census for Business Activity (2021), aggregated to a 1km radius across 141 small areas from the 2020 Population Census. Estimated settled ADR and estimated occupancy are compiled by MetroEngines Research & Consulting (within 1.2km of Sannomiya, N=40 properties / Chuo-ku, Kobe, 63-67 properties per month / Hyogo Prefecture, July 2026).
■ Calculation assumptions
The required ADR was back-calculated by allocating the ¥52,181m in reserved floor sale proceeds pro rata by gross floor area (lodging floor space 13,940㎡ ÷ 99,130㎡ = 14.1%, allocated amount approximately ¥7.34bn), then applying a capitalisation rate (NOI cap rate) of 4.5-5.5%, a GOP margin of 30%, 65 rooms (the midpoint of the planned 60-70), estimated occupancy of 65-80% and a room-revenue share of total revenue of 50-70%, and working through required NOI → required total revenue → required room revenue → division by rooms sold per year. Rooms sold per year is 65 rooms x 365 days x occupancy. All amounts are tax-exclusive equivalents.
■ Limitations and caveats
(1) The allocation of reserved floor sale proceeds is a simple pro rata by gross floor area and does not reflect the customary practice of disposing of upper floors at higher unit prices, nor the fact that civic facilities and bus terminal facilities are handled on public-sector acquisition terms. Because the actual burden on the lodging floor space is biased toward being larger than in this calculation, the required ADR range is a lower-bound guide. (2) ADR is an estimated settled rate derived by applying category-specific adjustments to published OTA rates, and differs from each property’s actual transacted rates and accounting figures (median error of approximately 7% when cross-checked against property-level disclosures by listed hotel REITs). (3) Estimated occupancy is an estimate based on the absorption of OTA sales inventory and differs from a property’s actual overall occupancy. (4) ADR from August 2026 onward is a forward value based on rates listed as of the survey date and fluctuates as the check-in date approaches. (5) This article is a simplified calculation based on published documents and does not represent the developer’s plan, actual financial results or any investment recommendation.
■ Primary project documents
- City of Kobe, “Type 1 Urban Redevelopment Project in the Kobe Sannomiya Kumoidori 5-chome District” (project plan approval documents, revised approval 22 January 2025)
- Kumoidori 5-chome Redevelopment Co., Ltd., “Kobe Sannomiya Kumoidori 5-chome District Type 1 Urban Redevelopment Project — Project Plan” (PDF)
- Hyogo Prefecture, Urban Development Division, “Investment Project Evaluation Report (new) — Kobe Sannomiya Kumoidori 5-chome District Urban Redevelopment Project” (PDF)
- Kumoidori 5-chome Redevelopment Co., Ltd., City of Kobe, Mitsubishi Estate, Mitsubishi Logistics, TC Shinko Real Estate and Obayashi Corporation, “Notice of Approval of the Rights Conversion Plan for the Kobe Sannomiya Kumoidori 5-chome District Type 1 Urban Redevelopment Project” (3 June 2022, PDF)
- City of Kobe, “Urban Redevelopment Projects”
■ Government statistics and public data
- MLIT Real Estate Information Library — published land prices (survey points Kobe-Chuo 5-2 and 5-3, 2019-2026), zoning, station passenger counts
- MLIT, “Statistics on Building Construction Starts” — benchmark hotel construction cost per tsubo
- Ministry of Internal Affairs and Communications / Ministry of Economy, Trade and Industry, “Economic Census for Business Activity (2021)” and 2020 Population Census small areas (e-Stat Statistical GIS) — establishments and workers within a 1km radius
■ Market data
- MetroEngines Research & Consulting — estimated settled ADR (within 1.2km of Sannomiya, N=40 properties / Chuo-ku, Kobe, 63-67 properties per month), estimated occupancy (Hyogo Prefecture, July 2026), property master