

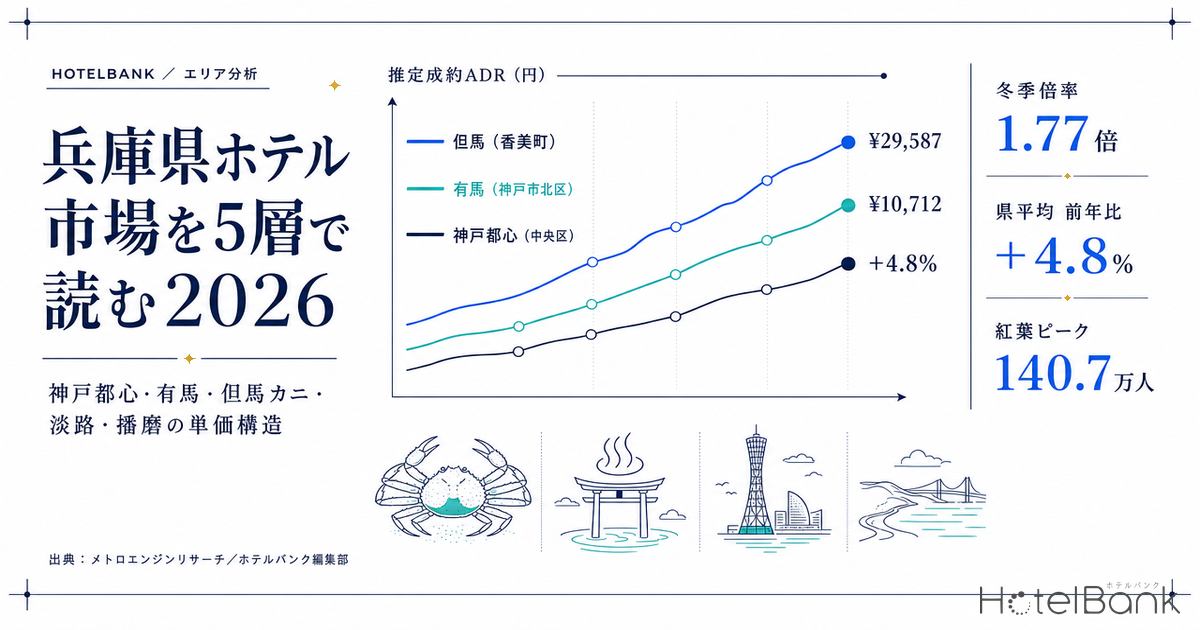
Hyogo Prefecture packs several completely different lodging markets into one prefecture: downtown business demand in a government-designated city, a high-ADR hot-spring resort within commuting distance of that city, crab-season ryokan on the Sea of Japan coast, an island resort market, and the business/event belt spanning Harima and the Hanshin corridor. Look only at the prefecture-level average and these internal differences disappear entirely. This article breaks Hyogo into five layers using municipality-level data from MetroEngines Research, and reads the autumn-winter ADR structure, booking pace, and remaining rate headroom quantitatively.
Metric Definitions Used in This Article
- ADR (average daily rate) = an estimated settled rate (tax-exclusive equivalent) calculated by applying a category-specific adjustment coefficient to the lowest published plan level each property lists on OTAs and similar channels (2 guests per room, per-room rate, tax included). Cross-checked against property-level results disclosed by listed hotel REITs (91 properties, most recent 3 months), the median error is approximately 7%. These are estimates and differ from each property’s actual transacted prices and accounting figures. Area-level ADR is the median of the properties covered (the level of a typical property in that area).
- OCC (occupancy rate) = the share of sold rooms against total rooms in the area (an estimate based on OTA sales inventory; consistency checks against monthly REIT disclosures confirm accuracy of roughly a few percentage points). It is an estimate based on how listed OTA inventory is consumed, and differs from a property’s true overall occupancy.
- LT (lead time) = days remaining until the check-in date. LT0 = same day.
- References to listed price are per-room rates for 2 guests per room (tax included).
- Data source: MetroEngines Research
- — The prefecture average does not work — estimated settled ADR for November 2026 is ¥29,600 in Kobe’s Kita Ward (Arima) versus ¥10,700 in Himeji. That is roughly a 2.8x spread inside a single prefecture.
- — +4.8% is the fastest in the Kinki region — estimated settled ADR averaged ¥13,200 for January–June 2026 (+4.8% year on year), ahead of Wakayama at +4.5%, Shiga at +4.1%, and Kyoto at +1.5%.
- — Tajima’s winter multiple is 1.5–1.8x — Shin’onsen Town 1.77x, Kami Town 1.68x, Toyooka 1.56x. The November 6, 2026 opening of snow crab season is the starting point of the rate curve.
- — Only downtown Kobe has a winter trough — a winter multiple of 0.90x. The 32nd Kobe Luminarie (January 29 – February 7, 2027) places the year’s largest demand event squarely in the rate trough.
- — The upper-midscale band is empty — in Kobe’s Chuo Ward, 37 of the 46 properties analyzed (80%) sit below ¥20,000 and none exceed ¥60,000. Himeji likewise has zero properties at ¥35,000 or above.
The prefecture is up 4.8% year on year — but “the Hyogo average” explains very little
Start with the overall picture. Estimated settled ADR across Hyogo averaged ¥13,200 for January–June 2026, up 4.8% from ¥12,600 in the same period a year earlier (monthly N=536–579 properties; N=1,034–1,192 properties on a listed-property basis). By month, there was clear strength from the start of the year into early spring — January +10.0%, February +7.0%, March +13.9% — while early summer settled back to roughly flat: April +1.2%, May +1.1%, June −5.6%. Rates are not rising in a straight line; the structure is one in which upside concentrates in the months where demand events cluster.
The macro backdrop remains a tailwind. On aggregations based on the Japan Tourism Agency’s Overnight Travel Statistics Survey, foreign overnight guests in Hyogo rose 29% year on year in 2025, far outpacing the national average of +8.2%. According to the Kobe Tourism Bureau, total overnight guests in Kobe reached a record 7.757 million in 2025, of which foreign overnight guests accounted for 1.407 million. Capturing East Asian demand on the back of Kobe Airport’s internationalization is lifting the prefecture-wide figures.
It is also worth checking where this +4.8% sits relative to neighboring prefectures. The table below lines up estimated settled ADR on an identical definition for the five Kinki prefectures plus Okayama, averaged over January–June 2026. Hyogo’s growth rate is the highest among the comparison set.
| Prefecture | Jan–Jun 2025 average ADR |
Jan–Jun 2026 average ADR |
YoY | Properties covered (monthly N, 2026) |
|---|---|---|---|---|
| Hyogo | ¥12,630 | ¥13,230 | +4.8% | 536–565 |
| Wakayama | ¥8,885 | ¥9,288 | +4.5% | 221–227 |
| Shiga | ¥7,559 | ¥7,865 | +4.1% | 160–163 |
| Nara | ¥12,438 | ¥12,834 | +3.2% | 131–135 |
| Kyoto | ¥15,832 | ¥16,066 | +1.5% | 580–607 |
| Okayama | ¥8,058 | ¥8,162 | +1.3% | 187–192 |
| Osaka | ¥11,300 | ¥9,370 | −17.1% | 640–650 |
Source: MetroEngines Research; compiled by the HotelBank Editorial Team (estimated settled ADR on a finalized-figures basis; monthly property counts cover the January–June 2026 range)
Hyogo’s +4.8% outpaces Wakayama (+4.5%) and Shiga (+4.1%), and is more than triple Kyoto’s +1.5%. Osaka’s −17.1% appears to be payback from large-scale event demand in 2025, and is better read as a single-year factor than as the underlying tone of the Kansai region. Within Kinki, Hyogo does not match Kyoto on rate level, but it is clearly ahead on growth.
Source: MetroEngines Research; compiled by the HotelBank Editorial Team (figures from July 2026 onward are estimates based on listed levels at the time of the survey)
Overlaying the monthly curves year by year, Hyogo’s estimated settled ADR has two peaks: August, and November–December. The summer leisure peak, and the winter food season. The property count for November 2025 was temporarily thin (N=34 properties), falling below 60% of the series median, so it is hidden in the chart above — but the surrounding months make clear that November sits on the peak side rather than in a trough.
Breaking Hyogo into five layers — a rate range that spans nearly 3x
Lining up estimated settled ADR for November 2026 by municipality makes the internal dispersion immediately visible. Kobe’s Kita Ward (which includes Arima Onsen) is at ¥29,600, against ¥10,700 in Himeji — roughly a 2.8x gap within the same prefecture. That difference is not a matter of “expensive versus cheap”; it means the very nature of demand is different. The five layers below organize it.
| Layer | Representative area | Nov 2026 estimated settled ADR | Jul 2026 estimated settled ADR |
Main demand sources |
|---|---|---|---|---|
| 1. Urban business and inbound | Kobe, Chuo Ward | ¥15,322 | ¥13,088 | Business, academic conferences, inbound |
| 2. High-ADR hot springs near the city | Kobe, Kita Ward (Arima) | ¥29,587 | ¥21,507 | Short-haul leisure, autumn foliage |
| 3. Tajima hot-spring ryokan | Toyooka, Kami Town, Shin’onsen Town | ¥18,453–29,390 | ¥12,306–18,667 | Crab season, onsen cure stays |
| 4. Awaji Island resorts | Sumoto, Minamiawaji, Awaji City | ¥17,704–22,451 | ¥16,268–21,988 | Family travel, experience-led stays |
| 5. Harima and Hanshin business / events | Himeji, Nishinomiya, Amagasaki | ¥10,026–12,874 | ¥8,818–10,418 | Business trips, sightseeing, events |
Source: MetroEngines Research; compiled by the HotelBank Editorial Team (estimated settled ADR; November 2026 is an estimate based on listed levels at the time of the survey)
Source: MetroEngines Research; compiled by the HotelBank Editorial Team (November 2025 is hidden because the property count is thin)
Overlaying the trends makes it clear that the seasonal structures of the five layers are entirely different animals. Kami Town and Toyooka bottom out in summer and climb steeply from November. Arima (Kita Ward) holds a high level all year and steps up another notch in winter. Kobe’s Chuo Ward and Himeji are close to flat, with small seasonal swings. Even among “hotels in Hyogo,” the calendar that matters for revenue management is fundamentally different.
Tajima — winter rates run 1.5–1.8x normal season, with November 6 as the starting gun
The widest swing in Hyogo’s seasonal structure is in the Tajima area on the Sea of Japan coast. Snow crab fishing opens on November 6, 2026, and the season runs through March 20, 2027. According to Toyooka City’s official tourism site, catches landed at Tsuiyama Port may be sold under the “Tsuiyama crab” name, and the season is signaled by the departure ceremony at noon on November 5 and the first auction on November 7. Shibayama and Kasumi work to the same opening date.
We tested whether this “November 6” genuinely functions as the starting point of the rate curve. Using monthly figures on a finalized basis (September 2025 – June 2026), the table below shows the winter (December–March) average divided by the normal-season (September, October, April, May, June) average.
| Area | Winter (Dec–Mar) average ADR |
Normal season average ADR | Winter multiple | Properties covered (median) |
|---|---|---|---|---|
| Shin’onsen Town (Yumura Onsen, Hamasaka) | ¥24,614 | ¥13,891 | 1.77x | 21 |
| Kami Town (Kasumi, Shibayama, Muraoka) | ¥39,212 | ¥23,351 | 1.68x | 45 |
| Toyooka (Kinosaki, Takeno, Tsuiyama) | ¥30,381 | ¥19,467 | 1.56x | 98 |
| Sumoto (Awaji Island) | ¥23,074 | ¥19,296 | 1.20x | 19 |
| Kobe, Kita Ward (Arima) | ¥35,581 | ¥30,078 | 1.18x | 41 |
| Himeji | ¥7,086 | ¥6,972 | 1.02x | 40 |
| Kobe, Chuo Ward | ¥10,894 | ¥12,097 | 0.90x | 63 |
Source: MetroEngines Research; compiled by the HotelBank Editorial Team (finalized-figures basis. Winter = December 2025 – March 2026; normal season = September and October 2025 / April, May and June 2026)
How much this winter multiple matters to revenue is easiest to grasp on two axes: ADR and occupancy. The table below is a RevPAR (revenue per available room) grid built around Toyooka’s finalized winter average ADR of ¥30,381, flexing ADR by ±20% and room occupancy across a 70–94% range.
| OCC \ ADR | ¥24,300 −20% | ¥27,300 −10% | ¥30,381 base | ¥33,400 +10% | ¥36,500 +20% |
|---|---|---|---|---|---|
| 70% | ¥17,010 | ¥19,110 | ¥21,267 | ¥23,380 | ¥25,550 |
| 76% | ¥18,468 | ¥20,748 | ¥23,090 | ¥25,384 | ¥27,740 |
| 82% | ¥19,926 | ¥22,386 | ¥24,912 | ¥27,388 | ¥29,930 |
| 88% | ¥21,384 | ¥24,024 | ¥26,735 | ¥29,392 | ¥32,120 |
| 94% | ¥22,842 | ¥25,662 | ¥28,558 | ¥31,396 | ¥34,310 |
Source: compiled by the HotelBank Editorial Team (the ADR base value is Toyooka’s winter average ADR on a MetroEngines Research finalized-figures basis)
This table is ADR x OCC arithmetic and does not forecast future occupancy or rates. The center cell (¥24,912) combines the base ADR with ryokan-category OCC of 82.4% (as of July 2026, Hyogo; N=710 properties / 32,678 rooms). What it shows is the relationship: adding 6 points of room occupancy (82% to 88%) moves RevPAR about 7%, while adding 10% to ADR moves it 10%. In designing crab-season pricing, it works as a break-even guide for the “hold rate and lose occupancy” decision — raise ADR by 10% and, if occupancy falls more than 6 points, the net result is negative.
Shin’onsen Town’s 1.77x and Kami Town’s 1.68x go beyond what a simple peak-season premium would explain. Because the added ingredient cost (crab) feeds directly into plan rates through the menu, the seasonal price elasticity of room rates is structurally high. Read the other way, the normal-season ¥13,000–23,000 band still holds headroom for how far rates can be built on value other than the ingredient itself. In recent years Tajima properties have been developing year-round activities and designing plans around local sake and Tajima beef, and there is considerable room to invest in a direction that actually lowers the winter multiple — that is, lifts the normal season.
One practical point to keep in mind is how long crab-season lead times are. Bookings for weekends after the November 6 opening typically start moving very early. Looking at the properties covered for November 2026, Toyooka shows 73 properties analyzed against 106 listed, and Kami Town 32 against 58 — a narrower base than in October. This reflects the process by which sales allocations fill from autumn onward and listings on OTAs and similar channels decline. Pricing for the opening week should be locked in by the end of September at the latest. Winter crab demand also begins to surface in summer-season data — in both review mention rates and ADR — well before the season opens.
Arima — the rare position of a high-ADR hot spring 30 minutes from the city
Estimated settled ADR in Kobe’s Kita Ward (which includes Arima Onsen) is ¥30,100 even in the normal season, and ¥35,600 in winter. That means it sustains a level comparable to Tajima’s winter peak all year round. The winter multiple stopping at 1.18x is evidence that rates are not season-dependent, and in terms of earnings stability this is the strongest position in the prefecture.
The source of that strength is location. There are not many places nationwide where a hot-spring destination with room rates above ¥30,000 works at a distance of roughly 30 minutes by train from Sannomiya and within an hour of Osaka. Securing overnight demand at a distance that easily leaks to day trips is the result of properties clearly designing the value of the stay — the Kinsen and Ginsen springs, kaiseki dining, and walking the town.
November’s autumn foliage season is the largest weekend demand of the year for this layer. Estimated settled ADR is ¥29,600 for November 2026 and ¥32,400 for December, so even on listed levels at the time of the survey an upward trend from autumn into winter is visible. Foliage weekends (Saturdays in mid-to-late November) are one of the few moments when short-haul leisure and inbound demand overlap, and how far the weekday-to-weekend price gap can be designed is where the rate headroom lies.
Downtown Kobe — the only layer with a winter trough, and headroom in event design
Kobe’s Chuo Ward is the only one of the prefecture’s five layers with a winter multiple below 1 (0.90x). The December–March average is ¥10,900 against ¥12,100 in the normal season. In a downtown market centered on business demand, the year-end/New Year and fiscal year-end troughs pull rates down.
There is a clear opportunity here. According to the Kobe Tourism Bureau, the 32nd Kobe Luminarie will run for 10 days from Friday, January 29 to Sunday, February 7, 2027, at Meriken Park, Higashi Yuenchi Park, and the former foreign settlement district. With the event moving from its traditional December slot to late January and early February, downtown Kobe’s largest annual demand event now sits in the middle of the rate trough. Estimated settled ADR in January and February is ¥10,100–10,500, the lowest level of the year, leaving substantial room to align pricing with a 10-day event that draws crowds.
Kobe also has real depth as a host city for academic and international conferences. Because demand during conference sessions spills into weekdays, it is one of the few elements capable of creating a peak in a downtown rate curve that otherwise tends to stay flat. Pricing designed off the conference calendar is a realistic upside for downtown hotels: conference weeks in Kobe generate a measurable session premium that follows much the same pattern seen in Kyoto.
Supply and demand by category — urban formats tighten first, ryokan catch up later
Next, supply-demand balance by category. OCC in Hyogo for July 2026 (occupancy rate, an estimate based on OTA sales inventory) was 90.7% for business hotels, 89.0% for city hotels, 83.0% for resort hotels, 82.4% for ryokan, and 88.4% across all properties (all as of July 2026, 710 properties analyzed / 32,678 rooms). In summer, urban formats run high while ryokan and resorts retain some slack.
Source: MetroEngines Research; compiled by the HotelBank Editorial Team (July 2026, Hyogo; N=710 properties / 32,678 rooms)
That ordering, however, is likely to invert once crab season begins. As the winter multiples above show, Tajima ryokan sell from December to March while lifting rates more than 1.5x, because demand density itself changes. Reading “ryokan have looser supply-demand than urban formats” off the summer cross-section alone is not appropriate.
Booking pace also differs by category. The chart below tracks occupancy by lead time for check-ins on Saturday, September 19, 2026 — the first day of the autumn three-day weekend.
Source: MetroEngines Research; compiled by the HotelBank Editorial Team (check-in September 19, 2026; city 45 properties, business 137, ryokan 214, resort 44)
Over the 36 days from LT90 (as of June 21) to LT54 (as of July 27), city hotels moved from 82.0% to 85.2%, business hotels from 74.2% to 77.6%, and ryokan from 64.8% to 70.1%. Ryokan start from the lowest point, but their gain over the period (+5.3 points) is the largest. Resort hotels were essentially flat at 71.2% to 71.6%, leaving room to capture demand later for this particular date. The difference in booking behavior by category is clear: urban formats reach a high level early, while stay-led ryokan and resorts move from the middle of the curve onward.
Note that these are bookings still in progress at the time of the survey — a snapshot taken more than 50 days before the check-in date. This is not the stage at which a definitive judgment such as “sold out early” can be made; please read it purely as a comparison of pace.
Supply — a handful of large projects a year, with rebranding taking the lead
Aggregating new openings in Hyogo by year, property counts have trended down from a peak of 97 in 2023, while room counts have moved between 1,134 rooms in 2022 and 846 rooms in 2025. The notable feature in recent years is that large projects have narrowed to three or four a year, with the remainder made up in number by small-scale facilities such as rental villas, guesthouses, and glamping.
Source: MetroEngines Research & Consulting (based on confirmed OTA listings) / compiled by the HotelBank Editorial Team. Note: 2026 is based on listings confirmed at the time of the survey; because listings appear several months before opening, the count is expected to rise.
| Opening | Property | Rooms | Category |
|---|---|---|---|
| April 2025 | Toyoko Inn Kobe Sannomiya Ekimae (東横INN神戸三宮駅前) | 224 | Business hotel |
| September 2025 | Tabino Hotel Kakogawa (たびのホテル加古川) | 172 | Business hotel |
| December 2025 | Kobe Marriott Hotel (神戸マリオットホテル) | 186 | Resort hotel (rebrand) |
| February 2026 | THE ORIENT | 116 | City hotel |
| July 2026 | Hotel Route-Inn Tamba-Hikami Inter (ホテルルートイン丹波-氷上インター-) | 188 | Business hotel |
Source: MetroEngines Research & Consulting (based on confirmed OTA listings); compiled by the HotelBank Editorial Team
The Kobe Marriott Hotel (186 rooms), which opened in December 2025, is a full rebrand of an existing hotel directly connected to JR Kobe Station. What matters is that this is not net new supply: an upper-tier brand entered by lifting the value of existing stock. With construction costs staying high, the shift toward rebranding and conversion — rather than new build — as the main driver of supply is clearly visible in Hyogo as well.
On the forward pipeline, a redevelopment in Kumoidori 5-chome, Chuo Ward, Kobe is planned: a 32-storey complex including a 70-room hotel, a bus terminal, and a library, scheduled for completion in December 2027. Note, however, that building-plan data is on a building-confirmation-application basis; further applications are expected to increase both project and room counts. Please treat it as a lower bound for the confirmed pipeline at this point in time.
Rate-band map — large headroom in downtown Kobe’s upper-midscale band
Finally, we built an area x rate-band matrix, classifying property-level estimated settled ADR as of November 2026 into five rate bands and comparing the depth of each area.
Source: MetroEngines Research; compiled by the HotelBank Editorial Team (November 2026, property-level estimated settled ADR. Coverage is limited to properties with a verified category.)
| Area | Under ¥10k | ¥10k–20k | ¥20k–35k | ¥35k–60k | ¥60k+ | N | Median |
|---|---|---|---|---|---|---|---|
| Kobe, Chuo Ward | 6 | 31 | 5 | 4 | 0 | 46 | ¥15,444 |
| Kobe, Kita Ward (Arima) | 1 | 5 | 10 | 12 | 5 | 33 | ¥37,117 |
| Toyooka | 8 | 14 | 24 | 19 | 3 | 68 | ¥27,706 |
| Kami Town | 7 | 3 | 11 | 9 | 0 | 30 | ¥29,126 |
| Awaji Island (Sumoto, Minamiawaji) | 1 | 11 | 8 | 4 | 0 | 24 | ¥20,358 |
| Himeji | 12 | 12 | 4 | 0 | 0 | 28 | ¥10,548 |
Source: MetroEngines Research; compiled by the HotelBank Editorial Team (as of November 2026, property-level estimated settled ADR)
The clearest white space is in Kobe’s Chuo Ward. Of the 46 properties analyzed, 37 (80%) cluster below ¥20,000; only 4 (8.7%) are at ¥35,000 or above, and none exceed ¥60,000. Meanwhile, in Kita Ward within the same city, 17 of 33 properties (52%) sit at ¥35,000 or above. Downtown Kobe has a thick stack of volume-zone lodging demand, but limited choice in the upper-midscale to luxury band.
Given that Kobe’s foreign overnight guests hit a record 1.407 million and that Kobe Airport’s internationalization is set to progress further, the thinness of this rate band is clear headroom from a development and investment standpoint. The upper-tier brand entry in December 2025 can be positioned as the first answer to that gap. Rebranding and converting existing stock is a way to place a product in the ¥35,000-plus band in a shorter time frame than new construction.
Himeji has the same structure. Of 28 properties, 24 (86%) are below ¥20,000 and none are at ¥35,000 or above. This is the flip side of a high day-trip ratio as a sightseeing destination home to a World Heritage site, and there is considerable room to lift the rate band if products that design a “reason to stay overnight” enter the market. On Awaji Island, 11 properties gather in the ¥10,000–20,000 band while only 4 sit at ¥35,000 or above — a stage at which the upper band can still be given more depth.
Practical notes for autumn and winter
Tajima (Toyooka, Kami, Shin’onsen): from the November 6 opening, rates move to 1.5–1.8x the normal season. It is reasonable to lock in pricing for the opening week and December weekends by the end of September, and to design weekday inventory to be absorbed during November while the buzz right after the opening is at its strongest. Lifting the normal season (April–June, September–October) hinges on how much value beyond crab can be built into the stay.
Arima: estimated settled ADR trends up from ¥29,600 in November to ¥32,400 in December. Saturdays during the foliage season are when short-haul leisure and inbound demand overlap, leaving significant room to design the weekday-to-weekend price gap. The stability implied by a 1.18x winter multiple is also strength as a year-round earnings base.
Downtown Kobe: January and February are the annual rate trough. The Luminarie period from January 29 to February 7, 2027 is a 10-day demand opportunity sitting inside that trough. Pricing aligned to the event period, plus proposals to extend stays into the days before and after, are realistic ways to create a peak in the downtown rate curve.
Awaji Island and Harima: with small seasonal swings, day-of-week and event-based design works well here. Awaji Island shows a clear gap between its August peak (Sumoto ¥32,300) and winter, leaving room in autumn and winter to develop weekday demand around experience-led content. How event demand in the Hanshin corridor actually swings can be read from remaining-inventory data in Nishinomiya and Amagasaki, where summer tournament weeks around Koshien produce the sharpest movement.
⚠ A note on ADR for future dates: estimated settled ADR for August 2026 onward in this article is an estimate based on selling prices published on OTAs and similar channels at the time of the survey, and will fluctuate as the check-in date approaches. In hot-spring destinations in particular, the mix of remaining products changes during autumn and winter as early-discount plans are consumed, so levels will move relative to finalized figures. For year-on-year comparison, it is more accurate to focus on January–June 2026, where finalized figures can be compared against finalized figures.
Conclusion
Hyogo is one of the markets where a prefecture-level average works least well. Estimated settled ADR in the first half of 2026 was solid at +4.8% year on year, but that figure is a composite of four entirely different seasonal calendars: Arima, which holds a high rate all year; Tajima, which jumps 1.5–1.8x in winter; downtown Kobe and Harima, which are almost season-agnostic; and Awaji Island, which peaks in summer.
Heading into autumn and winter, the November 6 opening is the starting gun for Tajima, and November’s foliage weekends create Arima’s peak. In downtown Kobe, the year’s largest demand event has been placed in the rate trough of late January to early February. The answer to “when do you set your price” is different in each layer. On rate bands, the thinness of the upper-midscale segment in downtown Kobe and Himeji stands out as the headroom that remains — in both supply and product design.
Related Reading
References and Sources
■ Data sources
MetroEngines Research aggregations by municipality and by category (Hyogo, July 2024 – December 2026). Estimated settled ADR covers a monthly N=536–579 properties (N=1,034–1,192 properties on a listed-property basis). Occupancy is for July 2026 in Hyogo, covering 710 properties analyzed / 32,678 rooms. Booking pace is for check-ins on September 19, 2026 (city 45, business 137, ryokan 214, resort 44 properties). Prefecture-to-prefecture comparison uses estimated settled ADR on an identical definition, averaged over January–June 2026.
■ Calculation assumptions
Winter multiple = average winter ADR on a finalized-figures basis (December 2025 – March 2026) divided by average normal-season ADR (September and October 2025 / April, May and June 2026). Area ADR is the median of the properties covered (the level of a typical property in that area). The RevPAR sensitivity grid in Table 4 is ADR x OCC arithmetic and is not a forecast of future occupancy or rates. The rate-band matrix classifies property-level estimated settled ADR into five bands, with coverage limited to properties with a verified category.
■ Limitations and caveats
Estimated settled ADR from August 2026 onward is based on selling prices listed on OTAs and similar channels at the time of the survey, and will diverge from finalized figures as the check-in date approaches. Year-on-year comparisons are most accurate when focused on January–June 2026, where finalized figures can be compared with finalized figures. November 2025 was excluded from the charts because the property count was thin (N=34 properties). Note that Nishinomiya and Amagasaki have small monthly property counts of around 10, so the Harima/Hanshin range in the five-layer table is subject to wide swings. Occupancy is an estimate based on how OTA sales inventory is consumed, and differs from a property’s true overall occupancy.
■ Market data
- MetroEngines Research — estimated settled ADR by municipality (July 2024 – December 2026), occupancy by category (estimated on an OTA sales-inventory basis), booking pace by lead time
- MetroEngines Research & Consulting (based on confirmed OTA listings) — newly opened properties in Hyogo (2022–2026)
- Compiled by MetroEngines Research & Consulting from the Ministry of Land, Infrastructure, Transport and Tourism “Statistics on Building Construction Starts” — planned hotels in Hyogo
■ Government statistics and public data
- Japan Tourism Agency, “Overnight Travel Statistics Survey”
- Japan Tourism Agency, “Overnight Travel Statistics Survey” annual data for January–December 2025 (PDF)
■ Local government and tourism organizations
- Kobe Tourism Bureau, “Kobe records its highest-ever overnight guest total for 2025” (March 31, 2026)
- Kobe Tourism Bureau, “The 32nd Kobe Luminarie confirmed for January 29 (Fri) – February 7 (Sun), 2027”
- Toyooka City official tourism site, “King of winter flavors: Matsuba crab season” (opening date, departure ceremony, first auction)
■ News and press releases