

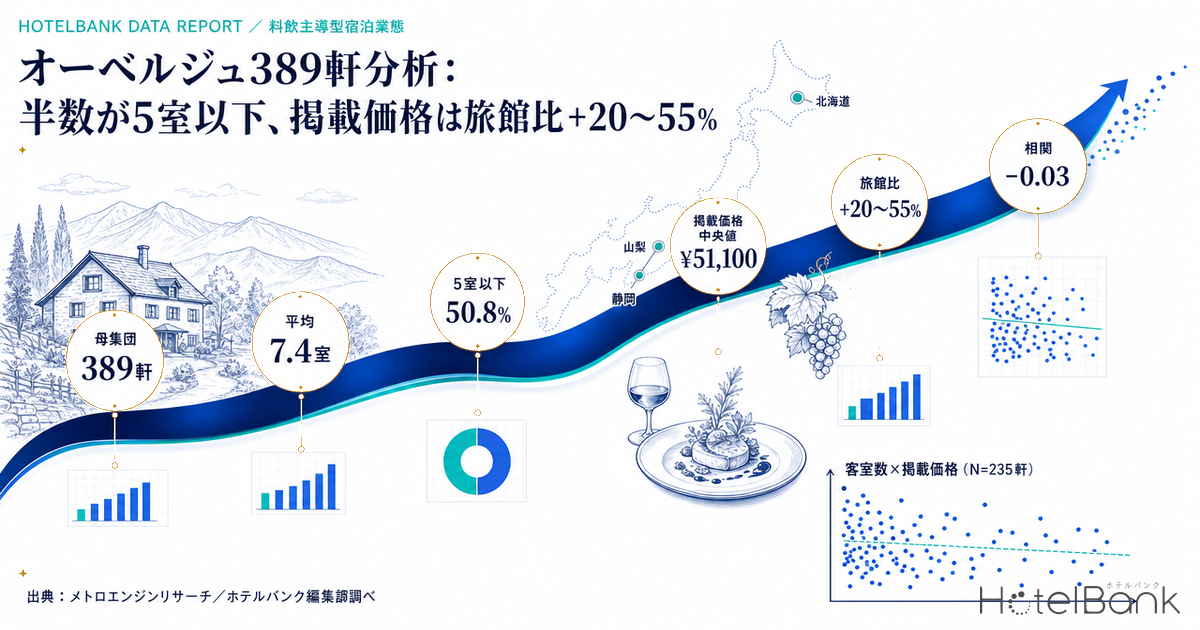
There are 389 properties in Japan classified as “auberge” on OTA platforms. They average 7.4 rooms — roughly the same footprint as a pension or minshuku — yet their median listed price of about ¥51,100 runs 20-55% above ryokan in the same prefecture. The correlation between room count and price is essentially zero (-0.03): what explains the rate is not the size of the box. This article cross-references OTA classification data, listed prices, and 96,306 guest reviews within the scope of MetroEngines Research coverage to take stock of where this food-and-beverage-led lodging format now sits, at what scale, and at what price.
Metric Definitions Used in This Article
- Listed price: the average of publicly posted selling prices on OTAs and similar channels (per room for double occupancy, tax included, averaged across all plans, from room-only to meal-inclusive). It differs from the actual transacted price. Because auberges are not among the property types covered by our settled-ADR estimation, this article does not use ADR and discusses listed prices only. A property-level listed price is the period median of that property’s daily average price.
- Property-level aggregation window: 1 May 2026 to 17 August 2026 (check-in date basis, all dates already elapsed). Only properties confirmed as listed on 15 or more days within this window are included in the price aggregation.
- Review score: guest review ratings on a 5-point scale. Category scores are the simple average of property-level scores across properties with 10 or more ratings in that category.
- Data sources: MetroEngines Research; guest reviews compiled by the HotelBank Editorial Team
- — 389 properties in Japan are classified as auberge on OTAs. They hold 2,868 rooms in total and average 7.4 rooms, putting them in the same size tier as pensions (8.1 rooms) and minshuku (7.6 rooms).
- — 50.8% have 5 rooms or fewer. Properties with 10 or fewer rooms make up 80.8%, while those with 21 or more account for just 4.4%.
- — Median listed price of ¥51,100 (per room, double occupancy, tax included, N=235 properties). That is above ryokan in the same prefecture by +37.1% in Nagano, +20.4% in Shizuoka, +55.0% in Hokkaido and +23.7% in Yamanashi.
- — Room count and price correlate at -0.03. The 1-3 room band posts the highest median at ¥63,700, so the rate is decoupled from the size of the box.
- — Across 96,306 guest reviews, food scores +0.27 above small ryokan. Bath and onsen, by contrast, sit at ±0.00 and value-for-money at -0.01.
The Population Is 389 OTA-Classified Auberges — Not a Census
Let us define the population up front. This article covers the 389 domestic properties whose property-type field is set to “auberge” in the MetroEngines Research property master. Including delisted records and properties located overseas, the master holds 462 matching records; the analysis is limited to the 389 currently listed domestic properties.
This is not a census. Properties absent from OTAs are excluded, and conversely, properties that call themselves auberges but are filed under another type are missed. More importantly, classification and naming do not line up. Of the 389 properties, only 167 (42.9%) carry “auberge” or the Japanese equivalent in their name. The remaining 57.1% — names such as Restaurant & Hotel Traumerei, Rest House Mori no Shirabe, and Winery Stay Travigne — are food-and-beverage-led but have chosen a different label.
The drift runs the other way too. The same classification includes properties that present themselves as minshuku — Minshuku Ikkenyado Tirol, for instance, whose ¥6,600 listed price sits at the bottom of the distribution discussed below. Read the figures here, then, not as “the complete picture of the auberge format” but as “the shape of the 389 properties circulating as auberges under OTA classification.” That classification drift is itself evidence that the format’s outline has yet to settle.
Top Five Prefectures Hold 40% — Nagano 46, Shizuoka 37, Hokkaido 32
By prefecture the ranking runs Nagano 46, Shizuoka 37, Hokkaido 32, Yamanashi 20 and Chiba 19, with those top five alone accounting for 154 properties (39.6%). All are two to four hours by car from major population centres and sit within producing regions for local ingredients. Tokyo, by contrast, has just two and Osaka two: the format is almost absent from city centres.
Source: compiled by the HotelBank Editorial Team from MetroEngines Research (N=389 properties)
What stands out is that property count and average room count do not move together. Nagano lines up 46 properties averaging 7.2 rooms and Shizuoka 37 averaging 6.8 — small boxes throughout — while Niigata’s 17 average 12.8 rooms and Gunma’s nine average 15.7, nearly double the scale under the same classification. Okinawa goes furthest in the other direction: 10 properties averaging 2.3 rooms, dominated by villa and whole-house formats.
Source: compiled by the HotelBank Editorial Team from MetroEngines Research. Shows the 235 properties for which listed prices could be aggregated (circle size = room count, colour = listed-price band)
Plotted on a map, the distribution stretches along hill-country and coastal areas linked to metropolitan regions by expressway and shinkansen. It maps almost exactly onto the outline of Japan’s second-home belts — Yatsugatake, Karuizawa, Izu, Boso and Niseko.
| Prefecture | Properties | Total rooms | Avg rooms | Median listed price | Price N |
|---|---|---|---|---|---|
| Nagano | 46 | 330 | 7.2 | ¥44,100 | 24 |
| Shizuoka | 37 | 251 | 6.8 | ¥53,900 | 19 |
| Hokkaido | 32 | 280 | 8.8 | ¥49,600 | 17 |
| Yamanashi | 20 | 121 | 6.0 | ¥34,700 | 15 |
| Chiba | 19 | 123 | 6.5 | ¥54,100 | 12 |
| Niigata | 17 | 217 | 12.8 | ¥33,900 | 5 |
| Kyoto | 16 | 116 | 7.2 | ¥61,400 | 12 |
| Oita | 12 | 90 | 7.5 | ¥42,800 | 7 |
| Hyogo | 11 | 111 | 10.1 | ¥80,100 | 9 |
| Tochigi | 11 | 94 | 8.5 | ¥66,200 | 6 |
| Okinawa | 10 | 23 | 2.3 | ¥27,200 | 5 |
| Gunma | 9 | 141 | 15.7 | ¥43,400 | 7 |
Source: compiled by the HotelBank Editorial Team from MetroEngines Research. Median listed prices cover only properties confirmed as listed on 15 or more days between 1 May and 17 August 2026 (prefectures with a price-aggregation N below 5 are omitted)
Half Have 5 Rooms or Fewer — Pension-Scale Buildings, Resort-Hotel Prices
Across the 386 properties with a registered room count, 128 (33.2%) have 1-3 rooms and 68 (17.6%) have 4-5, so 50.8% have five rooms or fewer. Adding the 6-10 band, 80.8% fall at or below 10 rooms. Only 17 properties (4.4%) have 21 or more. Total room stock is 2,868, averaging 7.4 rooms.
Source: compiled by the HotelBank Editorial Team from MetroEngines Research (386 properties with a registered room count)
That 7.4-room average is almost identical to minshuku at 7.6 and pensions at 8.1. It is 40% of the ryokan average of 18.6 rooms and one-tenth of the resort-hotel average of 71.5. In real-estate terms, then, auberges sit in the same tier as pensions and minshuku. This shift toward small buildings is running across the lodging sector as a whole, driven in part by the 2026 revision to Japan’s Hotel Business Act that permits single-room operation.
| Property type | Properties | Avg rooms | Share at 10 rooms or fewer |
|---|---|---|---|
| Auberge | 386 | 7.4 | 80.8% |
| Minshuku | 7,042 | 7.6 | 80.8% |
| Pension | 4,092 | 8.1 | 83.3% |
| Ryokan | 14,878 | 18.6 | 45.6% |
| Resort hotel | 2,225 | 71.5 | 17.1% |
Source: compiled by the HotelBank Editorial Team from MetroEngines Research (domestic properties with a registered room count)
Median Listed Price of ¥51,100 — 20-55% Above Ryokan in the Same Prefecture
On price the picture inverts. Taking the median of each property’s daily average listed price across the 235 properties confirmed as listed on 15 or more days between 1 May and 17 August 2026, the overall median comes to about ¥51,100 (per room, double occupancy, tax included, all plans). The first quartile is about ¥32,900, the third quartile about ¥88,200, and the top decile exceeds ¥144,400. Forty-nine properties (20.9%) sit in the ¥100,000-and-above band: the price range is extremely wide.
Source: compiled by the HotelBank Editorial Team from MetroEngines Research (N=235 properties, 1 May – 17 August 2026)
Set alongside other formats in the same regions, the meaning of that level becomes clear. Averaging monthly listed prices by property type over the trailing 12 months (August 2025 to July 2026) for the four prefectures with the most properties gives the following.
Source: compiled by the HotelBank Editorial Team from MetroEngines Research (trailing 12-month average. Monthly average property counts — Nagano: auberge 22 / ryokan 521 / pension 302 / resort 130; Shizuoka: 18 / 454 / 160 / 144; Hokkaido: 14 / 274 / 69 / 141; Yamanashi: 12 / 166 / 119 / 58)
Auberge listed prices run above ryokan by +37.1% in Nagano, +20.4% in Shizuoka, +55.0% in Hokkaido and +23.7% in Yamanashi. Against pensions the gap is +93.1% in Nagano and +103.2% in Hokkaido — roughly double. The relationship with resort hotels varies by prefecture: Nagano at -1.5% and Hokkaido at +3.8% are essentially level, Shizuoka runs above at +14.7%, and Yamanashi below at -22.2%. Room counts are pension-scale, yet prices compete on the same ground as resort hotels — no figure captures the outline of this format more directly.
Room Count and Price Correlate at -0.03 — Size Does Not Explain the Rate
So what separates the rates? Computing the correlation coefficient between room count and listed price across the 235 properties yields -0.025 — effectively no relationship. Medians by room-count band in fact run the other way: the smallest band, 1-3 rooms, is the highest at ¥63,700, well above the ¥45,900 of the 11-20 room band.
Source: compiled by the HotelBank Editorial Team from MetroEngines Research (N=235 properties. Vertical axis is a logarithmic scale)
| Room-count band | Properties | Median listed price |
|---|---|---|
| 1-3 rooms | 76 | ¥63,700 |
| 4-6 rooms | 55 | ¥46,000 |
| 7-10 rooms | 58 | ¥51,600 |
| 11-20 rooms | 35 | ¥45,900 |
| 21+ rooms | 11 | ¥51,700 |
Source: compiled by the HotelBank Editorial Team from MetroEngines Research (N=235 properties)
The top band is populated by properties that put the dining experience itself at the centre of the product: Auberge TOKITO in Tokyo with four rooms (about ¥390,600), MOKU ISESHIMA in Mie with one room (about ¥340,600), and LE CANA MOTOBU in Okinawa with one room (about ¥320,500). All have single-digit room counts, sustaining their rates somewhere entirely removed from economies of scale.
In conventional hotel development, room count is treated as the primary variable governing total investment and GOP. In this format its explanatory power has all but disappeared. The centre of gravity of the revenue structure has moved from rooms to food and beverage, which suggests that pricing per night is in practice subordinate to pricing per meal.
96,306 Guest Reviews — Food +0.27 vs Ryokan, but Bath and Value Are Level
That hypothesis is worth testing from the guest side as well. We placed category scores side by side for the 232 auberges with 30 or more accumulated reviews (96,306 in total) and, as a comparison group, 1,377 small ryokan of 1-15 rooms across the six prefectures of Nagano, Shizuoka, Hokkaido, Yamanashi, Chiba and Niigata (575,991 reviews in total) — a comparison matched on both scale and locational conditions.
Source: HotelBank Editorial Team research (232 auberges / 96,306 reviews; 1,377 small ryokan / 575,991 reviews)
Overall scores come in at 4.45 for auberges against 4.27 for small ryokan, a gap of 0.18 points. By category the food-and-beverage gaps are the widest — food +0.27 (4.66 vs 4.39) and breakfast +0.26 (4.51 vs 4.25) — followed by cleanliness +0.29, rooms +0.26 and service +0.22. Whether a strong food rating actually translates into a higher rate varies by format; our analysis of Nagano’s breakfast premium, which runs 3x wider in some segments than others, tests exactly that on matched property pairs.
The categories where no gap opens are the interesting ones. Bath and onsen come in at 4.25 against 4.25 — exactly level — and bathroom at just +0.02. The auberge advantage in guest ratings, in other words, does not extend to the bathing experience. The reading is that even locations without a hot spring as a local asset can generate sufficient satisfaction through food and beverage, rooms and service alone. That carries a site-selection implication: a high-rate property can be made to work off a non-thermal site. Conversely, for anyone acquiring a property that does have a hot spring, we have set out how the form of the water rights shapes valuation in Who Owns the Hot Spring? Water Rights and Ryokan Valuation.
One more point: the value-for-money category scores 3.80 against 3.81 — essentially identical. Despite a 20-55% gap in listed prices, the sense of value guests report lands at the same level as small ryokan. High pricing is not damaging satisfaction; equally, the price premium is not generating any added sense of a bargain. For properties in this band, the practical question is less about room to raise rates than about continuing to back the rates already being charged with experience value.
| Review category | Auberge | Small ryokan | Gap |
|---|---|---|---|
| Overall | 4.45 | 4.27 | +0.18 |
| Dinner | 4.69 | 4.48 | +0.21 |
| Food | 4.66 | 4.39 | +0.27 |
| Breakfast | 4.51 | 4.25 | +0.26 |
| Service | 4.48 | 4.26 | +0.22 |
| Cleanliness | 4.38 | 4.09 | +0.29 |
| Rooms | 4.25 | 3.99 | +0.26 |
| Location | 4.25 | 4.10 | +0.15 |
| Bathroom | 4.04 | 4.02 | +0.02 |
| Bath & onsen | 4.25 | 4.25 | ±0.00 |
| Value for money | 3.80 | 3.81 | -0.01 |
Source: HotelBank Editorial Team research. Category scores are the simple average across properties with 10 or more ratings in that category
Openings Since 2023 Run at 17 a Year — 2.7x the Early 2010s
The distribution of opening dates is also worth a look. Of the 389 properties, an opening year can be identified for 289 (excluding 52 records dated 1 January 1990, presumed to be a bulk-entered placeholder, and 48 with no opening date registered).
Source: compiled by the HotelBank Editorial Team from MetroEngines Research (based on confirmed OTA listings, N=289 properties)
That the pre-1999 cohort is the largest at 73 properties likely reflects survivors of the pension and petit-hotel boom of the 1980s and 1990s. Openings then settled at 45 in the 2000s and 44 across 2010-2016, before accelerating to 38 over 2017-2019 (12.7 a year) and reaching 62 in the roughly three and a half years since 2023 (about 17 a year) — 2.7 times the pace of the early 2010s, which ran at 6.3 a year.
This time series carries two biases, however. The first is survivorship bias: properties that opened in the past and have since closed have dropped out of the current master, so older years look understated. The second is observation lead time: OTA listings appear only a few months before opening, so recent years may still grow as further listings arrive. The direction — growth in recent years — can be read with confidence, but the absolute rate of increase should be interpreted as a range.
There is policy support behind this as well. According to Ministry of Agriculture, Forestry and Fisheries materials, inbound food-related spending reached a record ¥2.3tn in fiscal 2024, and the Japan Tourism Agency opened applications in fiscal 2025 for a programme promoting gastronomy tourism built on the power of food. Total inbound travel spending itself set a record of ¥9,455.9bn in 2025, up 16.4% year on year. Travel demand that treats food as the destination is now supported on both the policy and statistical sides.
Conclusion — One Implementation of the Few-Rooms, High-Rate Model
Taking stock of the 389 domestic properties classified as auberges on OTAs, the following picture emerges. They average 7.4 rooms, the same tier as pensions and minshuku, yet their listed prices run 20-55% above ryokan in the same prefecture and roughly double those of pensions, placing them in the same band as resort hotels. Room count and price correlate at close to zero, so the rate is decoupled from the size of the box. On guest ratings, food scores +0.27 above small ryokan while bath, onsen and value-for-money sit level — confirming that the advantage is concentrated in food and beverage, rooms and service.
Three practical implications follow. First, a hot spring is not a necessary condition for a high rate. Since no gap opens on the bathing scores, there is room to enter this band on a non-thermal site. Second, the design logic for investment scale differs from conventional hotel development. Stacking up rooms does not raise the rate, so the revenue starting point is the design of the kitchen and restaurant rather than the room count. Third, the sense of value guests report remains level with ryokan. Given that high rates are already being achieved, the next increment lies not in raising prices but in deepening the density of the experience to push the value-for-money score into the 4-point range.
To repeat the caveat: the 389 properties covered here are those filed under that classification on OTAs, not the complete universe of the format. Only 42.9% carry “auberge” in their name, and the divergence between classification and self-description is large. Any statistical reading should begin from the nature of this population.
Related Reading
- Hotel Lunch Revenue in Japan: 102 Properties, 93x Category Gap
- Japan Wine Region Hotels 2026: Harvest ADR ¥10,136–¥19,644
- Shizuoka’s 67 New 2026 Hotels: 1,089 Rooms, 64% One-Room Villas
- Nagano Breakfast Premium: City +11.1% vs Resort +3.2% — 3x Segment Gap
- Who Owns the Hot Spring? Water Rights and Ryokan Valuation
References and Sources
■ Data sources
The MetroEngines Research property master (389 domestic, currently listed properties whose property type is auberge), the OTA listed-price history linked to that master (check-in 1 May – 17 August 2026, per room for double occupancy), and property-level aggregation of guest reviews. The comparison levels for ryokan, pensions, minshuku and resort hotels were calculated from the same property master and price history over the same period on the same basis.
■ Calculation assumptions
Listed prices use the period median of each property’s daily average price, covering only the 235 properties confirmed as listed on 15 or more days within the aggregation window. Cross-format price comparisons use the average of monthly listed prices over the trailing 12 months (August 2025 – July 2026); review category scores use the simple average across properties with 10 or more ratings in that category. The correlation coefficient between room count and price is computed at property level (N=235). The distribution of opening years uses a base of 289 properties, excluding 52 records dated 1 January 1990 (presumed bulk-entered) and 48 with no registered date.
■ Limitations and caveats
This article is not a census. Properties not listed on OTAs are excluded from the population, and properties that call themselves auberges while filed under another classification are missed (of the 389 properties, 167 — 42.9% — carry “auberge” in their name). Listed prices are publicly posted selling prices and differ from actual transacted prices. The opening-year time series contains both survivorship bias, as closed properties drop out of the current master, and observation lead time, as OTA listings appear only a few months before opening; the direction of growth can be read, but the absolute rate of increase should be interpreted as a range.
■ Market data
- MetroEngines Research — OTA property-type classification, listed prices, room counts and opening years (389 domestic auberge-classified properties; price aggregation N=235)
- HotelBank Editorial Team research — guest reviews (232 auberges / 96,306 reviews; 1,377 small ryokan / 575,991 reviews)
■ Government statistics and policy documents
- Japan Tourism Agency, “Inbound travel spending (final figures) reached ¥9,455.9bn, up 16.4% on 2024”
- Ministry of Agriculture, Forestry and Fisheries, Rural Development Bureau, “The State of Farm-Stay Tourism” (as of 3 February 2026)
- Japan Tourism Agency, “Opening of regional applications for the gastronomy tourism promotion programme harnessing the power of food” (2025)
- Ministry of Agriculture, Forestry and Fisheries, “Promotion of Farm-Stay Tourism”