

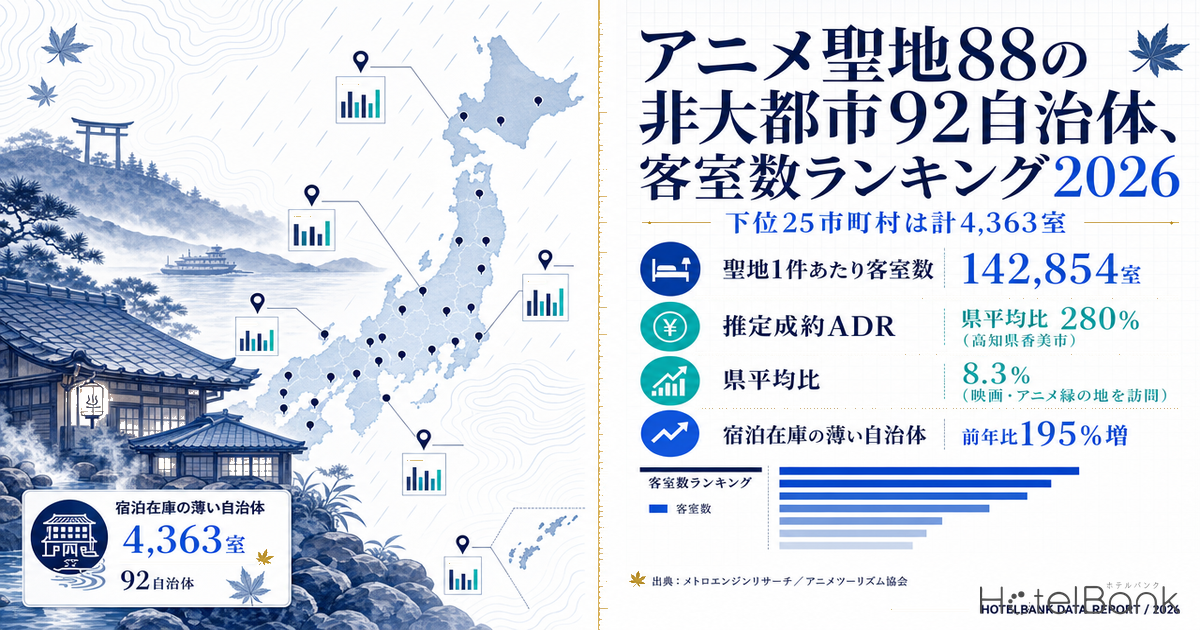
The 2026 edition of “88 Anime Spots to Visit in Japan,” announced by the Anime Tourism Association on February 13, 2026, widened its scope to 100 titles to mark the association’s 10th anniversary, certifying 175 entries in total — 146 works and 29 facilities. Certified locations run from Hakodate in Hokkaido to Nanjo in Okinawa, but most sit in towns and villages whose populations are counted in the thousands to tens of thousands. This article breaks all 175 entries down to the municipal level and, for the 92 municipalities outside Japan’s major metropolitan areas, cross-references property counts, room counts and 2026 room rates to quantify which places have a certified anime spot but a thin stock of rooms.
Metric Definitions Used in This Article
- ADR (average daily rate): Estimated transacted rate (tax-excluded equivalent), calculated by applying category-specific adjustment coefficients to the lowest published plan level each property lists on OTAs and similar channels (double occupancy, per-room rate, tax-included). Checked against per-property results disclosed by listed hotel REITs, the median error is 6.6%. These are estimates and differ from each property’s actual transacted prices or accounting figures. Area-level ADR is the monthly median across the covered properties (the level of a standard property in that area), averaged over the settled months of January–July 2026.
- Listed price (all-plan average, tax-included): The average published selling price, covering everything from room-only to meal-inclusive plans. Per-room rate at double occupancy. It rests on a different basis from estimated transacted ADR, so do not subtract one from the other.
- Property count and room count: Within MetroEngines Research’s coverage, the total of properties whose sales inventory for check-in dates on or after the survey date (August 21, 2026) was listed on OTAs, together with their registered room counts. Ryokan, hotels, simple lodgings, glamping sites and similar are included; properties not listed on OTAs are not.
- Certified spot count: The number of entries certified with that municipality as their location in the 2026 edition of “88 Anime Spots to Visit in Japan” (works and facilities combined).
- Data sources: MetroEngines Research, Anime Tourism Association, Japan Tourism Agency
- — 110 entries across 92 municipalities are located outside the major metropolitan areas. Broken down to municipal level, just over 70% of the 154 entries in the 2026 list whose municipality can be identified are located outside the big cities.
- — Lodging inventory across those 92 municipalities totals 4,211 properties and 142,854 rooms. The median room count per municipality is only 733, and 53 municipalities fall below 1,000 rooms.
- — The bottom 25 municipalities by rooms per certified spot hold 4,363 rooms combined — only 60% of the scale of Hakone in Kanagawa on its own (383 properties, 7,268 rooms).
- — A thin room stock does not mean cheap rates. Of the 87 municipalities with a calculable estimated transacted ADR, 32 come in above their prefectural average.
- — On the demand side, “visited places connected with films or anime” rose from 4.6% in 2019 to 8.3% in 2025. The “want to do next time” share stands at 14.0%, 5.7 points above the actual-visit share.
Breaking the 2026 List of 175 Entries Down to Municipality — 110 Outside the Major Metros
The first task is to fix the population. The 2026 certified list runs 146 works and 29 facilities in municipal-code order, and the granularity of its location labels is not uniform. Some are given only at prefecture level, such as “Aomori Prefecture” or “Hiroshima Prefecture,” while others are wide-area designations spanning several municipalities, such as “the Hitoyoshi–Kuma area of Kumamoto and beyond,” “Tanegashima, Kagoshima” or “the Yaeyama Islands, Okinawa.”
The 175 entries were therefore sorted into three groups: (a) Tokyo’s 23 special wards and the government-designated cities, (b) all other municipalities (non-metropolitan), and (c) prefecture-level or wide-area designations. The result is shown below: the 110 entries in the non-metropolitan group are spread across 92 municipalities, and those 92 are the subject of this analysis.
| Group | Works | Facilities | Total | Municipalities |
|---|---|---|---|---|
| Non-metropolitan municipalities (analyzed here) | 94 | 16 | 110 | 92 |
| Tokyo’s 23 wards and designated cities | 31 | 13 | 44 | 21 |
| Prefecture-level or wide-area designation (no municipality identified) | 21 | 0 | 21 | — |
| Total | 146 | 29 | 175 | — |
Source: Compiled by the HotelBank Editorial Team from the Anime Tourism Association’s “88 Anime Spots to Visit in Japan,” 2026 edition (N=175 entries)
As of the survey date, lodging inventory across the 92 non-metropolitan municipalities totals 4,211 properties and 142,854 rooms. The median room count per municipality is only 733; 25 municipalities hold fewer than 300 rooms and 35 fewer than 500. Fifty-three — just under 60% of the total — fall below 1,000 rooms. The flip side of a certification list deliberately weighted toward small regional municipalities and away from the big cities is that the capacity to receive visitors is small as well.
Demand Is Climbing — Inbound Visitors Who “Visited Film or Anime Locations” Went From 4.6% to 8.3%
Before turning to supply, it is worth fixing the primary demand data. The Japan Tourism Agency’s Inbound Consumption Trend Survey (formerly the Consumption Trend Survey for Foreigners Visiting Japan) asks inbound visitors what they did during their stay, allowing multiple answers, and one of the options is “visited places connected with films or anime.” Taking the measured values from the annual reports, 4.6% in 2019 rose to 7.5% in 2023, 8.1% in 2024 and 8.3% in 2025. Since the number of inbound visitors itself grew sharply over the same period, the increase in absolute headcount is larger than the growth in the share.
More telling is the “what I want to do on my next visit to Japan” side. That item rose from 10.2% in 2019 to 14.0% in 2025, running 5.7 points above the share who actually visited (8.3%). The picture is one in which a sizeable pool of people who have already been to Japan but have not yet visited an anime location keeps building up. Note that in 2020 and 2021 most of the quarterly surveys were suspended under entry restrictions and the annual figures are estimates only, so those years are excluded from the time series.
Source: Compiled by the HotelBank Editorial Team from the Japan Tourism Agency’s “Consumption Trend Survey for Foreigners Visiting Japan / Inbound Consumption Trend Survey,” annual reports for each year (all nationalities and regions, multiple answers)
As secondary information, the major travel booking group Trip.com Group announced on May 14, 2026 that searches for anime- and comic-related travel experiences across Asia were up 195% year on year (Trip.com International Travel Japan; Kanko Keizai Shimbun, May 25, 2026, among others). The same release noted that overseas ticket sales for a large anime event held in Tokyo were up 697% year on year. Being a corporate announcement, it cannot be read directly as the growth rate of the market as a whole, but its direction is consistent with the gradual upward trend shown in official statistics.
Room Stock Across the 92 Municipalities — Seen on the Map
Plotting the 92 non-metropolitan municipalities on a map makes the differences in capacity plain. Circle size is listed room count; colour separates municipalities with fewer than 300 rooms per certified spot (dark blue) from the rest (light blue). Small circles cluster in the Tokyo commuter belt and in island and mountain areas, while established tourist destinations such as Hakodate, Kanazawa, Hakone, Ito and Takayama carry large circles.
Source: MetroEngines Research, Anime Tourism Association (N=92 municipalities, 4,211 properties)
The Bottom 25 Municipalities by Room Stock — 4,363 Rooms Combined
This is the core of the analysis. The 92 municipalities were ranked by listed rooms per certified spot, and the bottom 25 extracted. Lodging inventory across those 25 comes to just 254 properties and 4,363 rooms. Set against Hakone in Kanagawa — a single town on the same list, with 383 properties and 7,268 rooms — all 25 municipalities combined reach only 60% of that scale.
| # | Municipality | Spots | Properties | Rooms | Rooms per spot |
Listed price | Est. transacted ADR |
vs pref. avg | N |
|---|---|---|---|---|---|---|---|---|---|
| 1 | Kasamatsu Gifu | 1 | 0 | 0 | 0 | — | — | — | — |
| 2 | Hokuei Tottori | 1 | 0 | 0 | 0 | — | — | — | — |
| 3 | Yokoze Saitama | 1 | 6 | 29 | 29 | 31,238 | 10,094 | 127% | 2 |
| 4 | Kami Kochi | 1 | 8 | 39 | 39 | 34,978 | 21,533 | 280% | 4 |
| 5 | Ochi Kochi | 1 | 2 | 43 | 43 | — | — | — | — |
| 6 | Hino Tokyo | 2 | 2 | 115 | 58 | 15,213 | 7,358 | 51% | 2 |
| 7 | Nagatoro Saitama | 1 | 11 | 83 | 83 | 50,663 | 17,832 | 224% | 5 |
| 8 | Kyotanabe Kyoto | 1 | 1 | 88 | 88 | — | — | — | — |
| 9 | Kozushima Tokyo | 1 | 11 | 89 | 89 | 26,724 | 16,242 | 113% | 2 |
| 10 | Kawanehon Shizuoka | 1 | 10 | 106 | 106 | 23,045 | 16,472 | 127% | 3 |
| 11 | Ashikita Kumamoto | 1 | 3 | 106 | 106 | 25,088 | 6,533 | 64% | 3 |
| 12 | Kamiichi Toyama | 1 | 5 | 112 | 112 | 32,200 | 14,700 | 199% | 4 |
| 13 | Higashimurayama Tokyo | 1 | 3 | 113 | 113 | 14,127 | 8,216 | 57% | 3 |
| 14 | Shin-Kamigoto Nagasaki | 2 | 19 | 264 | 132 | 21,578 | 8,210 | 107% | 8 |
| 15 | Sakaiminato Tottori | 2 | 11 | 304 | 152 | 20,570 | 9,978 | 122% | 4 |
| 16 | Tama Tokyo | 1 | 1 | 181 | 181 | — | — | — | — |
| 17 | Shirakawa Gifu | 1 | 17 | 191 | 191 | 43,348 | 19,836 | 185% | 8 |
| 18 | Chofu Tokyo | 2 | 6 | 384 | 192 | 17,319 | 11,928 | 83% | 6 |
| 19 | Yamanashi City Yamanashi | 1 | 9 | 202 | 202 | 47,602 | 15,412 | 137% | 5 |
| 20 | Kuki Saitama | 1 | 3 | 213 | 213 | 16,818 | 7,566 | 95% | 3 |
| 21 | Akishima Tokyo | 1 | 4 | 224 | 224 | 13,538 | 8,178 | 57% | 3 |
| 22 | Goto Nagasaki | 3 | 66 | 694 | 231 | 20,298 | 7,859 | 102% | 19 |
| 23 | Tatebayashi Gunma | 1 | 7 | 236 | 236 | 14,424 | 6,155 | 53% | 6 |
| 24 | Warabi Saitama | 1 | 3 | 270 | 270 | 14,945 | 8,335 | 105% | 2 |
| 25 | Nanjo Okinawa | 1 | 46 | 277 | 277 | 34,413 | 11,076 | 92% | 4 |
Listed price and estimated transacted ADR are averages of the settled months January–July 2026. N is the monthly median number of properties used to calculate estimated transacted ADR; treat cells with N below 5 as reference values. Source: Compiled by the HotelBank Editorial Team from MetroEngines Research and the Anime Tourism Association
In the top two municipalities, no property with sales inventory listed on OTAs could be confirmed as of the survey date. Kasamatsu in Gifu does have lodging properties on the register, but no listed sales inventory has been observed for any of them recently. Hokuei in Tottori is much the same: visitor demand for the certified Gosho Aoyama Manga Factory appears to be absorbed by inventory in neighbouring Kurayoshi (20 properties, 737 rooms) and Yonago. Kyotanabe in Kyoto has a single property with 88 rooms and stands in a clear complementary relationship with central Kyoto, about 30 minutes away by train.
The next tier runs 29 to 58 rooms per certified spot: Yokoze in Saitama (6 properties, 29 rooms), Kami in Kochi (8 properties, 39 rooms), Ochi in Kochi (2 properties, 43 rooms) and Hino in Tokyo (2 properties, 115 rooms). Kami hosts an Anpanman museum and is a family destination, yet its listed room count stops at 39. In Ochi, campgrounds along the Niyodo River make up the bulk of inventory, which makes year-round lodging capacity thinner still.
Source: Compiled by the HotelBank Editorial Team from MetroEngines Research and the Anime Tourism Association (N=25 municipalities)
The two island towns are also distinctive. Shin-Kamigoto in Nagasaki has two certified spots but only 19 properties and 264 rooms, while neighbouring Goto has three spots with 66 properties and 694 rooms. Together they come to 958 rooms — the equivalent of two or three mid-sized business hotels. On islands where ferry frequency is limited, lodging inventory is effectively the ceiling on how many people can stay, so the room to absorb a rise in demand is narrow. Read the other way round, it is also a structure in which a small room count makes it easier to lift both occupancy and rate. How rates on Japan’s islands are tiered is examined side by side across 10 municipalities in Autumn on Japan’s Islands: 2.37x ADR Gap Across 10 Municipalities.
32 of 87 Municipalities Beat Their Prefectural Average — Thin Stock Does Not Mean Cheap
“Few rooms” does not automatically mean “cheap.” Of the 87 municipalities for which an estimated transacted ADR could be calculated, 32 came in above their prefectural average. Even within the bottom 25, levels well above the prefectural average appear: Nagatoro in Saitama (224% of the prefectural average), Kamiichi in Toyama (199%), Shirakawa in Gifu (185%), Yamanashi City in Yamanashi (137%), and Yokoze in Saitama and Kawanehon in Shizuoka (both 127%).
What these share is a small property count combined with a population dominated by higher-rate formats — onsen ryokan, restored old houses and auberge-style inns. Shirakawa has 17 properties and 191 rooms with an estimated transacted ADR of ¥19,800, 1.85x the prefectural average (Gifu, ¥10,700). Kawanehon has 10 properties and 106 rooms at ¥16,500, above the Shizuoka average of ¥13,000. Kami in Kochi, at 280% of its prefectural average (¥21,500, N=4 properties), rests on too small a population to be more than a reference value, but the pattern is the same: a handful of high-rate properties setting the level for the whole area.
At the other end, some municipalities sit at around half their prefectural average — Tatebayashi in Gunma (53% of the prefectural average), Hino in Tokyo (51%), Ashikita in Kumamoto (64%) and Tochigi City in Tochigi (67%). All are business-hotel-led, in areas where lodging demand rests mainly on business travel. In this price band, there is still headroom on the rate side to take in a new visit motive such as an anime pilgrimage.
Source: Compiled by the HotelBank Editorial Team from MetroEngines Research and the Anime Tourism Association (N=87 municipalities; only those for which an estimated transacted ADR could be calculated)
What the scatter plot shows is that there is no clear correlation between room count and the ratio to the prefectural average. Within the band below 1,000 listed rooms, values spread from the 40% level all the way to 280%, so small scale is not what sets the rate. Format mix is the more dominant factor: municipalities with a high ryokan and resort share cluster toward the top, those with a high business-hotel share toward the bottom.
The 15 Municipalities With Multiple Spots — Headroom in How Themes Are Bundled
Of the 92 municipalities, 15 have two or more certified spots. Being able to offer several visit motives within a single municipality makes touring itineraries easier to build and length of stay easier to extend. Goto in Nagasaki (3 spots, 694 rooms), Chichibu in Saitama (3 spots, 1,008 rooms) and Yokosuka in Kanagawa (3 spots, 1,274 rooms) in particular have considerable scope to be designed as multi-theme destinations rather than single-theme ones.
| Municipality | Certified spot count | Properties | Rooms | Rooms per spot | Est. transacted ADR | vs pref. avg |
|---|---|---|---|---|---|---|
| Goto, Nagasaki | 3 | 66 | 694 | 231 | 7,859 | 102% |
| Chichibu, Saitama | 3 | 48 | 1,008 | 336 | 13,845 | 174% |
| Yokosuka, Kanagawa | 3 | 37 | 1,274 | 425 | 12,302 | 89% |
| Hino, Tokyo | 2 | 2 | 115 | 58 | 7,358 | 51% |
| Shin-Kamigoto, Nagasaki | 2 | 19 | 264 | 132 | 8,210 | 107% |
| Sakaiminato, Tottori | 2 | 11 | 304 | 152 | 9,978 | 122% |
| Chofu, Tokyo | 2 | 6 | 384 | 192 | 11,928 | 83% |
| Yokote, Akita | 2 | 17 | 867 | 434 | 6,854 | 88% |
| Kawagoe, Saitama | 2 | 22 | 959 | 480 | 9,176 | 115% |
| Tachikawa, Tokyo | 2 | 20 | 1,633 | 816 | 11,087 | 77% |
| Fujisawa, Kanagawa | 2 | 52 | 2,042 | 1,021 | 9,406 | 68% |
| Sasebo, Nagasaki | 2 | 59 | 4,472 | 2,236 | 7,271 | 95% |
| Hakone, Kanagawa | 2 | 383 | 7,268 | 3,634 | 25,829 | 187% |
| Nagasaki City, Nagasaki | 2 | 142 | 7,916 | 3,958 | 9,287 | 121% |
| Hakodate, Hokkaido | 2 | 173 | 9,818 | 4,909 | 8,089 | 81% |
Source: Compiled by the HotelBank Editorial Team from MetroEngines Research and the Anime Tourism Association (N=15 municipalities)
Chichibu has three certified spots and an estimated transacted ADR at 174% of the prefectural average (¥13,800), a standout level within Saitama. Against an inventory of 48 properties and 1,008 rooms, that works out to 336 rooms per certified spot — just short of the bottom-25 threshold of 277 rooms or fewer. Taken together with neighbouring Yokoze (29 rooms) and Nagatoro (83 rooms) as a single Chichibu area, the total reaches roughly 1,120 rooms, leaving scope to bundle capacity through wide-area cooperation. Where the Chichibu area sits within Saitama’s price bands is set out as a 35-area tier structure in Saitama Hotel Rates Vary 4.8x by Municipality: 35 Areas, 5 Tiers.
Sakaiminato (2 spots, 304 rooms) and Chofu (2 spots, 384 rooms) are both cases where a work and a related facility were certified together under the same theme. Sakaiminato’s Mizuki Shigeru Road draws mainly daytime visitors and its conversion into overnight stays has long been seen as the challenge; against an inventory of 11 properties and 304 rooms, a shift of only a few points in that conversion rate would move city-wide occupancy substantially. How much of the visitor demand currently going home the same day can be redirected into overnight stays is also examined at prefecture level in Gifu 8.3% vs Wakayama 29.7%: Overnight Stay Rates in 20 Prefectures.
How to Read the Headroom in Capacity
Pulling the numbers together, three implications stand out.
First, demand-side indicators point upward in both official statistics and corporate announcements, and the “want to do next time” cohort runs 5.7 points above those who actually visited. There is still room for latent demand to surface. Second, of the 92 non-metropolitan municipalities that would receive it, 53 hold fewer than 1,000 rooms and 25 fewer than 300 — a thin inventory structure. Third, thin inventory does not mean low rates: 32 of the 87 municipalities sit above their prefectural average.
The implication for lodging operators is straightforward. In municipalities with thin inventory, demand peaking on particular dates and spilling over into neighbouring municipalities is already the default. Read the other way round, there is broad headroom left for existing properties to redesign their room rates in stages, or for new supply to enter. The tier with fewer than 100 rooms per certified spot in particular — Kasamatsu, Hokuei, Yokoze, Kami, Ochi, Hino, Nagatoro, Kyotanabe and Kozushima — sits in a range where a single 20-to-30-room property opening would change the area’s supply composition.
For municipalities and DMOs, the implication is that even where inventory falls short on its own, bundling across a wider area — Chichibu plus Yokoze plus Nagatoro, or Goto plus Shin-Kamigoto — can reach a workable scale of capacity, as these cases show. Wide-area cooperation on lodging inventory fits well with a visit motive such as an anime pilgrimage, where length of stay is relatively predictable.
Note that the room counts in this article cover only properties whose sales inventory can be confirmed on OTAs, and exclude small family-run lodgings, farm stays and publicly run accommodation that are not listed on OTAs. In towns and villages in particular, actual capacity may exceed the figures shown here.
Related Reading
- 2027 Taiga Drama Sites: 939 Rooms in Yokosuka vs 10 Near Tozenji
- Autumn on Japan’s Islands: 2.37x ADR Gap Across 10 Municipalities
- Saitama Hotel Rates Vary 4.8x by Municipality: 35 Areas, 5 Tiers
- Japan Intra-Prefecture ADR Gaps Reach 5.2x: 368 Municipalities Ranked
- Gifu 8.3% vs Wakayama 29.7%: Overnight Stay Rates in 20 Prefectures
- Tottori’s 3-Tier Hotel Market: Onsen ADR 2.16x the City Average
- World Masters Games 2027 Kansai: 164,707 Rooms Across 50 Venue Cities
- Oshikatsu Travel Hotel Demand: Magical Mirai 2026 Creates +¥75M Upside in Hamamatsu
References and Sources
■ Data sources
Certified spot counts come from the Anime Tourism Association’s “88 Anime Spots to Visit in Japan,” 2026 edition (announced February 13, 2026; 146 works and 29 facilities, 175 entries in total). Property and room counts are MetroEngines Research’s tally of properties for which sales inventory with check-in dates on or after August 21, 2026 could be confirmed as of that date (92 municipalities, 4,211 properties, 142,854 rooms). Listed price and estimated transacted ADR come from the same firm’s monthly area aggregates, averaged over the settled months of January–July 2026. Demand-side shares are taken from the annual reports of the Japan Tourism Agency’s “Inbound Consumption Trend Survey (formerly the Consumption Trend Survey for Foreigners Visiting Japan).”
■ Calculation assumptions
Based on their location labels, the 175 entries were sorted into three groups — (a) Tokyo’s 23 wards and the designated cities, (b) all other municipalities, and (c) prefecture-level or wide-area designations — and only the 110 entries across 92 municipalities in group (b) are analyzed. “Rooms per certified spot” is a simple ratio of each municipality’s listed room count divided by its number of certifications, with no weighting for visitor numbers or length of stay. The ratio to the prefectural average uses prefecture-level estimated transacted ADR, calculated over the same period by the same method, as the denominator. Area-level ADR is a two-stage aggregate: the median across covered properties is taken monthly, and those monthly values are then averaged.
■ Limitations and caveats
Room counts cover only properties whose sales inventory can be confirmed on OTAs, and exclude small lodgings and publicly run accommodation not listed on OTAs. In towns and villages in particular, actual capacity may exceed these figures. Estimated transacted ADR is an estimate: against per-property disclosures from listed hotel REITs the median error is 6.6% (verified across the business, city, resort, ryokan and capsule categories), and it differs from each property’s actual transacted prices or accounting figures. Cells based on fewer than five properties (N) rest on a small population and are no more than reference values. Listed price and estimated transacted ADR rest on different bases and cannot be subtracted from one another. This article is a static stock-take of room inventory and rates, not a forecast of future demand volumes or investment returns.
■ Certification list (primary source)
- Anime Tourism Association, “On the Selection of the 2026 Edition of 88 Anime Spots to Visit in Japan” (February 13, 2026)
- Anime Tourism Association official site
■ Government statistics (primary sources)
- Japan Tourism Agency, “Inbound Consumption Trend Survey, Annual Report 2025” (PDF, Table 6-1; visited places connected with films or anime 8.3% / want to do next time 14.0%)
- Japan Tourism Agency, “Inbound Consumption Trend Survey, Annual Report 2024” (PDF, 8.1% / 11.8%)
- Japan Tourism Agency, “Consumption Trend Survey for Foreigners Visiting Japan, Annual Report 2023” (PDF, Table 6-3; 7.5% / 10.9%)
- Japan Tourism Agency, “Consumption Trend Survey for Foreigners Visiting Japan, Annual Report 2022” (PDF, 5.3% / 8.7%)
- Japan Tourism Agency, “Consumption Trend Survey for Foreigners Visiting Japan, Annual Report 2019” (PDF, Table 6-3; 4.6% / 10.2%)
- Japan Tourism Agency, “Inbound Consumption Trend Survey (formerly Consumption Trend Survey for Foreigners Visiting Japan)” — list of reports
■ Corporate announcements and press coverage (secondary sources)
- Trip.com International Travel Japan, “Trip.com Group Releases Latest Trends in Anime and Comic Travel Demand” (May 14, 2026)
- Kanko Keizai Shimbun, “Anime Pilgrimage Travel Demand Expands Rapidly, Searches Up 195% Year on Year — Trip.com Group Releases Latest Trends” (May 25, 2026)
- Weekly ASCII, “100 Anime Titles for the 10th Anniversary: the 2026 Edition of 88 Anime Spots to Visit in Japan Is Announced”
■ Market data
- MetroEngines Research — property and room counts (based on confirmed OTA listings, N=4,211 properties / 142,854 rooms), listed price and estimated transacted ADR (settled months January–July 2026)