

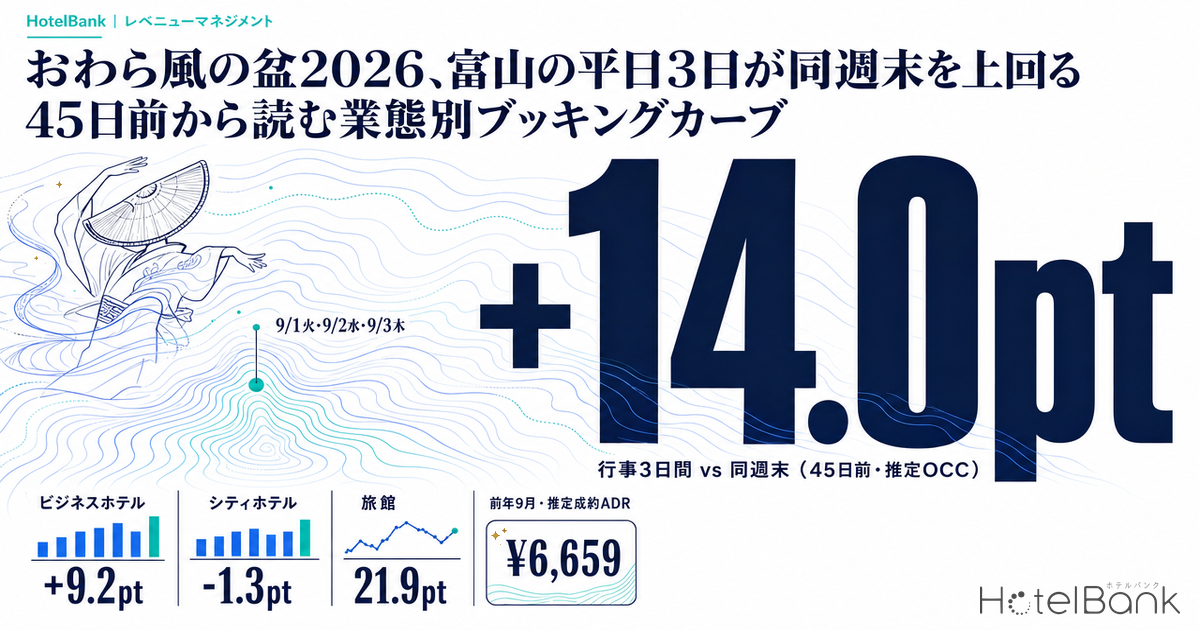
Toyama’s lodging demand takes a shape that defies the usual day-of-week logic — but only for three days, from Tuesday 1 September through Thursday 3 September 2026. Estimated OCC (OTA-listed inventory basis) 45 days before the stay date reads 81.5% on 1 Sep, 83.5% on 2 Sep and 82.8% on 3 Sep across all hotel categories (N≈200). Friday 4 September in the same week sits at 67.2% and Saturday 5 September at 70.0%, which means the three weekdays run 14.0pt above the weekend of their own week. Against the same weekdays a week later (Tue 8 Sep 59.7%, Wed 9 Sep 60.4%, Thu 10 Sep 62.0%) the gap widens to an average of 21.9pt. Early September in Toyama is a market where demand is built by the calendar date, not by the day of the week. How that demand lands differs sharply by hotel category, too: the build-up from T-45 to the latest observation was +9.2pt at business hotels but -1.3pt at ryokan — the opposite sign. This article breaks those three days down not through price, but through pace of pick-up and category difference.
Scope: Toyama Prefecture, all categories, N≈200 properties (business hotels N=61, city hotels N=16, ryokan N=61–63). The price metric in this article is estimated settled ADR (the transaction price level inferred from OTA and other sales data, tax-excluded equivalent); occupancy is an estimate on an OTA-listed inventory basis. Both definitions appear at the end of the article. Data as of 19 August 2026.
- — The three event days (1–3 Sep) averaged 82.6% estimated OCC at T-45 — 14.0pt above the Friday and Saturday of the same week (68.6%) and 21.9pt above the same weekdays a week later (60.7%).
- — The gap was still 20.7pt at T-30, essentially unchanged. Demand was not built by a last-minute rush; its shape was already largely set 45 days before the stay date (an early-settling pattern).
- — The category spread is roughly threefold. The T-45 gap between event days and control days is +16.8pt at business hotels and +13.6pt at city hotels, but only +5.4pt at ryokan.
- — Remaining headroom also runs in opposite directions by category. From T-45 to the latest observation: business hotels +7.9 to +9.6pt, city hotels -1.6 to +2.8pt, ryokan -2.7 to -1.3pt (N=61–63).
- — Pricing should be anchored to last year’s finalised figures. Estimated settled ADR for Toyama business hotels in September 2025 was ¥6,659 (N=67, finalised) — the fourth highest month of that year.
Demand built by the calendar — three weekdays outrun their own weekend
Etchu-Yatsuo Owara Kaze no Bon (越中八尾おわら風の盆) is held every year from 1 to 3 September in the Yatsuo district of Toyama City. For 2026 the main festival again falls on Tuesday 1, Wednesday 2 and Thursday 3 September, scheduled from 17:00 to 23:00 on the 1st and 2nd and from 19:00 to 23:00 on the 3rd, according to the Toyama City official website and the Toyama City Tourism Association. The eve-festival previously held in late August has been suspended for the time being, which structurally concentrates demand even more tightly into the three main days. (Event details are subject to change, so always re-confirm against the organiser’s official announcement before acting on them.)
A fixed calendar date is extremely convenient to manage from a revenue standpoint — but it also means the day of the week shifts each year, and settings are easily missed if you are not watching. In 2026 the main festival landed on Tuesday, Wednesday and Thursday: normally the three weakest demand days in Toyama. The chart below places estimated OCC at T-45 and T-30 side by side for the eight dates in scope.
Source: MetroEngines Research; compiled by the HotelBank Editorial Team
The three event days average 82.6% at T-45 — 14.0pt above the 68.6% average of the Friday and Saturday of the same week (4 and 5 September) and 21.9pt above the 60.7% average of the same weekdays a week later (8, 9 and 10 September). The picture is unchanged at T-30: 85.3% on average across the three event days against 64.6% for the same weekdays a week later, a gap of 20.7pt. Both fixed observation points confirm consistently that the driver of demand here is the calendar date, not the day of the week.
| Stay date | Day | Type | T-45 | T-30 | Gap vs same weekday next week (T-45) |
|---|---|---|---|---|---|
| 1 Sep | Tue | Event day | 81.5% | 84.7% | +21.8pt |
| 2 Sep | Wed | Event day | 83.5% | 87.0% | +23.1pt |
| 3 Sep | Thu | Event day | 82.8% | 84.2% | +20.8pt |
| 4 Sep | Fri | Same-week weekend | 67.2% | 67.3% | — |
| 5 Sep | Sat | Same-week weekend | 70.0% | 71.8% | — |
| 8 Sep | Tue | Control | 59.7% | 63.9% | — |
| 9 Sep | Wed | Control | 60.4% | 63.9% | — |
| 10 Sep | Thu | Control | 62.0% | 66.1% | — |
Toyama Prefecture, all categories, N≈200 properties. Estimated OCC (OTA-listed inventory basis). Source: MetroEngines Research; compiled by the HotelBank Editorial Team
What deserves attention is that the gap already exceeded 20pt at T-45. Demand for the three event days did not accumulate through a last-minute rush; its shape was largely settled before the 45-day mark. Where the control days of 8–10 September climb straightforwardly by around 4pt, from 59.7–62.0% at T-45 to 63.9–66.1% at T-30, the event days add on top of an already high level. In other words, this is not a market where “event days fill up at the last minute” but one where “event days fill early and head towards selling out.” An analysis tracking the same three days through prefecture-wide inventory depletion is collected in Owara Kaze no Bon 2026: 85.0% OCC on 3 Weekdays, 45 Days Out (the observation timing differs, so the levels do not map onto each other directly).
Curves that split by category — business hotels build, ryokan flatline
Break the same three days down by hotel category and the way demand is absorbed looks completely different. Below is the booking curve from T-45 to the latest observation for a stay date of Wednesday 2 September, with business hotels on the control date of Wednesday 9 September overlaid.
Source: MetroEngines Research; compiled by the HotelBank Editorial Team
Business hotels (N=61) went from 83.5% at T-45 through 87.8% at T-30 to 92.7% at the latest observation (15 days before the stay date), a build-up of +9.2pt over the window. Compared with business hotels on the control date of 9 September (64.6% at T-45 to 71.7% at the latest observation, +7.1pt), they sustained the same pace of pick-up from a level roughly 21pt higher. City hotels (N=16) were already high at 88.0% at T-45 and then plateaued — 92.6% at T-30, 90.8% at the latest observation.
Ryokan (N=62), by contrast, moved from 77.9% at T-45 to 76.6% at the latest observation, or -1.3pt. The same holds on 1 September (74.6% to 71.9%, -2.7pt) and 3 September (76.3% to 74.9%, -1.4pt): across all three days, they added nothing to their T-45 level. The T-45 gap between event days and control days also stops at +5.4pt on average for ryokan, against +16.8pt for business hotels and +13.6pt for city hotels. The benefit of event demand is spread roughly threefold across categories. The tendency for ryokan curves to resist a late build is not confined to Toyama — the same shape is observed in Yamanashi Obon: Ryokan Gain Only +1.1pt, Business Hotels +7.9pt.
| Category (N) | Stay date | T-45 | T-30 | Latest obs. | T-45 → latest |
|---|---|---|---|---|---|
| Business hotels (61) | 1 Sep, Tue | 80.9% | 84.3% | 90.5% | +9.6pt |
| Business hotels (61) | 2 Sep, Wed | 83.5% | 87.8% | 92.7% | +9.2pt |
| Business hotels (61) | 3 Sep, Thu | 82.0% | 85.1% | 89.9% | +7.9pt |
| City hotels (16) | 1 Sep, Tue | 91.7% | 93.7% | 94.0% | +2.3pt |
| City hotels (16) | 2 Sep, Wed | 88.0% | 92.6% | 90.8% | +2.8pt |
| City hotels (16) | 3 Sep, Thu | 92.7% | 86.7% | 91.1% | -1.6pt |
| Ryokan (63) | 1 Sep, Tue | 74.6% | 74.7% | 71.9% | -2.7pt |
| Ryokan (62) | 2 Sep, Wed | 77.9% | 77.8% | 76.6% | -1.3pt |
| Ryokan (61) | 3 Sep, Thu | 76.3% | 73.5% | 74.9% | -1.4pt |
Estimated OCC (OTA-listed inventory basis). The latest observation is 14 days before the stay date for 1 Sep, 15 days for 2 Sep and 16 days for 3 Sep. Source: MetroEngines Research; compiled by the HotelBank Editorial Team
The difference reads as a difference in the nature of the demand. The festival takes place at night in the streets of the town and ends at 23:00. Demand therefore gravitates towards urban lodging on the assumption of an onward journey the next morning, and it is the categories with the most rooms in the prefecture — business hotels (7,948 rooms across the 61 properties in scope) and city hotels (2,133 rooms across 16) — that absorb it. Ryokan (1,408–1,421 rooms in scope) are usually designed around a stay that includes dinner service, which structurally clashes with an event ending at 23:00. Ryokan’s own T-45 level of 74.6–77.9% is by no means low, but it is closer to ordinary early-September demand than to event demand — and the small gap against control days at 68.4–74.7% bears that out.
A yardstick for price — where does Toyama’s September estimated settled ADR sit?
It is worth attaching a price yardstick to the discussion of pick-up. Only months with finalised figures are used here. For Toyama business hotels (finalised months, N=62–72 properties), estimated settled ADR for the most recent finalised month, July 2026, was ¥6,462, or +3.1% against ¥6,270 in July 2025. September of last year was ¥6,659 (N=67) — the fourth highest month of 2025, behind August (¥7,039), May (¥7,010) and November (¥6,897). Last year’s finalised figures show that early September forms one of the higher price bands of the year for Toyama’s business hotels.
Toyama business hotels, estimated settled ADR (finalised figures only). Source: MetroEngines Research; compiled by the HotelBank Editorial Team
The other categories, on finalised months: city hotels (N=16) were ¥6,992 in July 2026 against ¥7,114 the previous July, or -1.7%, with September of last year at ¥7,631. Ryokan (N=73–75) were ¥11,520 in July 2026 against ¥12,210 the previous July, or -5.7%, with September of last year at ¥11,722. Only business hotels have turned positive year on year — and it is suggestive that the category absorbing event demand most strongly is the same category whose price sits above last year.
Note that estimated settled ADR for August and September 2026 remains an estimate based on the current sales position and must wait for month-end finalisation. This article therefore avoids a simple comparison against last year’s finalised figures, using last year’s finalised level only as a starting reference point for September pricing.
For revenue managers running business hotels, city hotels and ryokan in Toyama — implications and an action plan
1. Overwrite the assumption that “weekdays are weak” with the calendar. In 2026 the three event days fall on Tuesday, Wednesday and Thursday. Estimated OCC at T-45 across all categories averages 82.6% on event days against 68.6% on the Friday and Saturday of the same week. If your pricing calendar is built on day-of-week logic, these three days sit outside that logic. The first thing to check is whether you have a mechanism that lets a calendar-date event overwrite the day-of-week template.
2. The contest is most likely decided before T-45. The gap between event days and control days is already 21.9pt at T-45 and barely different at 20.7pt at T-30. A gap that does not widen over the window means most of the demand had already entered the market by the time observation began at T-45. If your own three days were away from the market level at the T-45 cross-section (82.6% all categories, 80.9–83.5% business hotels, 88.0–92.7% city hotels), treat that as a question about when you opened for sale, not about last-minute promotion.
3. The length of the window in which you can still add business differs by category. Business hotels added +7.9 to +9.6pt between T-45 and the latest observation, while ryokan were flat at -1.3 to -2.7pt. For ryokan, the T-45 level may already be close to the final shape, and inventory and rate operations premised on growing from there are unlikely to work. Conversely, business hotels have room to design remaining-inventory control on the assumption that headroom persists past T-45.
4. Anchor price to last year’s finalised figures. Estimated settled ADR for Toyama business hotels last September was ¥6,659, the fourth highest month of that year. The most recent finalised month (July 2026, ¥6,462) is +3.1% year on year. If your own early-September rates sit well below that range, it is a reason to examine whether price is failing to follow the strength of demand.
| Horizon | Action | Decision trigger (figures from this article) | Objective |
|---|---|---|---|
| Today to this week | Take a day-by-day inventory of remaining rooms and rates for 1–3 September, and check whether any settings inherited from the day-of-week template remain | If your three days are lined up on the same pricing logic as the Friday and Saturday of the same week (market T-45: 67.2% and 70.0%) | Avoid losing calendar-date demand to day-of-week logic |
| Today to this week | For days where remaining inventory is thin, consider narrowing the allocation to lower rate bands | If your 2 September has sold down close to the business-hotel market’s latest observation of 92.7% | Shift the unit price of remaining inventory upwards |
| Within two weeks | Design inventory and rates for Friday 4 and Saturday 5 September and the week after the festival (8–10 September) as demand separate from the event days | The market has 4 September at 67.2% at T-45 and the following Tue–Thu at 59.7–62.0% — around 20pt below the event days | Do not carry aggressive event-day pricing into surrounding dates |
| Within two weeks | For ryokan, consider prioritising a clearer articulation of stay value (dining time slots, shuttle availability and so on) over additional event-day promotion | The ryokan T-45 gap between event and control days stops at +5.4pt on average, and T-45 to latest is -1.3 to -2.7pt | Do not concentrate promotional budget on a window that resists growth |
| Looking to next month | Codify as an operating rule that the sales-open date for 1–3 September 2027 (Wed, Thu, Fri) sits earlier than T-45 | The gap between event and control days is already 21.9pt at T-45 and barely changed at 20.7pt at T-30 | Have your inventory on the shelf before demand enters the market |
| Looking to next month | Redesign the early-September price range starting from last year’s finalised figures | Estimated settled ADR for Toyama business hotels last September was ¥6,659 (N=67, finalised), and the most recent finalised month is +3.1% year on year | Connect your price sense to finalised figures rather than guesswork |
Source: MetroEngines Research; compiled by the HotelBank Editorial Team
Reading the landing point from the T-45 cross-section — three scenarios and a two-axis sensitivity table
Everything to this point has been measured market data. What operators actually need is a view of where their own T-45 cross-section sits relative to the market and where it could land from there, so the following illustrative calculations use the measured build-up figures from this article. All of them are illustrative and exclude the effects of pricing actions, inventory adjustments and group booking movements.
| Scenario | Assumed build-up | Basis (measured in this article) | Estimated landing OCC |
|---|---|---|---|
| Pessimistic — ryokan pattern | -2.7pt | Ryokan, 1 Sep: 74.6% at T-45 → 71.9% at latest observation | 79.9% |
| Central — city hotel pattern | +2.8pt | City hotels, 2 Sep: 88.0% at T-45 → 90.8% at latest observation | 85.4% |
| Optimistic — business hotel pattern | +9.6pt | Business hotels, 1 Sep: 80.9% at T-45 → 90.5% at latest observation | 92.2% |
Source: MetroEngines Research; compiled by the HotelBank Editorial Team (illustrative)
The spread is 12.3pt. Even at “market level at T-45,” in other words, the landing point can fall below 80% or exceed 92% depending on category and operation — so the T-45 cross-section alone is grounds for neither comfort nor alarm. What matters for the decision is less the level of the cross-section itself than how much your own category is structurally able to add after T-45.
Two-axis sensitivity — T-45 cross-section × build-up
The table below reads the estimated landing OCC from estimated OCC at T-45 (vertical axis) and the build-up from T-45 to the latest observation (horizontal axis). Shaded cells mark the approximate positions measured in this article (business hotels 2 Sep, ryokan 2 Sep, city hotels 1 Sep).
| T-45 \ build-up | -3pt | 0pt | +3pt | +6pt | +9pt |
|---|---|---|---|---|---|
| 70.0% | 67.0% | 70.0% | 73.0% | 76.0% | 79.0% |
| 75.0% | 72.0% | 75.0% | 78.0% | 81.0% | 84.0% |
| 80.0% | 77.0% | 80.0% | 83.0% | 86.0% | 89.0% |
| 85.0% | 82.0% | 85.0% | 88.0% | 91.0% | 94.0% |
| 90.0% | 87.0% | 90.0% | 93.0% | 96.0% | 99.0% |
Simple addition (capped at 100%). Source: MetroEngines Research; compiled by the HotelBank Editorial Team (illustrative)
Using it is straightforward: find your own T-45 cross-section for the date on the vertical axis, and find your category’s measured build-up over its last three to six events on the horizontal axis. If the landing point falls in a band above 90%, there is room to shift operations towards raising the unit price of remaining rooms. If it falls below 80%, it is more effective to go back to the design of the sales-open date and channel allocation ahead of T-45. In a market where event-day demand is settled by T-45, last-minute promotion can move you only one or two notches along the horizontal axis of this table.
Summary — three yardsticks for measuring a calendar-date event
Three yardsticks can be taken from the three days of Owara Kaze no Bon 2026 and applied to other areas and other events.
Yardstick 1: comparison with the same week’s weekend. Whether event days exceed the Friday and Saturday of their own week is the test of whether the event has the power to override day-of-week demand. In Toyama, at T-45, the three event days averaged 82.6% against 68.6% for the same-week weekend, a gap of 14.0pt. Where this is positive, it is worth overwriting the day-of-week template.
Yardstick 2: how the T-45 to T-30 gap moves. An event whose gap widens over the window is a last-minute-demand type; one whose gap holds steady is an early-settling type. Toyama was +21.9pt at T-45 and +20.7pt at T-30 — essentially unchanged, and therefore early-settling. In this pattern, the design of the sales-open date matters more than last-minute promotion. The same “settled by T-45” pattern in festival demand is verified with a day-of-week-matched control method in Yamagata Hanagasa 2026: Demand Settled 45 Days Out, +9.6pt vs Normal.
Yardstick 3: build-up by hotel category. Producing the build-up from T-45 to the latest observation by category shows who is absorbing the demand. In Toyama it was +7.9 to +9.6pt for business hotels, -1.6 to +2.8pt for city hotels and -2.7 to -1.3pt for ryokan. Which side your own category sits on changes the appropriate action entirely.
Demand built by the calendar shifts its day of the week each year. In 2027, 1–3 September fall on Wednesday, Thursday and Friday. The figures from this year’s three days are worth carrying forward into next year’s sales-open decision.
About the data
· Definition of estimated OCC: OTA-listed inventory occupancy = 100 − 100 × rooms remaining on OTA listings ÷ total rooms. It is an estimate based on how far inventory offered on OTAs has sold down, and its definition differs from actual room occupancy (it reads higher). The target month is September 2026; observation windows are as below.
· Booking curves: observation points are collected continuously from roughly 90 days before the stay date through to the day before (for the dates in this article, 75 points from 89 to 15 days before the stay date). This article analyses the cross-sections within a lead time of 45 days, and “latest observation” refers to the most recent observation point available as of the data date (19 August 2026).
· Definition of estimated settled ADR: the transaction price level (tax-excluded equivalent) inferred from OTA and other sales data (lowest-plan level × category-specific coefficient, ensembled across multiple channels). Past months are finalised figures; current and future months are estimates based on the present sales position. Reconciliation against publicly disclosed operating results gives a median error of 6.6%. This article cites only months with finalised figures.
· Breakdown of N: for booking curves, Toyama Prefecture, all categories, N=199–202 properties (12,872–12,913 total rooms); business hotels N=61 properties (7,948 rooms); city hotels N=16 properties (2,133 rooms); ryokan N=61–63 properties (1,408–1,421 rooms). For estimated settled ADR, Toyama business hotels N=62–72 properties, city hotels N=16 properties, ryokan N=70–75 properties (all varying by month).
· Data as of 19 August 2026. Sales positions and inventory change daily, so the figures in this article are a snapshot as at the time of collection.
References and sources
■ Data sources
Estimated OCC and booking curves are based on listed remaining-room data for 202 properties and 12,913 rooms in Toyama Prefecture (199–202 properties and 12,872–12,913 rooms depending on the stay date), whose public OTA inventory MetroEngines Research collects daily across Japan’s major OTAs. The category breakdown is 61 business hotels with 7,948 rooms, 16 city hotels with 2,133 rooms and 61–63 ryokan with 1,408–1,421 rooms. Estimated settled ADR uses the monthly series from the same platform (Toyama business hotels N=62–72 properties, city hotels N=16 properties, ryokan N=70–75 properties). Event dates and times were confirmed against three sources: the Toyama City official website, the Toyama City Tourism Association and Toyama Tourism Navi. Data as of 19 August 2026.
■ Assumptions behind the illustrative calculations
Estimated OCC = 100 − 100 × rooms remaining on OTA listings ÷ total rooms. Lead time refers to the number of days remaining until the stay date, and this article compares three fixed points: T-45, T-30 and the latest observation (14–23 days before the stay date). Event days are defined as 1–3 September 2026, the same-week weekend as 4 and 5 September, and control days as the same weekdays a week later (8–10 September). The scenario table and the two-axis sensitivity table are illustrative calculations that simply add the measured category build-up (business hotels +7.9 to +9.6pt / city hotels -1.6 to +2.8pt / ryokan -2.7 to -1.3pt) to the T-45 cross-section, and do not incorporate the effects of pricing actions, inventory adjustments or group booking movements. Estimated settled ADR comparisons use only months with finalised figures, and year-on-year changes are calculated on monthly series for the same category and the same area.
■ Limitations and caveats
Estimated OCC is an estimate based on how far OTA-listed inventory has sold down, and its definition differs from actual room occupancy, which includes direct bookings, corporate contracts and group inventory (it generally reads higher). Estimated settled ADR carries a median error of 6.6% against publicly disclosed operating results (tax-excluded equivalent); August and September 2026 are on a pre-finalisation sales-snapshot basis and are therefore not cited in this article. The number of properties N varies by stay date and month, and category classification depends on how each property registers itself. Event dates and times may be changed at the organiser’s discretion, so re-confirm against official announcements before acting on them. This article indicates trends for the market as a whole and does not represent the results of any individual property.
· Etchu-Yatsuo Owara Kaze no Bon | Toyama City official website
· Etchu-Yatsuo Owara Kaze no Bon | Toyama City Tourism Association (Toyama City official tourism site)
· Owara Kaze no Bon 2026 | Toyama Tourism Navi (Toyama Prefecture official tourism site)
Related reading
- Owara Kaze no Bon 2026: 85.0% OCC on 3 Weekdays, 45 Days Out
- Yamagata Hanagasa 2026: Demand Settled 45 Days Out, +9.6pt vs Normal
- Omagari Fireworks: Akita 97.8% OCC 45 Days Out, Only 2.2pt Headroom
- Aomori Nebuta 2026: 97.4% Sold 45 Days Out, Post-Festival +14pt
- SHINE UP FES 2026: Tottori’s Demand Peak Sat 100km From the Venue
- Yamanashi Obon: Ryokan Gain Only +1.1pt, Business Hotels +7.9pt
- Chiba 4 Hotel Types: 22.7pt Gap at T-45 Narrows to 16.0pt by T-21
- Oita Ryokan vs Resorts: 61.6% and 78.5% OCC 45 Days Out for Sep 12