

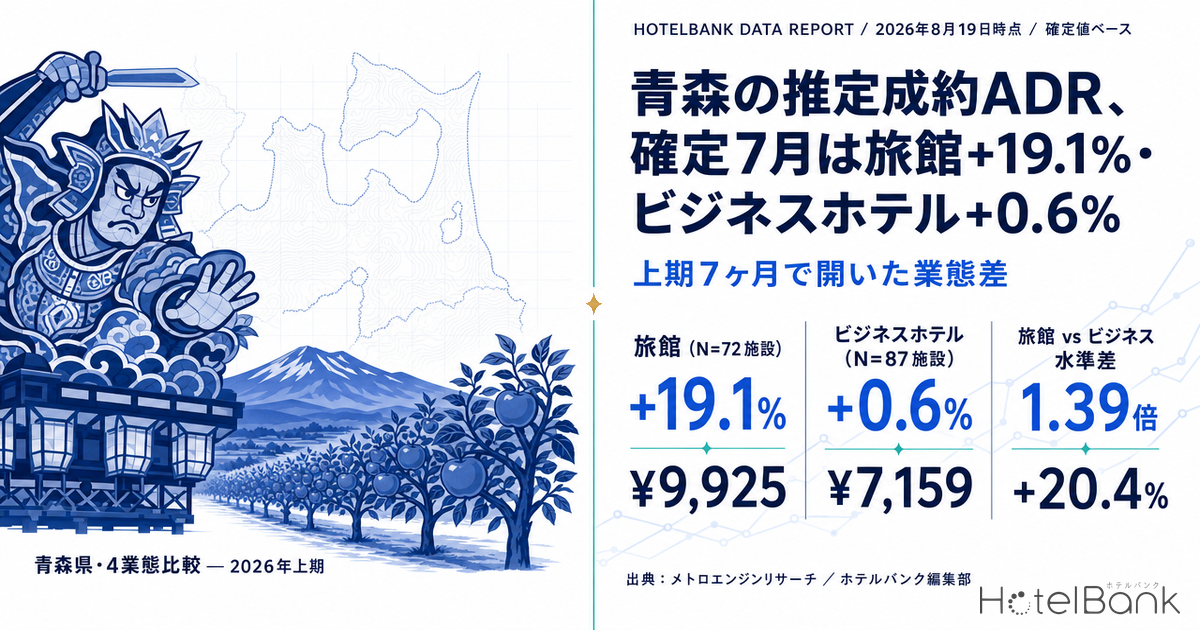
When Aomori Prefecture’s estimated settled ADR is broken out by property category and compared on a finalized-month to finalized-month basis, the first half of 2026 shows two opposite pictures inside the same prefecture. For the most recent month with finalized figures on both sides (July 2026), the year-on-year change was +19.1% for ryokan (¥8,330 → ¥9,925, N=72 properties), against +0.6% for business hotels (¥7,116 → ¥7,159, N=87 properties). City hotels came in at +5.9% (N=16 properties) and resort hotels at +12.8% (N=9 properties). The July gap between ryokan and business hotels widened from 1.17x a year earlier (a ¥1,214 difference) to 1.39x (a ¥2,766 difference). In the same market, in the same month, pricing outcomes diverged this far by category.
Scope: ryokan, resort hotels, business hotels and city hotels in Aomori Prefecture, N=9–87 properties (varies by category and month; stated alongside each figure). The price metric in this article is estimated settled ADR (the transacted price level estimated from OTA and other sales data, tax-excluded equivalent); occupancy is an estimate based on OTA-listed inventory. Both definitions appear at the end of this article. Data as of August 19, 2026.
- — Ryokan +19.1% — estimated settled ADR for July 2026 moved from ¥8,330 to ¥9,925 (N=72 properties). In the most recent month with finalized figures, this was the largest gain among the four categories.
- — Business hotels +0.6% — ¥7,116 → ¥7,159 (N=87 properties). Within the same prefecture and the same month, the range of growth rates spread more than thirtyfold, from +0.6% to +19.1%.
- — What rose was the floor, not the peak — for ryokan, even the weakest month of January–July 2026 (February, ¥9,419, N=70 properties) sat just below the strongest month of 2025, meaning the lower bound itself has been lifted.
- — The gap is on price, not occupancy — estimated OCC for July 2026 was 90.3% for ryokan, 94.9% for business hotels, 92.2% for city hotels and 94.6% for resort hotels. All four categories were in the 90s, so the spread in inventory sell-through is only a few points.
- — Four months of H2 span ¥11,682–¥12,845 — a four-month average for ryokan, calculated by applying the YoY range actually observed in H1 (+9.5% to +20.4%) to the finalized figures for August–November 2025.
In finalized July, Aomori’s four categories spread from +19.1% to +0.6%
First, the ground rules. Estimated settled ADR comes in two forms: finalized past months (history basis) and current or future months estimated from the present state of sales (forward basis). A year-on-year comparison is only valid for months that are finalized in both years. From August 2026 onward the figures are current-snapshot estimates, and comparing them directly with the prior year’s finalized values inflates the apparent growth rate. This section therefore uses only finalized values from January 2025 through July 2026.
The table below shows July 2026, the most recent month with finalized figures. What the four categories had in common was that all of them were positive; the spread, however, ran from +0.6% to +19.1% — a gap of more than thirtyfold.
| Category | July 2025 (finalized) | July 2026 (finalized) | YoY | Properties covered (prior year → this year) |
|---|---|---|---|---|
| Ryokan | ¥8,330 | ¥9,925 | +19.1% | 76→72 |
| Resort hotels | ¥17,870 | ¥20,149 | +12.8% | 10→9 |
| City hotels | ¥8,676 | ¥9,192 | +5.9% | 16→16 |
| Business hotels | ¥7,116 | ¥7,159 | +0.6% | 81→87 |
Source: Compiled by the HotelBank Editorial Team from MetroEngines Research data
Resort hotels cover only 10 properties in the prior year and 9 this year — small enough that a change in sales policy at one or two properties can move the prefecture-wide figure. Every mention of resort hotels below states the property count, and no categorical conclusions are drawn from it.
Viewing that single July snapshot as a trend from January 2026 makes the difference in character between the categories clear.
Source: Compiled by the HotelBank Editorial Team from MetroEngines Research data
Ryokan started from +40.6% in January and stayed positive in all seven months (a simple seven-month average of +20.4%). Business hotels were positive in five of the seven months but averaged only +3.4%, while city hotels averaged −2.3% — still in negative territory. Resort hotels averaged +5.6% but swung widely, from −8.8% to +27.8% (7–10 properties covered). How common this pattern of categories splitting in sign within a single prefecture is nationwide is laid out across all 47 prefectures in H1 2026 ADR YoY: 16 Prefectures Aligned, 31 Split Across 4 Categories.
The ryokan gain comes from the trough months, not the peak months
Lining up the monthly YoY figures for ryokan, the growth rate itself narrowed from +40.6% in January to +9.5% in June, then widened again to +19.1% in July. But more important than the rise and fall of the growth rate is where inside the year that growth is happening.
| Stay month (finalized vs finalized) | Ryokan | Resort hotels | City hotels | Business hotels |
|---|---|---|---|---|
| January 2026 | +40.6% | −7.3% | −3.2% | +14.6% |
| February 2026 | +16.3% | −8.8% | +6.5% | +3.5% |
| March 2026 | +23.7% | +12.0% | +0.8% | −2.7% |
| April 2026 | +18.3% | −7.6% | −17.9% | +6.1% |
| May 2026 | +15.4% | +27.8% | +3.6% | +3.6% |
| June 2026 | +9.5% | +10.5% | −11.5% | −2.2% |
| July 2026 | +19.1% | +12.8% | +5.9% | +0.6% |
| Seven-month simple average | +20.4% | +5.6% | −2.3% | +3.4% |
| Properties covered (2026) | 69–75 | 7–9 | 16 | 85–90 |
Source: Compiled by the HotelBank Editorial Team from MetroEngines Research data (months finalized in both years only)
Overlaying the ryokan price level itself year on year shows where the change is centred. Across January–July 2025, only April (¥10,135) exceeded ¥9,400 in estimated settled ADR. Across January–July 2026, by contrast, even the lowest month — February (¥9,419, N=70 properties) — sits in the ¥9,400s, so all seven months are at or above 2025’s second-best level. What rose was not the peak but the floor.
Source: Compiled by the HotelBank Editorial Team from MetroEngines Research data
Operationally this distinction matters. In a year when only peak rates rise, the annual gain is decided by a handful of busy dates, and low-season inventory stays priced exactly as it was the year before. In a year when the floor rises, the bottom price of the quiet months has itself been lifted, which changes the revenue structure across the whole year. What the finalized figures show in Aomori’s ryokan market is the second pattern.
Business hotels and city hotels have barely moved
Within the same prefecture, business hotels and city hotels tell a different story. The lowest month for business hotels in January–July 2026 was March at ¥5,807 (N=90 properties), almost identical to the lowest month of January–July 2025, which was January at ¥5,767 (N=81 properties). The low-season floor has hardly moved from the prior year. The highest month is much the same: ¥7,574 in April 2026 (N=90 properties) against ¥7,150 in May 2025 (N=82 properties), so the entire range has tracked sideways.
City hotels have a small base at N=16 properties and swing from month to month, but after double-digit declines in April (−17.9%) and June (−11.5%) they recovered to +5.9% in July. The seven-month average is −2.3%, meaning they have not yet fully returned to prior-year levels.
Source: Compiled by the HotelBank Editorial Team from MetroEngines Research data
What these two categories share is that the shape of their seasonality — which months run high and which run low — is almost identical to the prior year. When both the shape and the level match, the result looks close to pricing built on top of the previous year’s pricing. That stands in contrast to ryokan, which have lifted their floor.
Across the three northern Tohoku prefectures, Aomori is the market where only ryokan are strong
To check whether this category split is specific to Aomori or a northern Tohoku pattern, the finalized figures for the same month and the same categories in neighbouring Akita and Iwate are shown below.
| July 2026 (finalized) | Ryokan YoY (properties covered) | Business hotels YoY (properties covered) |
|---|---|---|
| Aomori | +19.1% (76→72) | +0.6% (81→87) |
| Akita | +3.5% (95→91) | +9.9% (57→59) |
| Iwate | −3.5% (140→142) | +4.1% (84→85) |
Source: Compiled by the HotelBank Editorial Team from MetroEngines Research data
Aomori is the only one of the three prefectures where ryokan posted double-digit growth; in Iwate they were negative. Conversely, in business hotels, Aomori’s +0.6% is the smallest of the three. This is not a simple picture of ryokan rising, or business hotels rising, across northern Tohoku — the strong category changes from prefecture to prefecture. Aomori’s ryokan gain reads less as a reflection of a wide-area trend than as a change that happened inside Aomori’s own ryokan market. How far each of the three prefectures is absorbing its new supply is examined in North Tohoku’s 2,079 New Rooms: Which Segments Can Absorb the Supply.
July estimated occupancy is high in all four categories — the gap shows up on price, not occupancy
To check what sits behind the rate gap, we looked at monthly average estimated OCC (OTA-listed-inventory basis) by category for the same month, July 2026. Ryokan came in at 90.3% (July 2026, 46–61 properties observed), business hotels at 94.9% (78–82 properties), city hotels at 92.2% (15–16 properties) and resort hotels at 94.6% (5–7 properties). All four categories sit in the 90s, and the spread between them stays within a few points.
In other words, there is no large step between the four categories in how far inventory is being sold through, while the YoY change in estimated settled ADR spreads from +0.6% to +19.1%. That reads less as a difference in remaining occupancy headroom than as a difference in how far each category carried the same demand environment through to rate. Note that estimated OCC here is the sell-through rate of OTA-listed inventory and is defined differently from actual room occupancy (see the definitions at the end of this article). No prior-year comparison is made for it.
H2 on a current-snapshot basis — October is the highest month in all four categories
From August 2026 onward the months are not yet finalized, and everything below is an estimate based on the current state of sales. Because these figures can move with future booking activity, no direct comparison with the prior year’s finalized values is made; only the relative height of each month is read.
| Stay month (current-snapshot estimate) | Ryokan | Resort hotels | City hotels | Business hotels |
|---|---|---|---|---|
| August 2026 | ¥13,725 (N=69) | ¥26,210 (N=9) | ¥14,062 (N=16) | ¥12,544 (N=86) |
| September 2026 | ¥13,818 (N=67) | ¥24,994 (N=9) | ¥14,914 (N=16) | ¥10,985 (N=83) |
| October 2026 | ¥15,363 (N=61) | ¥31,874 (N=8) | ¥17,220 (N=16) | ¥13,180 (N=77) |
| November 2026 | ¥12,693 (N=55) | ¥23,180 (N=8) | ¥11,058 (N=16) | ¥9,344 (N=76) |
Source: Compiled by the HotelBank Editorial Team from MetroEngines Research data (August 2026 onward are estimates based on the current state of sales)
October is the highest month in all four categories. In Aomori, the main competition period of the 80th National Sports Games — “Ao no Kirameki Aomori Kokusupo & Shosupo” — is scheduled for October 10 (Sat) to October 20 (Tue), 2026, followed by the National Sports Games for Persons with Disabilities from October 23 to 26 (official event site). The fact that a large-scale event held in the prefecture for the first time in 49 years is concentrated in October is context worth holding onto when reading that month’s relative height. How prices and inventory are moving in each host municipality is broken down at the municipal level in Aomori’s First National Sports Games in 49 Years: Prices and Inventory. Note, though, that the table above reflects the current state of sales and is an estimate, not a finalized figure. Ryokan coverage also declines as the months progress, from 69 properties to 55, so differences in property mix can affect the numbers.
How far could H2 swing — three scenarios built only from finalized values, plus a YoY × base-month sensitivity table
So far, finalized values and current-snapshot estimates have been kept apart. So how far can the H2 level move on the strength of a single YoY assumption? The range below introduces no new assumptions: it simply applies the YoY range actually observed in January–July 2026 to the finalized values for August–November 2025. The subject is ryokan, the category with the largest gain (N=55–79 properties); December 2026 is excluded because property coverage falls away.
| Scenario | Assumption applied | Aug | Sep | Oct | Nov | Four-month average |
|---|---|---|---|---|---|---|
| Pessimistic | The smallest gain seen in H1 (+9.5%, June 2026) continues through August–November | ¥12,323 | ¥10,041 | ¥11,379 | ¥12,985 | ¥11,682 |
| Mid | The average gain of the most recent three months (May–July 2026, +14.7%) continues | ¥12,908 | ¥10,518 | ¥11,920 | ¥13,601 | ¥12,237 |
| Optimistic | The seven-month H1 average gain (+20.4%) is sustained through H2 | ¥13,550 | ¥11,041 | ¥12,512 | ¥14,277 | ¥12,845 |
The finalized values for August–November 2025 are ¥11,254 (Aug), ¥9,170 (Sep), ¥10,392 (Oct) and ¥11,858 (Nov) — a four-month average of ¥10,669, N=72–76 properties. All three rows are YoY rates actually observed between January and July 2026; no new demand forecast has been introduced. Source: Compiled by the HotelBank Editorial Team from MetroEngines Research data
The four-month average spans ¥11,682 to ¥12,845. The only difference between the ends of that range is whether you extend the seven-month H1 average gain (+20.4%) or assume that June’s weakest reading (+9.5%) persists — and that alone moves the four-month average by about ¥1,160. Rather than trying to pick which is right, the practical step is to first check where your own property’s H2 plan sits within that band.
| YoY assumption | Aug | Sep | Oct | Nov | Four-month average |
|---|---|---|---|---|---|
| +9.5% | ¥12,323 | ¥10,041 | ¥11,379 | ¥12,985 | ¥11,682 |
| +14.7% | ¥12,908 | ¥10,518 | ¥11,920 | ¥13,601 | ¥12,237 |
| +20.4% | ¥13,550 | ¥11,041 | ¥12,512 | ¥14,277 | ¥12,845 |
| +30.0% | ¥14,630 | ¥11,921 | ¥13,510 | ¥15,415 | ¥13,869 |
| +40.6% | ¥15,823 | ¥12,893 | ¥14,611 | ¥16,672 | ¥15,000 |
Both ends of the vertical axis (+9.5% and +40.6%) are YoY rates actually observed in 2026, and the shaded rows mark those two ends. +14.7% is the May–July 2026 average and +20.4% the January–July average. Source: Compiled by the HotelBank Editorial Team from MetroEngines Research data
Read across the rows and the level differences between base months survive intact, even when the same YoY rate is applied. The ¥2,688 gap between September 2025 (¥9,170) and November 2025 (¥11,858) is the same order of magnitude as the swing in a single month of August when the vertical axis is moved from +9.5% to +40.6% (¥15,823 − ¥12,323 = ¥3,500). Deciding an entire H2 repricing on one YoY number loses that month-by-month level difference. In Aomori’s case, with the main competition period of a large-scale event falling in October, keeping the vertical axis (the growth assumption) and the horizontal axis (the month’s level) separate carries real operational weight.
Note that Tables 5 and 6 are built only from finalized values (months finalized in both the prior year and this year). The H2 table shown earlier is an estimate based on the current state of sales and is calculated on a different basis, so the two cannot be placed on the same measuring stick. Tables 5 and 6 show how far H2 could swing when viewed through finalized values; they are not a forecast.
For revenue managers running ryokan and hotels in Aomori — implications and an action plan
(1) Identify which market your own category belongs to first. Taken as a single prefecture, Aomori’s finalized July 2026 figures scatter from +0.6% to +19.1%. Using a prefecture-wide or “Tohoku” average as your benchmark risks giving ryokan a bar set below the market and business hotels one set above it. Start by fixing your own category column as your yardstick: ryokan ¥9,925 / resort hotels ¥20,149 / city hotels ¥9,192 / business hotels ¥7,159, all finalized for July 2026.
(2) Verify for your own property whether the gain is happening in the trough months. For Aomori’s ryokan, the lowest month of January–July 2026 (February, ¥9,419) matched close to the highest level of H1 2025. Separating, in your own monthly results, whether only the peak months rose or the floor of the quiet months rose as well will change how you build next year’s budget. If the floor has not moved, the question is not peak-day pricing but a review of the minimum rate on low-demand days.
(3) Read the growth-rate spread on the premise that there is little occupancy headroom. Estimated OCC in July 2026 was in the 90s for all four categories. This is not a situation with a lot of occupancy upside left, so the main variable moving revenue in that month sits on the rate side. It is worth checking, month by month for your own property, how much opportunity is being passed up by holding rates to protect occupancy.
(4) Do not design October as “business as usual.” On a current-snapshot basis, October is the highest month in all four categories. With a large-scale event’s main competition period scheduled for October 10–20 and a following event for October 23–26, treating October on the same calendar as ordinary autumn demand risks entering the selling window with demand days and normal days still blurred together.
| Time horizon | Action | Decision trigger (figures from this article) | Purpose |
|---|---|---|---|
| Today to this week | Compare your own July 2026 results against the finalized figure for your own category | Ryokan ¥9,925 / resort ¥20,149 / city ¥9,192 / business ¥7,159 (July 2026 finalized) | Locate your property against a category benchmark rather than a prefecture average |
| Today to this week | Audit your October settings, split between the main competition period (Oct 10–20), the following event period (Oct 23–26) and normal days | On a current-snapshot basis, October is the highest month in all four categories | Avoid entering the selling window with demand days and normal days on identical settings |
| Within two weeks | Line up your lowest monthly rate (the trough month) against the same month last year and judge whether the floor has moved | Aomori ryokan lifted their lowest month to ¥9,419 (February 2026, N=70 properties) | Separate peak-weighted growth from floor-lifting growth |
| Within two weeks | Extract the months where occupancy is running high and check whether any hold-the-rate settings remain | Estimated OCC in July 2026: ryokan 90.3%, business 94.9%, city 92.2%, resort 94.6% | Make rate decisions explicit in months with little occupancy headroom |
| Looking to next month | Rebuild the H2 budget base on the finalized trend by category rather than sliding last year’s results forward | Seven-month averages: ryokan +20.4%, business +3.4%, city −2.3% | Reflect in the budget that the assumed growth rate differs by category |
| Looking to next month | Set an operating rule that current-snapshot months are re-verified once they are finalized | August 2026 onward is a current-snapshot estimate (wait for month-end finalization before comparing directly with finalized values) | Prevent decisions that confuse estimates with finalized figures |
Source: Compiled by the HotelBank Editorial Team from MetroEngines Research data
Summary — three yardsticks to take away from Aomori’s first half
Yardstick 1: look at category, not prefecture. The finalized July 2026 figures place ryokan at +19.1% (N=72 properties) and business hotels at +0.6% (N=87 properties) side by side inside the same prefecture. A prefecture average does not function as a benchmark for an individual property.
Yardstick 2: separate the content of the growth into “peak or floor.” All seven H1 months for Aomori’s ryokan landed in 2025’s high band, and even the lowest month was ¥9,419. If what rose is the floor, the revenue structure of the year itself has changed.
Yardstick 3: do not mix estimates with finalized values. From August 2026 onward the figures are current-snapshot estimates, and setting them beside the prior year’s finalized values makes growth look larger than it is. Confine YoY discussion to finalized months, and limit estimated months to reading the relative height of one month against another.
About the data
• Definition of estimated OCC (OTA-listed-inventory basis): OTA-listed-inventory occupancy = 100 − 100 × rooms still listed on OTAs ÷ total rooms. It is an estimate based on how far inventory offered for sale on OTAs has been sold through, and is defined differently from actual room occupancy (it reads higher). The estimated OCC used in this article is the monthly average for July 2026 (31 days), and no prior-year comparison is made.
• Definition of estimated settled ADR: the transacted price level (tax-excluded equivalent) estimated from OTA and other sales data (lowest-plan level × category coefficient, ensembled across multiple channels). Past months are finalized values; current and future months are estimates based on the current state of sales. Against published operating results, the median error is 6.6%. Year-on-year changes are calculated only for months finalized in both years.
• Breakdown of N=: Aomori Prefecture — ryokan N=55–79 properties (N=72 for finalized July 2026), resort hotels N=7–10 properties (N=9 for the same month), city hotels N=16 properties, business hotels N=76–90 properties (N=87 for the same month). Comparison prefectures: Akita — ryokan N=91–95 properties, business hotels N=57–59 properties; Iwate — ryokan N=140–142 properties, business hotels N=84–85 properties. December 2026 is excluded from this article’s aggregation because property coverage drops sharply in some categories.
• Category classification follows the property attribute master (ryokan / resort hotel / business hotel / city hotel).
• Data as of August 19, 2026. Sales activity and inventory change daily, so the figures in this article are a snapshot at the time of retrieval.
■ Data sources
Estimated settled ADR was retrieved as monthly aggregates by category for Aomori Prefecture (ryokan, resort hotels, business hotels, city hotels) covering January 2025 through December 2026, with only months finalized in both the prior year and this year used for year-on-year comparison. The comparison prefectures, Akita and Iwate, were retrieved on the same monthly basis for June 2025 through July 2026. Estimated OCC comes from daily observations for Aomori Prefecture (July 2026, 31 days). The competition periods for the National Sports Games and the National Sports Games for Persons with Disabilities were confirmed against the official event site and materials published by the Japan Association of Athletics Federations. All figures are aggregated data from MetroEngines Research & Consulting.
■ Calculation assumptions
The three scenarios in Table 5 and the sensitivity grid in Table 6 are arithmetic exercises applying the year-on-year rates actually observed between January and July 2026 (+9.5% to +40.6%) to the finalized values for August–November 2025. Pessimistic uses the smallest H1 figure, +9.5% (June 2026); mid uses the three-month average for May–July 2026, +14.7%; optimistic uses the seven-month H1 average, +20.4%. December 2026, where property coverage falls sharply, is excluded from every aggregation. No new demand forecasting model or external assumption has been introduced.
■ Limitations and caveats
Resort hotels (N=7–10 properties) and city hotels (N=16 properties) have thin populations, and a double-digit move in a single month can arise from pricing changes at a handful of properties. Ryokan coverage declines as the months progress (N=55 properties in November 2026), so changes in the average include the effect of shifts in property mix. Estimated OCC is an estimate based on the sell-through of OTA-listed inventory and reads higher than actual room occupancy. Months from August 2026 onward are estimates based on the current state of sales and are calculated on a different basis from finalized values, so no direct comparison with the prior year’s finalized figures is made. Tables 5 and 6 apply an already-observed range rather than forecasting, and actual levels may fall outside that band.
References and sources
• Ao no Kirameki Aomori Kokusupo & Shosupo (80th National Sports Games / 25th National Sports Games for Persons with Disabilities) — event outline and competition schedule — https://aomorikokuspo2026.pref.aomori.lg.jp/kokuspo/outline/
• Japan Association of Athletics Federations, “80th National Sports Games” — https://www.jaaf.or.jp/competition/detail/2065/
Related Reading
- Aomori’s First National Sports Games in 49 Years: Prices and Inventory
- Aomori Nebuta 2026: 97.4% Sold 45 Days Out, Post-Festival +14pt
- North Tohoku’s 2,079 New Rooms: Which Segments Can Absorb the Supply
- H1 2026 ADR YoY: 16 Prefectures Aligned, 31 Split Across 4 Categories
- Yamaguchi Settled ADR H1 2026: Business +3.4%, City Hotels −6.4%
- Fukushima Settled ADR: Ryokan +4.5%, Resort +4.7%, but −6.9% vs 2024
- Kanagawa ADR Splits: City Hotels +20.9%, Business −1.7% in June 2026
- Iwate Hotel Market 2026: 2.2x ADR Gap, Morioka ¥200 Lodging Tax