

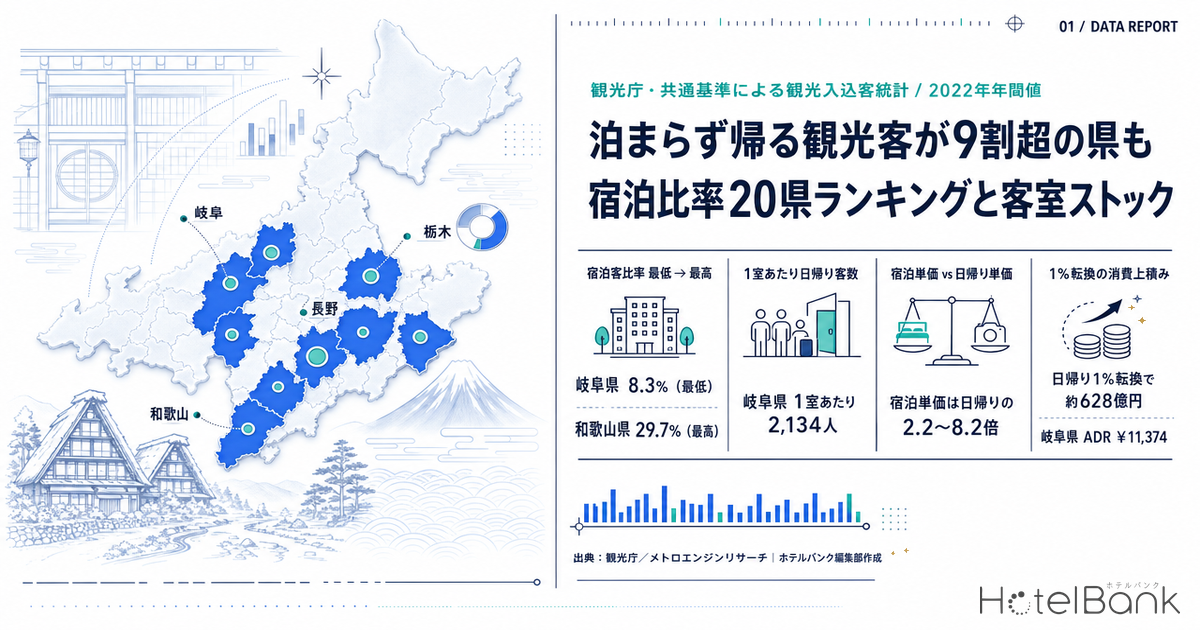
The pulling power of a tourist destination is usually described by how many people came. For an accommodation operator, however, what matters is what share of those visitors actually stayed the night. The Japan Tourism Agency’s Common Standard Survey on Tourist Visits is one of the few official statistics that separates overnight visitors from day-trippers at the prefectural level. This article calculates the overnight-visitor share from the last year of that survey for which a nationwide side-by-side comparison is possible (calendar 2022, 20 prefectures compiled), overlays it with the room stock tracked by MetroEngines Research, and identifies the areas with the greatest potential to convert day-trippers into overnight guests.
Metric Definitions Used in This Article
- Overnight-visitor share: calculated as overnight visitors ÷ (overnight visitors + day-trippers), using the visitor counts (actual basis, thousands of visits) in the Japan Tourism Agency’s Common Standard Survey on Tourist Visits. In-prefecture and out-of-prefecture visitors are combined.
- Tourism spend per visit: tourism expenditure per visit from the same survey. For overnight and day-trip visitors respectively, in-prefecture and out-of-prefecture figures are weighted by visitor count.
- ADR (average daily rate): an estimated transacted rate (tax-excluded equivalent), derived by applying category-specific adjustment coefficients to the lowest published plan level each property lists on online travel agencies (two guests per room, per-room price, tax included). Cross-checked against property-level results disclosed by listed hotel REITs (N=184 property-months, April-May 2026), the median error is 7.5% (6.0% for business hotels and city hotels). These are estimates and differ from each property’s actual transacted prices and accounting figures. Area-level ADR is the median of the properties covered (the level of a typical property in that area). This article uses the 12-month average for June 2025 to May 2026.
- Room stock: the total number of rooms at properties tracked by MetroEngines Research whose operation can be confirmed. Ryokan, minshuku and simple lodging houses not listed on online travel agencies are excluded; this is not a complete census.
- Data sources: Japan Tourism Agency, Common Standard Survey on Tourist Visits / individual prefectural publications / MetroEngines Research
- — Using the last year for which a nationwide side-by-side comparison is possible (calendar 2022, 20 prefectures compiled), overnight-visitor shares range 3.6-fold, from a low of 8.3% in Gifu to a high of 29.7% in Wakayama. The median across the 20 prefectures is 14.0%.
- — Day-trippers per existing room peak at 2,134 in Gifu, 4.4 times the lowest figure of 484 in Nagano. The density of latent demand passing right by existing rooms varies enormously by prefecture.
- — Overnight visitors spend 2.2 to 8.2 times as much per visit as day-trippers. If just 1% of day-trippers converted to a single overnight stay, the arithmetic adds roughly ¥62.8bn of annual spending across the 20 prefectures.
- — In Gifu’s latest 2024 figures, overnight guests — just 16.6% of visitors — generate 65.1% of tourism spending (in Gunma the overnight share of spending is 68.1%).
- — Prefectural averages mask municipal mismatches. In Gifu, most of the ten busiest visitor sites sit in the Mino and Seino regions, while 41.8% of rooms are concentrated in Takayama and Gero in the Hida region.
The Last Year Comparable Nationwide — Where the Common Standard Survey Stands Now
The Common Standard Survey on Tourist Visits is a survey standard established in December 2009 to harmonise tourism statistics whose definitions had varied from prefecture to prefecture. Its purpose is to eliminate differences such as fiscal-year versus calendar-year aggregation and headcount versus person-nights, so that regions can be compared; 46 prefectures now use it (Osaka is the sole exception).
One change in how the data is published needs to be understood before using it. The Japan Tourism Agency’s nationwide compilation ended with the March 2024 release (agency website, last updated 20 August 2024), and results since then have moved to individual publication on each prefecture’s own website. The last dataset in which the whole country appears in a single table is the calendar 2022 annual figures (20 of the 46 prefectures compiled, updated 29 March 2024).
The cross-prefecture comparison in this article therefore rests on that 2022 snapshot. In 2022 the COVID-19 pandemic still weighed heavily on accommodation demand, so overnight-visitor shares read lower than they do today — a point worth keeping in mind. We test that later against the latest 2024 figures each prefecture has published independently. In addition, because the common standard leaves the choice of survey points to each prefecture, the rankings should be read as structural tendencies rather than treated as definitive positions.
Overnight-Share Ranking — A 3.6-Fold Spread, From 8.3% to 29.7%
Across the 20 compiled prefectures, the lowest overnight-visitor share is 8.3% in Gifu and the highest is 29.7% in Wakayama — a 3.6-fold spread. The median of the 20 is 14.0%. In other words, in a typical prefecture only about one in seven people who visit a tourist site stays overnight within it.
Source: Japan Tourism Agency, Common Standard Survey on Tourist Visits (calendar 2022, 20 prefectures compiled); compiled by the HotelBank Editorial Team
At the bottom sit Gifu (8.3%), Akita (9.5%), Yamaguchi (10.2%) and Miyagi (11.1%). At the top are Wakayama (29.7%), Nagano (27.1%), Oita (26.2%) and Yamanashi (21.8%). The upper group is made up of prefectures containing destinations designed for extended stays in the first place — Shirahama, Yufuin, Karuizawa, the Fuji Five Lakes. The lower group, by contrast, is dominated by prefectures within day-trip range of major metropolitan areas whose tourist sites are also spread thinly over a wide area.
| Prefecture | Total visits (thousands) |
Overnight (thousands) |
Day-trip (thousands) |
Overnight share | Properties | Rooms | Day-trippers per room |
ADR |
|---|---|---|---|---|---|---|---|---|
| Gifu | 40,481 | 3,340 | 37,142 | 8.3% | 571 | 17,408 | 2,134 | ¥11,374 |
| Akita | 11,903 | 1,133 | 10,770 | 9.5% | 238 | 10,839 | 994 | ¥7,941 |
| Yamaguchi | 14,044 | 1,437 | 12,607 | 10.2% | 222 | 12,764 | 988 | ¥7,639 |
| Miyagi | 29,011 | 3,208 | 25,803 | 11.1% | 389 | 27,547 | 937 | ¥9,272 |
| Tokushima | 8,223 | 920 | 7,302 | 11.2% | 194 | 6,406 | 1,140 | ¥6,384 |
| Yamagata | 15,159 | 1,762 | 13,397 | 11.6% | 389 | 13,906 | 963 | ¥9,669 |
| Okayama | 12,232 | 1,505 | 10,727 | 12.3% | 277 | 14,951 | 717 | ¥8,414 |
| Kumamoto | 22,355 | 2,821 | 19,534 | 12.6% | 476 | 18,377 | 1,063 | ¥10,712 |
| Aomori | 10,738 | 1,380 | 9,358 | 12.8% | 240 | 14,426 | 649 | ¥7,829 |
| Fukushima | 22,410 | 3,032 | 19,378 | 13.5% | 604 | 24,673 | 785 | ¥7,527 |
| Fukui | 11,303 | 1,622 | 9,681 | 14.4% | 312 | 9,096 | 1,064 | ¥11,605 |
| Gunma | 32,022 | 5,044 | 26,979 | 15.8% | 676 | 20,514 | 1,315 | ¥12,147 |
| Tochigi | 43,235 | 6,897 | 36,338 | 16.0% | 572 | 20,406 | 1,781 | ¥10,722 |
| Kagawa | 6,692 | 1,069 | 5,623 | 16.0% | 242 | 10,870 | 517 | ¥8,205 |
| Iwate | 12,128 | 2,022 | 10,106 | 16.7% | 354 | 16,320 | 619 | ¥7,225 |
| Ehime | 12,925 | 2,264 | 10,662 | 17.5% | 267 | 13,223 | 806 | ¥6,958 |
| Yamanashi | 24,179 | 5,259 | 18,920 | 21.8% | 722 | 16,911 | 1,119 | ¥11,843 |
| Oita | 12,463 | 3,266 | 9,198 | 26.2% | 580 | 17,768 | 518 | ¥15,094 |
| Nagano | 30,038 | 8,138 | 21,900 | 27.1% | 1,891 | 45,283 | 484 | ¥12,110 |
| Wakayama | 8,675 | 2,580 | 6,095 | 29.7% | 396 | 11,732 | 520 | ¥9,803 |
Source: Japan Tourism Agency, Common Standard Survey on Tourist Visits (calendar 2022) / MetroEngines Research (property and room counts on a confirmed-operating basis; ADR is the 12-month average for June 2025 to May 2026); compiled by the HotelBank Editorial Team
Overlaying Visitor Volume and Overnight Share — Where the Crowds Come but Do Not Stay
A low overnight-visitor share does not by itself mean large conversion headroom. If the share is low but visitor volume is small, the base available for conversion is limited too. So we plot total visits on the horizontal axis, overnight-visitor share on the vertical axis, and size each bubble by room stock.
Source: Japan Tourism Agency, Common Standard Survey on Tourist Visits (calendar 2022) / MetroEngines Research (room counts); compiled by the HotelBank Editorial Team
The lower-right quadrant — high visitor volume, low overnight share — contains Gifu (40.48 million total visits, 8.3%) and Tochigi (43.24 million, 16.0%). Both stand out for visitor volume among the 20, yet Gifu’s conversion to overnight stays sits far below the median and Tochigi’s only about two points above it. Miyagi (29.01 million, 11.1%) and Gunma (32.02 million, 15.8%) share the same character.
Nagano is the contrast: 30.04 million total visits with a 27.1% overnight share, high on both volume and conversion to stays. Its room stock is the largest of the 20 at 45,283 rooms across 1,891 properties, and the depth of that capacity appears to underpin the conversion.
Day-Trippers per Room — Measuring Conversion Headroom as Density
To collapse visitor volume and supply into a single metric, we calculated day-trippers ÷ rooms. It is a density measure of how many day-trippers pass in front of each existing room over a year. The higher the value, the greater the impact a small improvement in conversion would have on room occupancy.
Source: Japan Tourism Agency, Common Standard Survey on Tourist Visits (calendar 2022) / MetroEngines Research (room counts on a confirmed-operating basis, N=20 prefectures); compiled by the HotelBank Editorial Team
The highest is Gifu at 2,134 per room, well clear of second-placed Tochigi (1,781). Then come Gunma at 1,315, Tokushima at 1,140, Yamanashi at 1,119, Fukui at 1,064 and Kumamoto at 1,063. The lowest is Nagano at 484, a 4.4-fold gap versus Gifu.
The metric needs careful reading. A low value does not mean weak drawing power; it means visitors are already converting into stays, or that room stock has been built out in proportion to visitor volume. A high value means a large pool of latent demand sits within easy reach of existing rooms, leaving substantial headroom per room. For the equivalent density metric with overnight guests in the numerator, we set out the nationwide picture in June 2026 Occupancy 56.2%: Guest-Nights per Room in 47 Prefectures.
How Much More Overnight Guests Spend — The Economic Impact of One Extra Night
Another strength of the common standard survey is that it breaks tourism spend per visit into overnight and day-trip categories. Across the 20 prefectures, overnight visitors spend 2.2 to 8.2 times as much per visit as day-trippers.
Source: Japan Tourism Agency, Common Standard Survey on Tourist Visits (calendar 2022, 20 prefectures compiled); compiled by the HotelBank Editorial Team
The largest multiple is Oita at 8.2x, followed by Ehime (7.2x), Gifu (6.7x) and Yamagata (6.3x). The smallest are Tokushima (2.2x), Gunma (2.5x) and Nagano (3.0x) — but these are prefectures where day-trip spend per visit is itself high, suggesting the day-trip experience is designed to involve spending.
Using that spending gap, we estimated the increase in in-prefecture tourism spending if just 1% of day-trippers converted to a single overnight stay. It is a simple calculation: 1% of day-trippers multiplied by the difference between overnight and day-trip spend per visit.
| Prefecture | Overnight spend/visit | Day-trip spend/visit | Multiple | Spending increase at 1% conversion (annual) |
|---|---|---|---|---|
| Gifu | ¥24,015 | ¥3,574 | 6.7x | ¥7.59bn |
| Akita | ¥24,264 | ¥4,121 | 5.9x | ¥2.17bn |
| Yamaguchi | ¥18,308 | ¥3,461 | 5.3x | ¥1.87bn |
| Miyagi | ¥21,263 | ¥5,490 | 3.9x | ¥4.07bn |
| Tokushima | ¥23,323 | ¥10,578 | 2.2x | ¥0.93bn |
| Yamagata | ¥26,935 | ¥4,262 | 6.3x | ¥3.04bn |
| Okayama | ¥24,167 | ¥4,361 | 5.5x | ¥2.12bn |
| Kumamoto | ¥35,537 | ¥7,189 | 4.9x | ¥5.54bn |
| Aomori | ¥28,300 | ¥4,669 | 6.1x | ¥2.21bn |
| Fukushima | ¥22,005 | ¥3,766 | 5.8x | ¥3.53bn |
| Fukui | ¥19,245 | ¥4,751 | 4.1x | ¥1.4bn |
| Gunma | ¥16,913 | ¥6,687 | 2.5x | ¥2.76bn |
| Tochigi | ¥33,569 | ¥8,326 | 4.0x | ¥9.17bn |
| Kagawa | ¥27,934 | ¥5,893 | 4.7x | ¥1.24bn |
| Iwate | ¥23,727 | ¥4,478 | 5.3x | ¥1.95bn |
| Ehime | ¥19,468 | ¥2,722 | 7.2x | ¥1.79bn |
| Yamanashi | ¥22,499 | ¥5,385 | 4.2x | ¥3.24bn |
| Oita | ¥25,632 | ¥3,117 | 8.2x | ¥2.07bn |
| Nagano | ¥30,434 | ¥10,247 | 3.0x | ¥4.42bn |
| Wakayama | ¥32,777 | ¥5,633 | 5.8x | ¥1.65bn |
Source: estimated by the HotelBank Editorial Team from the Japan Tourism Agency, Common Standard Survey on Tourist Visits (calendar 2022). The increase on conversion is the simple calculation “day-trippers × 1% × (overnight spend − day-trip spend)” and does not guarantee any actual change in spending behaviour
Day-trippers across the 20 prefectures total 321,520 thousand visits. If just 1% of them — about 3.22 million visits — stayed one night, the arithmetic adds roughly ¥62.8bn of annual tourism spending. By prefecture the largest are Tochigi at ¥9.17bn, Gifu at ¥7.59bn, Kumamoto at ¥5.54bn and Nagano at ¥4.42bn.
Gifu’s Latest 2024 Figures — The Structure Persists, and 65% of Spending Comes From Overnight Guests
To check whether the 2022 snapshot still holds, we looked at the latest published figures for Gifu, the prefecture with the lowest overnight share. According to the FY2024 Gifu Prefecture Tourist Visitor Survey released by the prefecture on 22 December 2025, tourist visitors in 2024 numbered 44.698 million on an actual-headcount basis. Of those, 37.282 million (83.4%) were day-trippers and 7.416 million (16.6%) stayed overnight.
The overnight share doubled from 8.3% in 2022 to 16.6%, a clear sign of post-pandemic recovery. Day-tripper numbers themselves, however, were broadly flat — 37.14 million visits in 2022 against 37.28 million in 2024 — so the absolute volume of day-trippers did not fall; overnight visitors were added on top. The day-trip-dominant structure remains intact.
What stands out is how that spending is distributed. Tourism spending in 2024 hit a record ¥401.273bn, of which overnight visitors accounted for ¥261.183bn (65.1% of the total) and day-trippers ¥140.090bn (34.9%). Average spend per person was ¥3,758 for day-trippers versus ¥35,219 for overnight guests, a gap that widened to 9.4 times. In other words, 16.6% of visitors generate 65.1% of the spending.
The same pattern shows up in Gunma. Its FY2024 (2024) Tourist Visitor Survey Report puts 2024 tourism spending at ¥280.9bn, of which overnight visitors accounted for ¥191.4bn, or 68.1%; spend per visit was ¥23,506 for overnight guests against ¥3,058 for day-trippers, a 7.7-fold gap. The scale of the local-economy effect from converting visitors into overnight guests is unchanged in the latest year of data.
The Geographic Mismatch Between Visitor Sites and Room Stock — Tested Across Ten Sites in Gifu
So where within Gifu does the conversion headroom actually sit? Overlaying the prefecture’s published top ten visitor sites for 2024 with the room stock MetroEngines Research tracks in those municipalities reveals a clear geographic mismatch.
Source: Gifu Prefecture, FY2024 Gifu Prefecture Tourist Visitor Survey (visits by tourist site) / MetroEngines Research (rooms by municipality, confirmed-operating basis); compiled by the HotelBank Editorial Team
The top ten sites drew 23.37 million visitors in total. Only two of them are in the Hida region — the Takayama city-centre area (3.87 million) and the Shirakawa-go gassho-style village (2.00 million) — together 5.87 million, or 25.1% of the total. The remaining eight are concentrated in the Mino and Seino regions.
Room stock is distributed in exactly the opposite way. Of Gifu’s 17,408 rooms across 571 properties, Takayama holds 5,233 rooms (216 properties) and Gero 2,041 rooms (64 properties) — 41.8% of the prefecture between just those two cities. By contrast, Toki, home to the top-ranked Toki Premium Outlets, has 239 rooms across nine properties, and Kakamigahara, home to the second-ranked Kasen Kankyo Rakuen river park, has 499 rooms across ten. Kaizu, which hosts the Chiyobo Inari Shrine and Senbonmatsubara sites drawing 2.39 million visitors a year, has 21 rooms at a single property.
| Municipality | Properties | Rooms | Share of prefecture | ADR | Top-10 visitor site |
|---|---|---|---|---|---|
| Takayama | 216 | 5,233 | 30.1% | ¥17,500 | Takayama city centre (3.87m) |
| Gifu City | 44 | 3,002 | 17.2% | ¥8,200 | Inaba Shrine, Gifu Park and others (4.22m) |
| Gero | 64 | 2,041 | 11.7% | ¥18,300 | — |
| Gujo | 68 | 935 | 5.4% | ¥9,600 | — |
| Kakamigahara | 10 | 499 | 2.9% | — | Kasen Kankyo Rakuen (4.45m) |
| Kani | 3 | 285 | 1.6% | — | Yunohana Island (1.67m) |
| Toki | 9 | 239 | 1.4% | ¥10,800 | Toki Premium Outlets (4.77m) |
| Shirakawa | 14 | 100 | 0.6% | ¥17,800 | Shirakawa-go Gassho Village (2.00m) |
| Kaizu | 1 | 21 | 0.1% | — | Chiyobo Inari Shrine / Senbonmatsubara (2.39m) |
Source: MetroEngines Research (property and room counts on a confirmed-operating basis; ADR is not calculated for municipalities with too few listed properties) / Gifu Prefecture, FY2024 Gifu Prefecture Tourist Visitor Survey; compiled by the HotelBank Editorial Team
The five municipalities shaded in blue absorb 15.28 million visits a year across a combined 1,144 rooms at 37 properties — a density of roughly 13,400 people passing per room per year. Four of them (Kakamigahara, Kani, Toki and Kaizu; 1,044 rooms and 13.28 million visits combined) lie within an hour’s drive of central Nagoya, which makes the day trip the rational choice. Generating overnight demand there depends on evening content that extends dwell time and on itineraries that carry into the next day, so this is not a case where simply adding rooms drives conversion.
Even so, given that overnight spend in Gifu runs 9.4 times day-trip spend, the municipalities in this density band are where the potential for overnight conversion is most concentrated.
Where Capacity Is Being Added — New Supply Over the Past Three Years
How is the supply side responding to that conversion potential? We compiled newly opened properties whose online-travel-agency listings MetroEngines Research could confirm between 2024 and 2026.
| Prefecture | Overnight share | Existing rooms | New openings (2024-26) |
New rooms | vs existing |
|---|---|---|---|---|---|
| Gifu | 8.3% | 17,408 | 82 properties | 1,623 | 9.3% |
| Akita | 9.5% | 10,839 | 29 properties | 1,171 | 10.8% |
| Yamaguchi | 10.2% | 12,764 | 54 properties | 1,613 | 12.6% |
| Miyagi | 11.1% | 27,547 | 95 properties | 1,463 | 5.3% |
| Gunma | 15.8% | 20,514 | 106 properties | 1,739 | 8.5% |
| Tochigi | 16.0% | 20,406 | 127 properties | 2,430 | 11.9% |
Source: MetroEngines Research (confirmed online-listing basis). Because listings appear several months before opening, counts for the most recent months may rise as further listings appear
Each prefecture has its own supply signature. Among Gifu’s 1,623 new rooms, the larger projects are mostly business hotels along trunk roads and in front of stations in the Mino region — Gifu City, Ginan and Nakatsugawa — while Hida-Takayama gained two hotels of around 150 rooms each. It reads as accommodation capacity beginning to appear in areas of high day-trip density.
Tochigi leads the six prefectures with 127 properties and 2,430 rooms. Utsunomiya took several projects of more than 200 rooms, and an 180-room property was added in front of Nasu-Shiobara Station. What distinguishes Tochigi is that supply is accumulating on the urban side, in Utsunomiya, on top of the northern resort areas (Nasu 2,590 rooms, Nasu-Shiobara 2,600, Nikko 5,450). In Gunma, too, projects of more than 100 rooms cluster in the central urban belt of Maebashi, Takasaki and Ota, with one roughly 100-room property added on the resort side in Kusatsu.
On rates, there is a clear hierarchy between resort areas and cities. In Gifu, Takayama runs at ¥17,500, Gero ¥18,300 and Shirakawa ¥17,800, against ¥8,200 in Gifu City and ¥7,000 in Ogaki. In Tochigi, Nasu is ¥20,400 and Nikko ¥18,500, against ¥7,400 in Utsunomiya. In Gunma, Minakami is ¥18,400, Kusatsu ¥18,000 and Shibukawa ¥17,200, against ¥7,500 in Maebashi and ¥7,300 in Takasaki. The rate band in the lowland and urban areas where day-trippers concentrate sits at roughly 40% of the resort level. It is this price band that would carry most of any day-trip-to-overnight conversion, and it is also where headroom on rate remains.
What Happens If the 1% Conversion Moves — Three Cases and a Sensitivity Grid
The estimate above rests on a single assumption: that 1% of day-trippers stay one night. Here we test how far the conclusion moves when that assumption changes, using only the measured values already presented in this article. No new estimates or extrapolations are introduced; this is a rearrangement and re-aggregation of the definitions already stated.
First, three cases. For the four prefectures with the lowest overnight shares, we worked backwards to find what percentage of day-trippers would need to convert for the share to reach the 20-prefecture median of 14.0%, and to reach the 16.6% Gifu actually recorded in 2024. Total visits are held constant and only the converted portion moves from day-trip to overnight (required conversions = target share × total visits − current overnight visitors).
| Prefecture | Current overnight share |
Spending gap (overnight − day-trip) |
Low status quo |
Mid 14.0% required conversion |
Mid spending increase |
High 16.6% required conversion |
High spending increase |
|---|---|---|---|---|---|---|---|
| Gifu | 8.3% | ¥20,441 | — | 6.3% | ¥47.6bn | 9.1% | ¥69.1bn |
| Akita | 9.5% | ¥20,143 | — | 5.0% | ¥10.7bn | 7.8% | ¥17bn |
| Yamaguchi | 10.2% | ¥14,847 | — | 4.2% | ¥7.9bn | 7.1% | ¥13.3bn |
| Miyagi | 11.1% | ¥15,773 | — | 3.3% | ¥13.5bn | 6.2% | ¥25.4bn |
What the table shows is that the size of the gap in share and the conversion rate needed to close it are not proportional. Gifu is 5.7 points short of the 14.0% median, yet because its day-tripper base is so large the required conversion rate is only 6.3%. Miyagi’s gap is a narrower 2.9 points and its required conversion rate is lower still at 3.3%. On the spending increase, Gifu stands out at ¥47.6bn in the mid case, reflecting both the spending gap (¥20,441) and the sheer volume of day-trippers.
Next, a two-axis sensitivity grid. The rows are spending gaps (the measured values for five prefectures from Table 2) and the columns are conversion rates (0.5% to 2.5%, centred on the 1.0% base case used above), with each cell showing the spending increase per 10 million day-trip visits. The conversion rate is an assumption, not a measured value. Each cell is the simple product of spending gap × conversion rate × visits; no new assumptions are introduced.
| Spending-gap level (measured prefecture) | Conversion 0.5% | Conversion 1.0% | Conversion 1.5% | Conversion 2.0% | Conversion 2.5% |
|---|---|---|---|---|---|
| Gunma (¥10,226) | 5.1 | 10.2 | 15.3 | 20.5 | 25.6 |
| Tokushima (¥12,745) | 6.4 | 12.7 | 19.1 | 25.5 | 31.9 |
| Fukui (¥14,494) | 7.2 | 14.5 | 21.7 | 29.0 | 36.2 |
| Gifu (¥20,441) | 10.2 | 20.4 | 30.7 | 40.9 | 51.1 |
| Kumamoto (¥28,348) | 14.2 | 28.3 | 42.5 | 56.7 | 70.9 |
Between Gunma, with the smallest spending gap (¥10,226), and Kumamoto, with the largest (¥28,348), the same conversion rate produces a 2.8-fold difference in the spending increase. Moving the conversion rate five-fold, from 0.5% to 2.5%, scales the increase five-fold in turn. The division of labour is that the spending gap sets the ceiling and the conversion rate sets where you land within it; in prefectures with small spending gaps, raising conversion runs into a structural limit. Gifu, Kumamoto and Tochigi — large in both day-tripper volume and spending gap — rank highest on either axis.
Note: Tables 5 and 6 are both re-aggregations of figures already presented in this article and do not forecast future accommodation demand. The conversion rates are an assumed range and do not guarantee any actual change in spending behaviour.
How to Use This Analysis — Three Readings and Their Caveats
First, a low overnight share is not a weakness — it shows where the inventory of demand sits. In low-share prefectures, large numbers of people are already travelling to the location. The question is not awareness or traffic generation but the single issue of how to design a reason to stay. The estimate of roughly ¥62.8bn across 20 prefectures from converting 1% of day-trippers is a yardstick for the size of that opening.
Second, prefectural averages conceal municipal-level mismatches. As the Gifu case shows, the busiest visitor sites and the deepest room stock are not necessarily in the same place. When building an area strategy, use the prefectural overnight share as a starting point but always drill down to municipal granularity to check how visitor sites and supply overlap.
Third, the spending gap is a base input for investment decisions. A structure in which overnight visitors spend four to eight times what day-trippers spend gives you material to quantify the local-economy effect of adding a single room of accommodation capacity. In Gifu, 16.6% of visitors generated 65.1% of spending; in Gunma, overnight guests generated 68.1%.
There are caveats. Under the common standard, the method for selecting survey points differs by prefecture and tourist sites are not counted uniformly. The rankings here do not fix positions; they should be treated as structural tendencies. Room stock is also limited to properties whose online listings can be confirmed and is not a complete census. In rural areas in particular a certain number of unlisted ryokan, minshuku and simple lodging houses exist, so actual capacity may be greater than the figures here. For how much of their total rooms properties actually allocate online, see Median 39.2% of Rooms Online — Allocation Across 12,941 Hotels.
The publication lag is also considerable. The last nationwide comparable dataset is calendar 2022, and the prefecture-by-prefecture releases since then have only completed 2024 across late 2025 and early 2026. In a period when accommodation demand is recovering at different speeds by prefecture, we recommend always reading the latest prefectural releases alongside this analysis.
Summary
Calculating overnight-visitor shares from the last nationwide comparable year of the Japan Tourism Agency’s Common Standard Survey on Tourist Visits (calendar 2022, 20 prefectures compiled), the range runs 3.6-fold from a low of 8.3% in Gifu to a high of 29.7% in Wakayama, with a median of 14.0%. On day-trippers per room, Gifu leads at 2,134, followed by Tochigi at 1,781 and Gunma at 1,315 — 4.4 times the bottom-ranked Nagano at 484.
Overnight visitors spend 2.2 to 8.2 times as much per visit as day-trippers. If just 1% of day-trippers stayed one night, the arithmetic adds roughly ¥62.8bn of annual tourism spending across the 20 prefectures. In Gifu’s latest 2024 figures, overnight guests — only 16.6% of visitors — generated 65.1% of tourism spending.
And once you drill down to municipal granularity, visitor sites and room stock do not necessarily line up. In Gifu, 75% of the top ten visitor sites are in the Mino and Seino regions, while 41.8% of rooms are concentrated in Takayama and Gero in Hida. The potential for overnight conversion lies not in the prefectural average but precisely inside that geographic mismatch.
Related Reading
- June 2026 Occupancy 56.2%: Guest-Nights per Room in 47 Prefectures
- H1 2026 ADR YoY: 16 Prefectures Aligned, 31 Split Across 4 Categories
- Japan Autumn ADR 2026: 20 Prefectures Peak in Nov, Kyoto +81.8%
- Median 39.2% of Rooms Online — Allocation Across 12,941 Hotels
- Yamaguchi DC 2026: Hagi ADR +39.6% vs Yamaguchi City +3.1%
References and Sources
■ Government statistics and official data
- Japan Tourism Agency, Common Standard Survey on Tourist Visits (calendar 2022, 20 of 46 prefectures compiled; updated 29 March 2024, page last updated 20 August 2024)
- Japan Tourism Agency, Common Standard for Tourist Visitor Statistics — survey guidelines (established December 2009; partially revised March 2013 and May 2023)
■ Prefectural publications
- Gifu Prefecture, FY2024 Gifu Prefecture Tourist Visitor Survey (Tourism, Culture and Sports Policy Division, Department of Tourism, Culture and Sports, Gifu Prefecture; released 22 December 2025)
- Gunma Prefecture, FY2024 (2024) Tourist Visitor Survey Report (Tourism and Retreat Promotion Division, Strategic Sales Bureau, Department of Industry and Economy, Gunma Prefecture)
- Tochigi Prefecture, Estimated Survey of Tourist Visits and Overnight Stays (Tourism Exchange Division, Department of Industry, Labour and Tourism, Tochigi Prefecture)
- Akita Prefecture, Akita Tourism Statistics (Tourism Strategy Division, Department of Tourism, Culture and Sports, Akita Prefecture)
- Yamaguchi Prefecture, Tourist Movement Survey / FY2024 Tourism Trends Survey (Tourism Policy Division, Department of Tourism, Sports and Culture, Yamaguchi Prefecture)
■ Data sources
Demand-side data comes from the calendar 2022 figures of the Japan Tourism Agency’s Common Standard Survey on Tourist Visits (20 of 46 prefectures compiled, updated 29 March 2024) and from the FY2024 (2024) surveys published individually by Gifu and Gunma prefectures. Supply-side property counts, room counts and estimated transacted ADR are MetroEngines Research aggregates (confirmed-operating basis; ADR is the 12-month average for June 2025 to May 2026), and new openings cover 2024-2026 on a confirmed online-listing basis.
■ Estimation assumptions
Overnight-visitor share = overnight visitors ÷ (overnight visitors + day-trippers). The spending increase at 1% conversion = day-trippers × 1% × (overnight spend − day-trip spend), a simple calculation that holds total visits constant and moves only the converted portion from day-trip to overnight. Required conversion rate in Table 5 = (target share × total visits − current overnight visitors) ÷ day-trippers. Cells in Table 6 = spending gap × conversion rate × 10 million visits. ADR and room counts are area-level medians and totals respectively, so cross-prefecture comparisons carry differences in each prefecture’s mix of property categories.
■ Limitations and caveats
Under the common standard, the method for selecting survey points differs by prefecture, so the results are treated as structural tendencies rather than as fixed rankings. The nationwide compilation ended with the March 2024 release, and 2022 was a year still affected by the pandemic, so overnight-visitor shares read lower than they do today. Room stock is limited to properties whose online listings can be confirmed and is not a complete census, so actual capacity may be greater. The conversion rates in Tables 5 and 6 are an assumed range and neither forecast nor guarantee any actual change in spending behaviour.
■ Market data
- MetroEngines Research — property and room counts by prefecture and municipality (confirmed-operating basis), estimated transacted ADR (June 2025 to May 2026), and newly opened properties (confirmed online-listing basis, 2024-2026)