

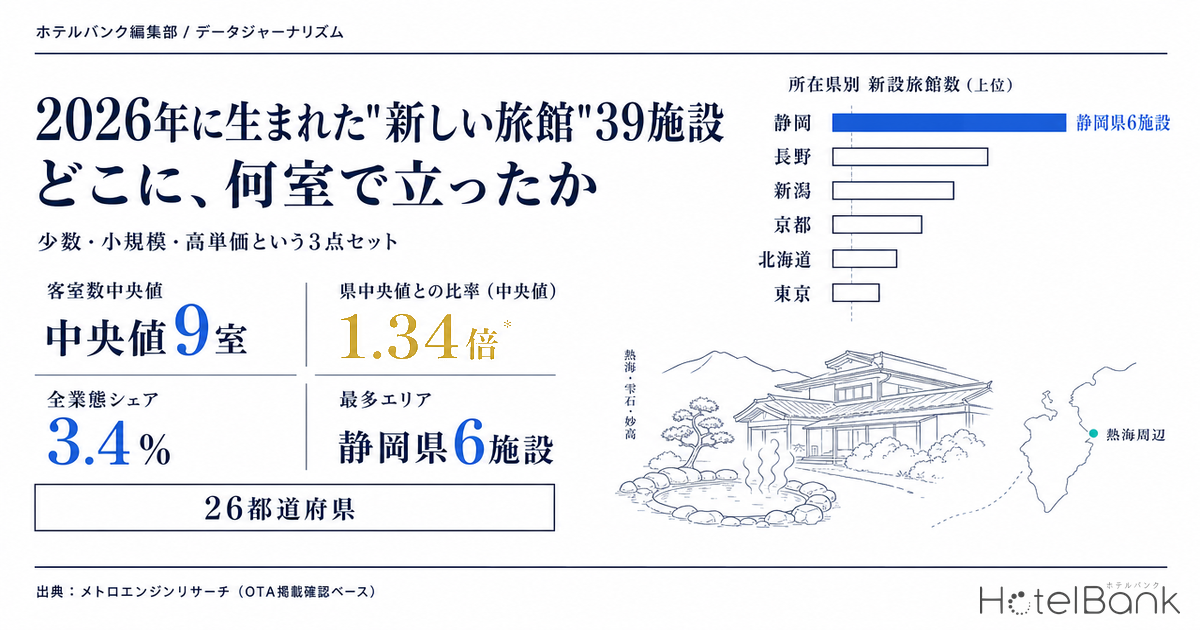
Of all the new lodging facilities that opened in Japan during 2026, those listed under the “ryokan” category numbered 39 facilities with 616 guest rooms. That is only 3.4% of the 1,158 new facilities across all categories, but the median room count per facility is a small 9 rooms, and rates sit at 1.34x (median) the ryokan median of the same prefecture. Few in number, small in scale, high in rate — that is the shape in which Japan’s new ryokan of 2026 have come into being. This article re-counts, within the scope tracked by MetroEngines Research, where these new ryokan opened, at what room count, and at what price.
Metric Definitions Used in This Article
- ADR (average daily rate): an estimated transacted rate (tax-excluded equivalent) calculated by applying a category-specific adjustment coefficient to the lowest publicly listed plan rate on OTAs and other channels (double occupancy, per-room rate, tax-included). Cross-checked against property-level actuals disclosed by listed hotel REITs (91 facilities, most recent 3 months), the median error is approximately 7%. These are estimates and differ from each facility’s actual transacted rates or accounting figures. Area-level ADR is the median of the facilities covered (the level of a typical facility in that area).
- New facility: among facilities tracked by MetroEngines Research, those whose opening date falls in 2026 and whose listing could be confirmed on major OTAs. This is not a complete census.
- Category classification: based on the facility category shown on major OTAs; it does not correspond to the business types defined under Japan’s Hotel Business Act (discussed below).
- Data source: MetroEngines Research (based on confirmed OTA listings)
- — Ryokan newly confirmed as listed in 2026 total 39 facilities and 616 rooms. That is just 3.4% of the 1,158 facilities across all categories, ranking 8th in size among the top 15 categories.
- — The median room count is 9 rooms, and 20 of the 39 facilities (51.3%) have 9 rooms or fewer. Only 8 facilities have 20 rooms or more, and only 3 exceed 50 rooms.
- — Locations are spread across 26 prefectures. Even Shizuoka, the most common, accounts for only 6 facilities (15.4%) — a sharp contrast with machiya townhouses, 31 of whose 33 facilities are concentrated in Kyoto.
- — Across the 32 facilities where an estimated transacted ADR could be observed, the median ratio to the median for the ryokan category in the same prefecture is 1.34x, and 20 facilities (62.5%) exceed their prefectural median.
- — The thinning of counts in later opening months reflects observation lead time. Because capture is triggered by confirmed listings, the most recent and forthcoming months are counted lower than reality.
Of 1,158 new facilities in 2026, ryokan account for 39 facilities and 616 rooms
Start with the overall picture. Within the scope tracked by MetroEngines Research, facilities whose opening date falls in 2026 and whose listing could be confirmed on major OTAs number 1,158, averaging 28 rooms. Splitting this population by category, the largest group is vacation rentals at 545 facilities, or 47.1% of the total. Next come business hotels at 135, facilities with no category assigned at 88, hostels at 66, and guesthouses at 61.
Facilities listed as “ryokan” number 39. Among the 1,145 facilities in the top 15 categories combined, that ranks 8th in size, with a share of just 3.4%. Their rooms total 616, a small slice of all new rooms added in 2026. However, as shown below, on two axes — scale per facility and rate band — ryokan occupy a position clearly distinct from other small-format categories.
Note that this figure of 39 matched on both the record count and the number of returned records at the time of data retrieval, and did not hit the extraction cap (200 records), so there are no omissions for this category. By contrast, in categories such as vacation rentals where the count is pinned to the cap, counting only the returned records would misstate the true number. All aggregations below are calculated after reconciling the record count against the number of returned records.
N=1,158 facilities (opened in 2026, all categories). Source: MetroEngines Research (based on confirmed OTA listings), compiled by the HotelBank Editorial Team
What falls inside the “ryokan” bucket — drawing the line against machiya, minshuku and vacation rentals
It is worth disclosing the category definition here. “Ryokan” in this article refers to facilities whose facility category is displayed as “ryokan” on major OTAs. This is separate from the administrative business-licence classification. Japan’s Hotel Business Act, amended in June 2018, consolidated the separate “hotel business” and “ryokan business” licence types into a single “ryokan and hotel business”, so in legal terms there is today no licence type that distinguishes a Japanese-style inn from a Western-style hotel (Ministry of Health, Labour and Welfare, “2017 Amendment to the Hotel Business Act”). In other words, whether something is “a ryokan” is now determined not by law but by how the market labels it. That amendment, effective 15 June, also permitted single-room operations, and its effect on small-scale, whole-building formats has been examined separately using new-opening data.
Because of this, the difference against adjacent categories shows up in room scale and service format. Ranking 2026 openings by average room count per category gives ryokan at 15.8 rooms, versus cottages at 11.6, pensions at 5.8, minshuku at 5.7, guesthouses at 4.0, machiya at 1.7, and vacation rentals at 1.4 (based on a 200-record capped sample). Machiya and vacation rentals are in most cases listed as “one building = one room”, pushing their averages below 2 rooms. Ryokan can be described as the category with the highest room count among this group of small-format lodging types.
Geographic bias also differs by category. Of the 33 machiya that opened in 2026, 31 are concentrated in Kyoto, making the format effectively Kyoto-specific. Vacation rentals spread across resort areas and their access zones, with 36 facilities in Hokkaido, 18 in Shizuoka and 11 in Hyogo. Against these, the 39 ryokan are scattered across 26 prefectures and do not depend on any single area. When reading the “ryokan” bucket, keep in mind these differences in service format (whole-building rental versus room-by-room rental) and distribution (local concentration versus nationwide dispersion). How much presence whole-building rentals and vacation rentals command in 2026’s new openings is covered from the angle of self-catering and multi-night suitability in Vacation Rentals Lead Japan’s 2026 Hotel Supply.
| Category | New in 2026 | Avg. rooms | Median rooms | Leading prefecture |
|---|---|---|---|---|
| Ryokan | 39 | 15.8 | 9 | Shizuoka (6) |
| Cottage | 42 | 11.6 | 5 | Nagano (5) |
| Pension | 10 | 5.8 | 6 | Nagano (4) |
| Minshuku | 20 | 5.7 | 5 | Mie (3) |
| Guesthouse | 61 | 4.0 | 3 | Hokkaido (5) |
| Machiya | 33 | 1.7 | 1 | Kyoto (31) |
| Vacation rental | 545 | 1.4* | 1* | Hokkaido (36)* |
* Room-count statistics and prefectural breakdown for vacation rentals are based on a 200-record capped sample. Facility counts are complete. Source: MetroEngines Research (based on confirmed OTA listings), compiled by the HotelBank Editorial Team
Where they opened — spread across 26 prefectures, Shizuoka leading with 6
Counting the locations of the 39 facilities by prefecture, they are spread across 26 prefectures. Shizuoka leads with 6 facilities, 4 of which sit around Atami. Nagano follows with 3; Niigata, Kyoto, Hokkaido, Tokyo, Gifu and Fukushima have 2 each; and the remaining 18 prefectures have 1 each. The top prefecture accounts for only 15.4% of the total — a far lower concentration than vacation rentals (36 of a 200-record sample in Hokkaido) or machiya (31 of 33 in Kyoto).
The overlap with hot-spring destinations is clear. Several facilities carry onsen, yu or gensen (hot-spring) terms in their names, and new inns have entered established hot-spring areas such as Atami, Shizukuishi, Myoko, Kamisuwa, Hida-Furukawa and Unzen-Obama. Small new supply landing on land that already has a base of lodging demand — this is the typical way a new ryokan came into being in 2026. Read the other way, it is a location choice that makes it easier to limit early-stage occupancy risk, since demand does not have to be created from scratch.
N=39 facilities (opened in 2026, ryokan category). Source: MetroEngines Research (based on confirmed OTA listings), compiled by the HotelBank Editorial Team
At what room count — half have 9 rooms or fewer, and the median has held at 8–11 for four straight years
Looking at the room-scale distribution, 20 of the 39 facilities (51.3%) have 9 rooms or fewer and 11 (28.2%) have 10–19 rooms. Only 8 have 20 rooms or more, and only 3 exceed 50 rooms. The median is 9 rooms and the average 15.8; the average sits well above the median because a handful of large facilities pull it up. The largest is a 94-room facility in Gunma, followed by 67 rooms in Kyoto and 57 rooms in Iwate.
This “open small” structure is not a single-year phenomenon. Lining up new ryokan over the past four years gives 80 facilities with a median of 8 rooms in 2023, 77 facilities and 9 rooms in 2024, 59 facilities and 11 rooms in 2025, and 39 facilities and 9 rooms in 2026. Facility counts appear to decline year by year, but that is largely an effect of the observation lead time discussed below, while the median has held consistently within an 8–11 room range. The standard size of a new ryokan is high single digits to around 10 rooms — a structure that has held for at least four years.
This size band ties directly to how operations are designed. At around 10 rooms, a small team can run the property and more effort can be devoted per room. As the next section shows, the fact that new ryokan frequently price above the ryokan median of their own prefecture is consistent with this design of limiting room count in order to capture rate.
N=39 facilities (opened in 2026, ryokan category). Source: MetroEngines Research (based on confirmed OTA listings), compiled by the HotelBank Editorial Team
* The 2026 count is a lower bound because listings are still being reflected. Source: MetroEngines Research (based on confirmed OTA listings), compiled by the HotelBank Editorial Team
At what price — 20 of 32 facilities exceed the ryokan median of their own prefecture
Next, the rate band. An estimated transacted ADR for September 2026 could be observed for 32 of the 39 facilities. Comparing those 32 against the median estimated transacted ADR for the ryokan category in their prefecture, the median ratio is 1.34x, and 20 of the 32 (62.5%) exceed their prefectural median. Rather than lining up in the same rate band as existing facilities of the same category, new ryokan tend to be placed above it.
On the high side of the ratio, an 8-room inn in Shizuoka sits at ¥86,200 against a prefectural median of ¥17,100 (5.05x), a 19-room inn in Hokkaido at ¥62,900 against ¥12,800 (4.93x), and an 8-room inn in Fukushima at ¥57,800 against ¥12,500 (4.61x). All are small facilities in the low-teens of rooms or fewer, designed to limit room count and target a high rate band. Even facilities with some scale sit in the 2–3x band relative to their prefectural median: a 26-room inn in Shizuoka at ¥56,400 (3.31x) and a 94-room facility in Gunma at ¥42,900 (2.71x).
On the other hand, 12 facilities are placed at or below their prefectural median. A 34-room inn in Fukui is at ¥11,500 (0.95x) and a 17-room inn in Fukuoka at ¥10,400 (0.80x), both close to their prefectural median. Both opened on 1 September 2026 and, at the time of writing, had only just started selling. Immediately after opening, the number of listed plans is limited and introductory pricing is often in place, so the level at this stage is not necessarily the eventual steady-state level. It is more natural to read it as a stage that still leaves room to rebuild the rate band once occupancy results have accumulated. On how long it actually takes for rates to ramp up after opening, New Hotel ADR Ramp-Up: 91 Japan Openings Split Into 4 Pricing Types tracks 91 facilities that opened in 2025.
N=32 facilities (2026-opened ryokan with an observable estimated transacted ADR). Source: MetroEngines Research, compiled by the HotelBank Editorial Team
The 19 new ryokan with 10 rooms or more — ranked by scale
The 19 facilities that opened with 10 rooms or more are listed below in order of scale. ADR is the estimated transacted ADR for September 2026, and the prefectural median is the area median for the same month and same category (ryokan). “Not observed” indicates a facility for which listed rates for that month could not be sufficiently observed at the time of writing.
| Prefecture | Facility | Rooms | Opened | ADR (Sep 2026) | Prefectural median | Ratio |
|---|---|---|---|---|---|---|
| Gunma | Hoshino Resorts KAI Kusatsu (星野リゾート界草津) | 94 | 06/07 | ¥42,900 | ¥15,900 | 2.71x |
| Kyoto | Omuro Kadensho (御室花伝抄) | 67 | 06/21 | ¥26,600 | ¥19,800 | 1.34x |
| Iwate | Gensen Ichizu Iwate Shizukuishi (源泉一途 岩手雫石) | 57 | 07/01 | ¥19,700 | ¥10,700 | 1.84x |
| Nagasaki | Unzen Obama Sunset Showakan (雲仙小浜サンセット昭和館) | 41 | 07/01 | Not observed | ¥13,800 | — |
| Fukui | Ryokan Otani (旅館 大谷) | 34 | 09/01 | ¥11,500 | ¥12,100 | 0.95x |
| Shizuoka | SHIJIMA ATAMI | 26 | 08/01 | ¥56,400 | ¥17,100 | 3.31x |
| Shizuoka | Atami New Mimatsu (熱海ニュー美松) | 20 | 03/15 | ¥10,400 | ¥17,100 | 0.61x |
| Shizuoka | Sumiyoshikan (すみよし館) | 20 | 01/01 | Not observed | ¥17,100 | — |
| Hokkaido | Otaru Retreat Kuramure by Onkochishin (小樽リトリート 蔵群 by 温故知新) | 19 | 02/24 | ¥62,900 | ¥12,800 | 4.93x |
| Shizuoka | Gensen Yumeguri Tsuki no Mure (源泉湯めぐり月の群れ) | 18 | 06/01 | ¥56,500 | ¥17,100 | 3.31x |
| Kumamoto | Oyado Satsuki (御宿 皐月) | 18 | 04/25 | ¥18,800 | ¥17,500 | 1.08x |
| Fukuoka | noyado Hakata (乃宿-noyado-博多) | 17 | 09/01 | ¥10,400 | ¥13,000 | 0.80x |
| Chiba | Ippe (いっぺ) | 16 | 06/23 | ¥41,500 | ¥14,000 | 2.97x |
| Okayama | 烏石の庵 | Okayama Castle Town Hotel | 14 | 05/01 | ¥17,900 | ¥14,000 | 1.28x |
| Oita | Oyado Yu no Shizuku (御宿 湯のしずく) | 12 | 10/02 | Not observed | ¥18,000 | — |
| Saga | Nakao Jinroku HOTEL (中尾甚六HOTEL) | 11 | 01/30 | ¥24,000 | ¥18,100 | 1.33x |
| Yamanashi | HOTEL Mt.Fuji MoMoAung 桃庵 | 11 | 03/01 | ¥10,700 | ¥13,900 | 0.77x |
| Nagano | mont | 10 | 01/19 | ¥20,400 | ¥14,500 | 1.40x |
| Tokyo | Hotel Okugen (ホテル奥源) | 10 | 03/09 | ¥9,400 | ¥14,000 | 0.67x |
N=19 facilities (opened in 2026, ryokan category, 10+ rooms). Prefectural medians are based on N=49–484 facilities. Source: MetroEngines Research (based on confirmed OTA listings), compiled by the HotelBank Editorial Team
How to read the observation lead time — thin later months are not the reality of supply
Finally, one caveat on how to read these numbers. Lining up the 39 new ryokan of 2026 by opening month gives 4 in January, 7 in February, 9 in March, 3 in April, 2 in May, 5 in June, 5 in July, 1 in August, 2 in September and 1 in October — thinning out as the year progresses. The same holds across all 1,158 facilities, falling from 237 in January to 10 in September and 4 in November.
This does not mean supply is stopping. Our data captures openings using confirmed listings on major OTAs as the trigger, and listings only appear from a few months before opening. Among facilities that opened in 2024–2025, only 19% had a listing in advance of opening, while 31% were confirmed as listed 91 days or more after opening. Consequently, months close to the time of writing (12 August 2026) and months still ahead are counted lower than reality. As further listings are added, counts for the second half of 2026 are expected to rise. The fact that 2026’s 39 facilities appear to fall short of 2025’s 59 and 2024’s 77 in a year-on-year comparison is largely due to the same reason.
Given this structure, what can be said with confidence about new ryokan in 2026 at this point is not the absolute level of facility counts, but three things: that the median scale is 9 rooms, that they are spread across 26 prefectures, and that rates are placed at 1.34x (median) the ryokan median of the same prefecture.
⚠ Note on ADR for future dates: ADR figures for September 2026 onward in this article are estimates based on selling prices publicly listed on OTAs and other channels at the time of research, and will shift as the check-in date approaches. Note in particular that facilities that have just opened carry few listed plans, leaving substantial room for movement through plan additions and rate adjustments.
How far the rate band can swing — restated using the observed ratio range
The figures above are restated here as they stand. The estimated transacted ADR of a new ryokan can be expressed as “the median for the ryokan category in the same prefecture x a ratio”. The ratio comes from the observed distribution across 32 facilities and the prefectural medians from the observed values for the 26 prefectures covered by this article, so every table below is a multiplication of figures already presented in the text and contains no new estimate or forecast.
| Case | Ratio to prefectural median | If the prefectural median is ¥9,600 | If ¥14,300 | If ¥21,300 | How to read it |
|---|---|---|---|---|---|
| Conservative case (lower quartile) | 0.78x | ¥7,500 | ¥11,100 | ¥16,600 | The lower quartile of the ratio distribution across 32 facilities. A level that includes many facilities that have just opened with thin plan listings. |
| Mid case (median) | 1.34x | ¥12,800 | ¥19,100 | ¥28,500 | The median ratio across the 32 facilities — the same level shown in the main text. |
| Bullish case (upper quartile) | 2.56x | ¥24,500 | ¥36,600 | ¥54,400 | The upper quartile of the ratio distribution across 32 facilities. A level where facilities designed to target a high rate band with room counts in the low teens or fewer cluster. |
Ratios are the distribution across the 32 facilities with an observable estimated transacted ADR (lower quartile 0.78x, median 1.34x, upper quartile 2.56x); prefectural medians are the observed range for the ryokan category across the 26 prefectures covered. Source: MetroEngines Research, compiled by the HotelBank Editorial Team
Widen the frame and the rate band a “new ryokan” is placed in differs by an order of magnitude. Both the prefectural median level (vertical axis) and the ratio (horizontal axis) are values observed in this article, and each cell is their product.
| Median estimated transacted ADR for ryokan in the same prefecture | 0.46x (minimum) | 0.78x (lower quartile) | 1.34x (median) | 2.56x (upper quartile) | 5.05x (maximum) |
|---|---|---|---|---|---|
| ¥9,600(minimum of the 26 prefectures) | ¥4,400 | ¥7,500 | ¥12,800 | ¥24,500 | ¥48,400 |
| ¥12,800(lower band) | ¥5,900 | ¥10,000 | ¥17,100 | ¥32,700 | ¥64,400 |
| ¥14,300(median of the 26 prefectures) | ¥6,600 | ¥11,100 | ¥19,100 | ¥36,600 | ¥72,200 |
| ¥17,100(upper band) | ¥7,800 | ¥13,300 | ¥22,900 | ¥43,700 | ¥86,100 |
| ¥21,300(maximum of the 26 prefectures) | ¥9,800 | ¥16,600 | ¥28,500 | ¥54,400 | ¥107,400 |
Vertical axis = median estimated transacted ADR for the ryokan category across the 26 prefectures covered (minimum to maximum); horizontal axis = the five levels of the ratio to the prefectural median observed across 32 facilities. Cells are the product of the two and are not actual results for individual facilities. Source: MetroEngines Research, compiled by the HotelBank Editorial Team
There are two practical implications. First, the swing in the ratio (0.46x–5.05x, about 11-fold) is larger than the difference in prefectural medians themselves (¥9,600–¥21,300, about 2.2-fold). The design decision of which rate band to occupy within a prefecture drives the observed rate more strongly than the prevailing market level of the prefecture itself. Second, the 0.78x level at the lower quartile is not necessarily a steady-state figure. As noted in the main text, facilities that have just opened carry thin plan listings and retain room to rebuild their rate band once occupancy results have accumulated.
Summary — a three-part set: few, small, and high-rate
The ryokan newly born in 2026 number 39 facilities and 616 rooms within the scope tracked by MetroEngines Research. That is a small 3.4% share of the 1,158 facilities across all categories, but the substance has clear characteristics. The median room count is 9, a level that has stayed between the high single digits and the low teens for four consecutive years since 2023. Locations are spread across 26 prefectures, with a visible pattern of entering existing hot-spring areas on a small scale. Rates sit at 1.34x (median) the ryokan median of the same prefecture, and 20 of the 32 facilities exceed their prefectural median.
Unlike machiya and vacation rentals, which centre on whole-building rental, the “ryokan” bucket contains inns in a size band that holds multiple guest rooms while remaining operable by a small team. This size band makes it easier to reconcile a rate-capturing design with operating efficiency. Seven facilities opened recently enough that listings remain thin, and these are at a stage where they can rebuild their rate design once occupancy results have accumulated. As further listings are added, the full picture of 2026 will gain more depth, making this a theme worth counting again.
For hotels: what works in plan names in the ryokan category
The most common appeal elements in publicly listed plan names in the ryokan category (N=469) —
2 meals included 35%breakfast included 20%open-air hot-spring bath 19%kaiseki course 18%room only 16%seafood 10%
Examples of actual names (anonymised):
- [Homemade breakfast buffet included / natural hot-spring public bath on site]
- [Our most popular plan] Abalone grilled on a ceramic plate and a Japanese set menu of local pork, plus full hot-spring enjoyment
* These are tendencies based on aggregated public plan names and do not demonstrate a causal relationship between naming and sales.
Related reading
- H1 2026 ADR YoY: 16 Prefectures Aligned, 31 Split Across 4 Categories
- Japan Autumn ADR 2026: 20 Prefectures Peak in Nov, Kyoto +81.8%
- Saitama Hotel Rates Vary 4.8x by Municipality: 35 Areas, 5 Tiers
- Vacation Rentals Lead Japan’s 2026 Hotel Supply — 48.2% of 758 New Openings
- New Hotel ADR Ramp-Up: 91 Japan Openings Split Into 4 Pricing Types
References and Sources
■ Data sources
Among facilities tracked by MetroEngines Research, those whose opening date falls in 2026 and whose listing could be confirmed on major OTAs (N=1,158 facilities, of which the ryokan category is N=39 facilities and 616 rooms). Aggregations by category, prefecture and opening month are calculated from this population, with the extraction count reconciled against the number of returned records every time. Rates are the facility-level estimated transacted ADR (N=32 facilities) and the area median by prefecture x ryokan category (N=49–484 facilities), both for September 2026. Prior-year comparisons use the same category: 80 facilities in 2023, 77 in 2024 and 59 in 2025.
■ Calculation assumptions
The ratio to the prefectural median is calculated as “a facility’s estimated transacted ADR ÷ the median estimated transacted ADR for the ryokan category in the same prefecture”, covering only the 32 facilities where both could be observed in the same month (September 2026). The rate quick-reference table is the product of the observed distribution of that ratio (minimum 0.46x, lower quartile 0.78x, median 1.34x, upper quartile 2.56x, maximum 5.05x) and the observed range of prefectural medians across the 26 prefectures covered (¥9,600–¥21,300); it is not a forecast or a profit-and-loss estimate for any individual facility. Median room counts are rounded to whole numbers (the observed values are 7.5 rooms for 2023, 4.5 rooms for cottages and 5.5 rooms for pensions).
■ Limitations and caveats
(1) This is not a complete census but capture triggered by confirmed listings on major OTAs, so months close to the time of writing and months still ahead are counted lower than reality. Year-on-year comparisons of facility counts cannot be read directly as increases or decreases in supply volume. (2) Category classification is based on the facility category shown on OTAs and does not correspond to the business types defined under Japan’s Hotel Business Act. (3) Room-count statistics and the prefectural breakdown for vacation rentals are based on a 200-record capped sample (facility counts alone are complete). (4) The estimated transacted ADR is an estimate obtained by applying category-specific coefficients to publicly listed selling prices, and differs from actual transacted rates or accounting figures. Figures from September 2026 onward are for future dates and will shift as the check-in date approaches. (5) The 7 facilities that opened recently enough to have thin listings are excluded from the rate comparison.
■ Market data
- MetroEngines Research (based on confirmed OTA listings) — list of facilities opened in 2026 (N=1,158 facilities, of which the ryokan category is N=39), aggregations by category, prefecture and month, and comparison with the same category for 2023–2025
- MetroEngines Research — estimated transacted ADR (facility level N=32 facilities; prefecture x ryokan category N=49–484 facilities, September 2026)
■ Legislation and government materials
- Ministry of Health, Labour and Welfare, “2017 Amendment to the Hotel Business Act” (consolidation of hotel business and ryokan business into “ryokan and hotel business”, effective 15 June 2018)
- Ministry of Health, Labour and Welfare, “Hotel Business” page
- e-Stat, “Report on Public Health Administration and Services”: number of facilities and rooms for ryokan and hotel businesses, and number of facilities for simple lodging and boarding-house businesses (by prefecture)
- Statistics Bureau of Japan, Statistics FAQ: “Number of hotels, ryokan and other facilities and number of business closures”